| Param | Original file | Final file |
|---|---|---|
| Filename | modeM0/AS1A05_165T07_9000003062_20713cztM0_level2.evt | modeM0/AS1A05_165T07_9000003062_20713cztM0_level2_quad_clean.evt |
| Size (bytes) | 480,792,960 | 109,408,320 |
| Size | 458.5 MB | 104.3 MB |
| Events in quadrant A | 3,223,133 | 758,250 |
| Events in quadrant B | 3,590,808 | 734,348 |
| Events in quadrant C | 3,233,232 | 700,530 |
| Events in quadrant D | 4,100,273 | 695,300 |
| Mode SS | |||
|---|---|---|---|
| Quadrant | BADHDUFLAG | Total packets | Discarded packets |
| A | 0 | 124 | 0 |
| B | 0 | 124 | 0 |
| C | 0 | 124 | 0 |
| D | 0 | 124 | 0 |
| Mode M0 | |||
|---|---|---|---|
| Quadrant | BADHDUFLAG | Total packets | Discarded packets |
| A | 0 | 13332 | 1 |
| B | 0 | 14492 | 1 |
| C | 0 | 13424 | 1 |
| D | 0 | 16248 | 1 |
| Mode M9 | |||
|---|---|---|---|
| Quadrant | BADHDUFLAG | Total packets | Discarded packets |
| A | 0 | 13 | 0 |
| B | 0 | 13 | 0 |
| C | 0 | 13 | 0 |
| D | 0 | 13 | 0 |
| Quadrant | Total seconds | Saturated seconds | Saturation percentage |
|---|---|---|---|
| A | 6088 | 104 | 1.708279% |
| B | 6088 | 170 | 2.792378% |
| C | 6088 | 135 | 2.217477% |
| D | 6089 | 311 | 5.107571% |
Noise dominated data is calculated using 1-second bins in cleaned event files. If a bin has >2000 counts, and if more than 50% of those come from <1% of pixels, then it is considered to be noise-dominated and hence unusable.
| Quadrant | # 1 sec bins | Bins with >0 counts | Bins with >2000 counts | High rate bins dominated by noise | Noise dominated (total time) | Noise dominated (detector-on time) | Marked lightcurve |
|---|---|---|---|---|---|---|---|
| A | 7398 | 6089 | 1 | 1 | 0.01% | 0.02% | 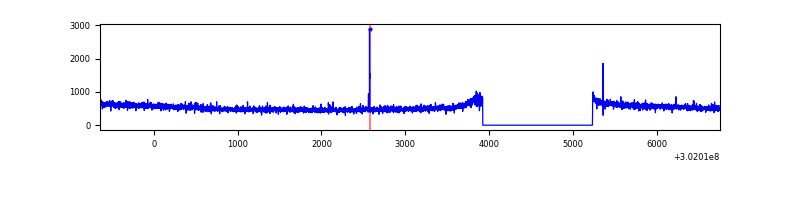 |
| B | 7398 | 6089 | 40 | 40 | 0.54% | 0.66% | 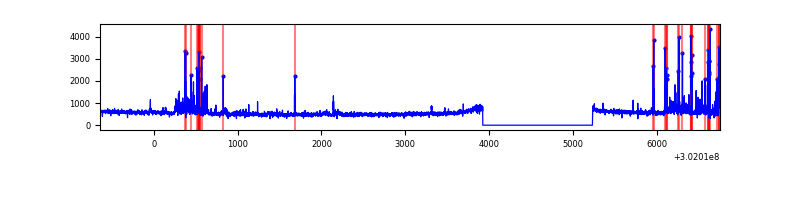 |
| C | 7398 | 6089 | 0 | 0 | 0.00% | 0.00% | 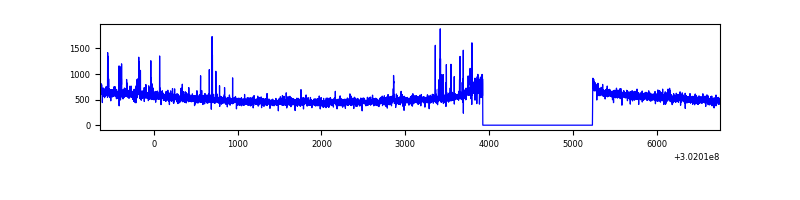 |
| D | 7399 | 6090 | 182 | 182 | 2.46% | 2.99% |  |
Top three noisy pixels from each quadrant. If the there are fewer than three noisy pixels in the level2.evt file, extra rows are filled as -1
| Pixel properties | Quadrant properties | ||||||
|---|---|---|---|---|---|---|---|
| Quadrant | DetID | PixID | Counts | Sigma | Mean | Median | Sigma |
| A | 9 | 143 | 8263 | 44.63 | 836 | 822 | 166.7 |
| A | 0 | 226 | 7472 | 39.89 | 836 | 822 | 166.7 |
| A | 3 | 137 | 6243 | 32.51 | 836 | 822 | 166.7 |
| B | 7 | 220 | 294314 | 1941.33 | 806 | 788 | 151.2 |
| B | 0 | 229 | 51306 | 334.12 | 806 | 788 | 151.2 |
| B | 3 | 64 | 39584 | 256.59 | 806 | 788 | 151.2 |
| C | 14 | 238 | 125075 | 701.46 | 772 | 779 | 177.2 |
| C | 7 | 247 | 82611 | 461.81 | 772 | 779 | 177.2 |
| C | 3 | 233 | 9329 | 48.25 | 772 | 779 | 177.2 |
| D | 5 | 222 | 456908 | 2396.28 | 798 | 776 | 190.4 |
| D | 1 | 52 | 382352 | 2004.6 | 798 | 776 | 190.4 |
| D | 12 | 233 | 161813 | 846.0 | 798 | 776 | 190.4 |
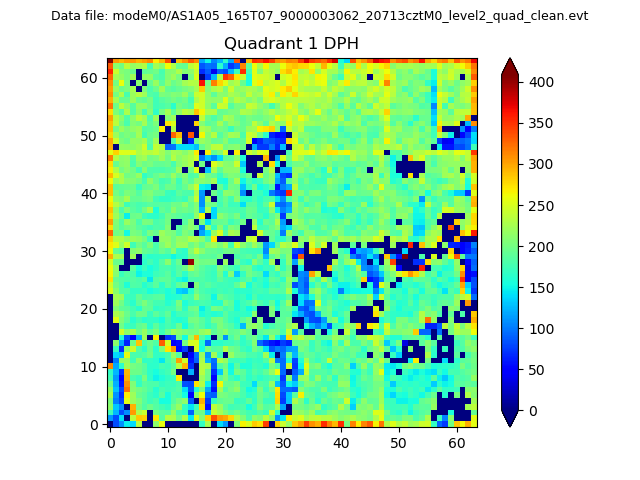
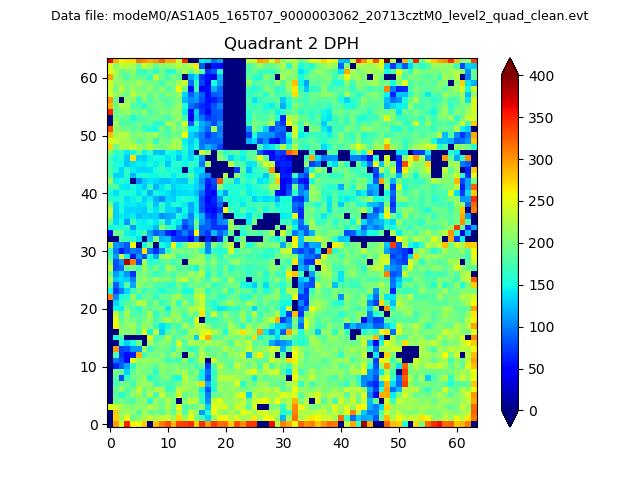
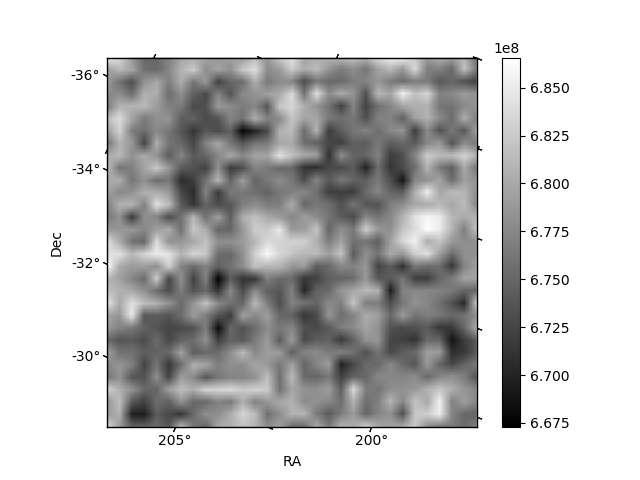
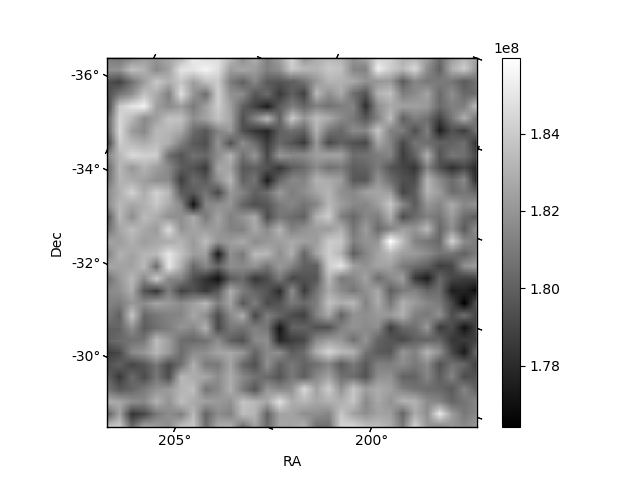
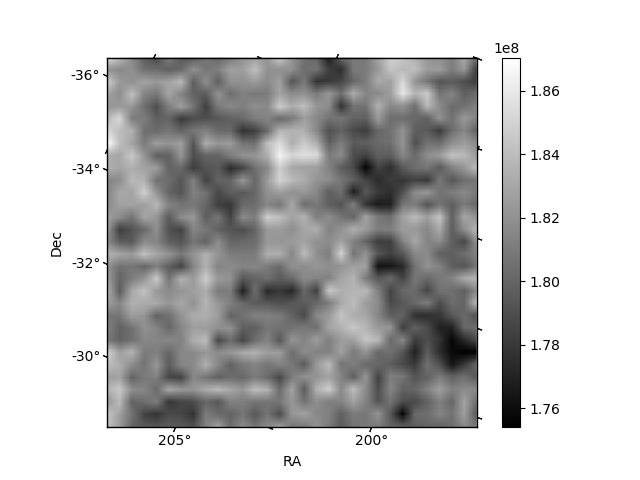
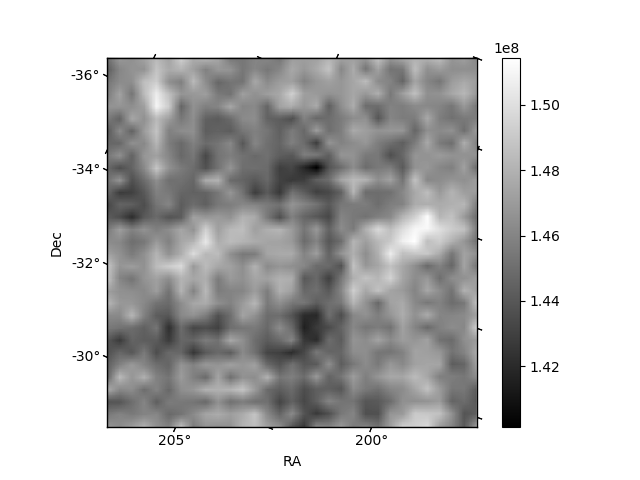
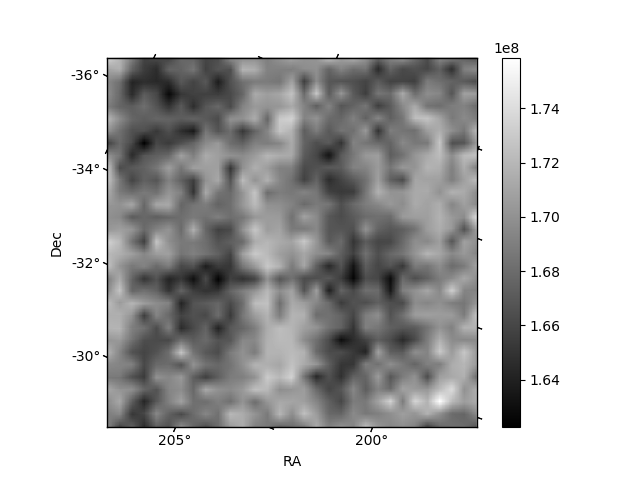
Histogram calculated using DETX and DETY for each event in the final _common_clean file
| Quadrant A | 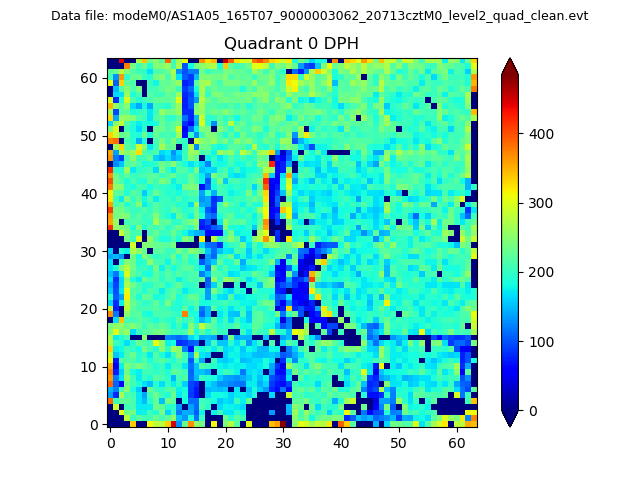 |
 |
Quadrant B |
|---|---|---|---|
| Quadrant D | 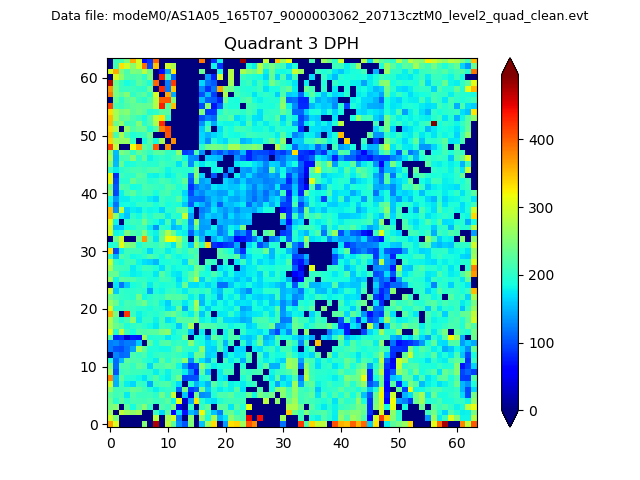 |
 |
Quadrant C |
| Plot type | Count rate plots | Images |
|---|---|---|
| Comparison with Poisson distribution Blue bars denote a histogram of data divided into 1 sec bins. Red curve is a Poisson curve with rate = median count rate of data. |
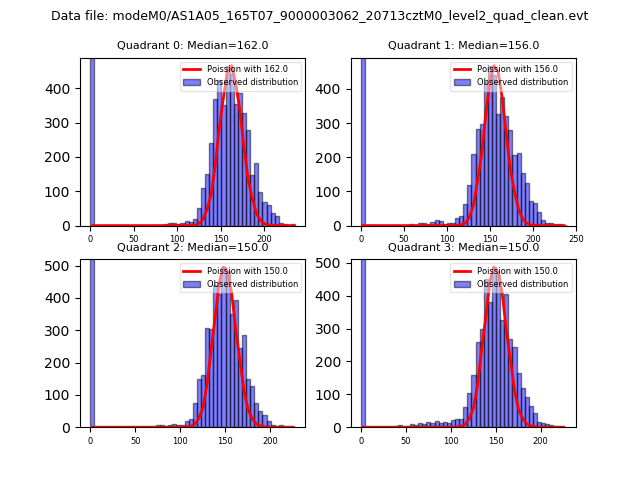 |
 |
| Quadrant-wise count rates Data is divided into 100 sec bins |
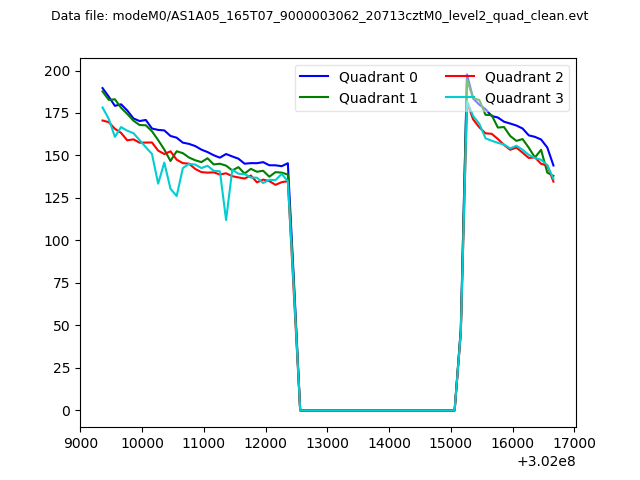 |
|
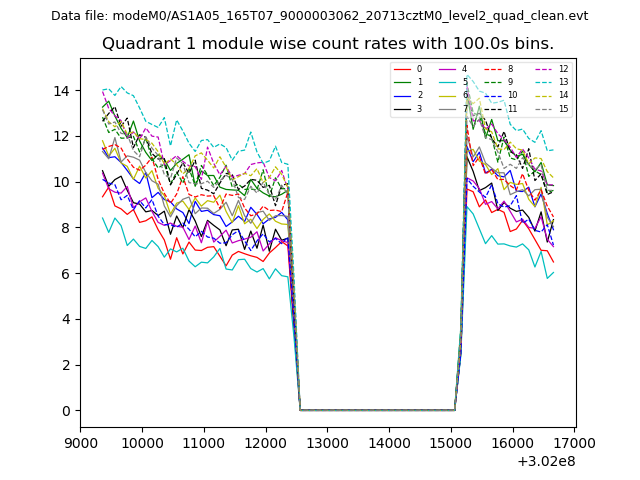
| Module-wise count rates for Quadrant A Data is divided into 100 sec bins |
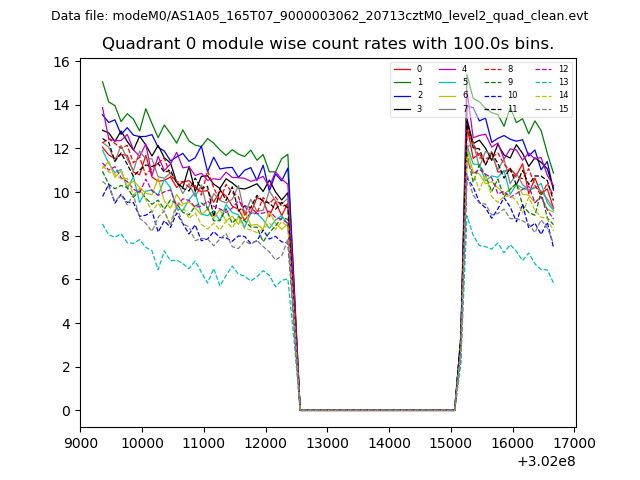 |
 |
| Module-wise count rates for Quadrant B Data is divided into 100 sec bins |
 |
 |
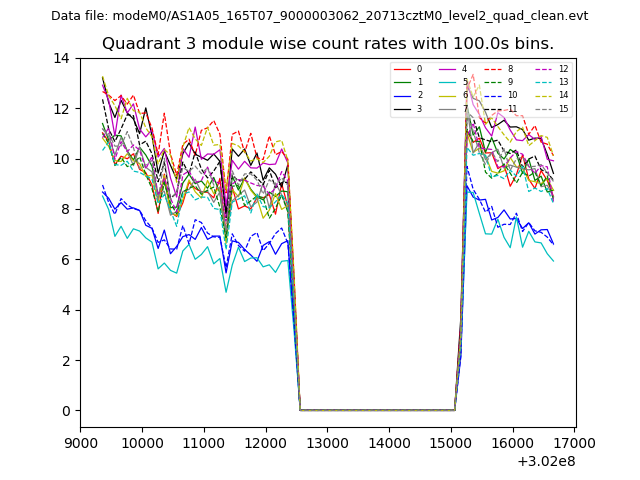
| Module-wise count rates for Quadrant C Data is divided into 100 sec bins |
 |
 |
| Module-wise count rates for Quadrant D Data is divided into 100 sec bins |
 |
 |
| Parameter | Plot |
|---|---|
| CZT HV Monitor | 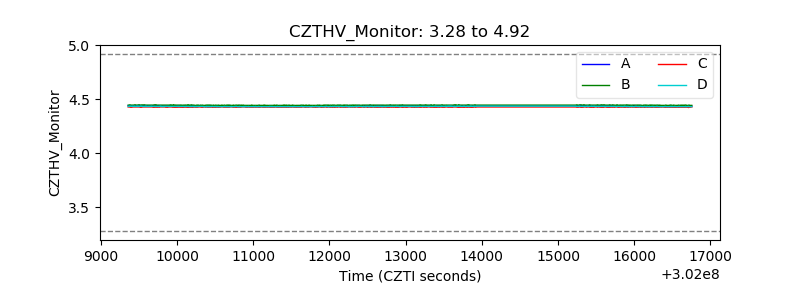 |
| D_VDD |  |
| Temperature 1 | 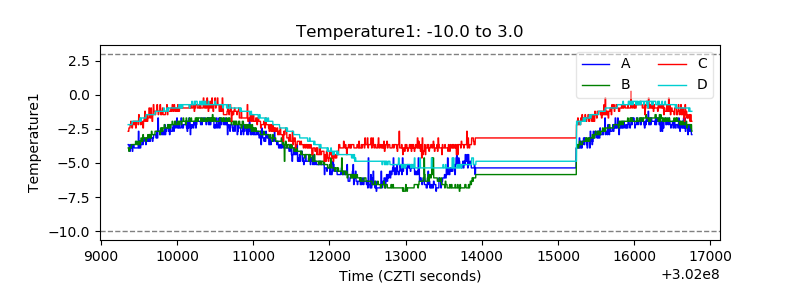 |
| Veto HV Monitor | 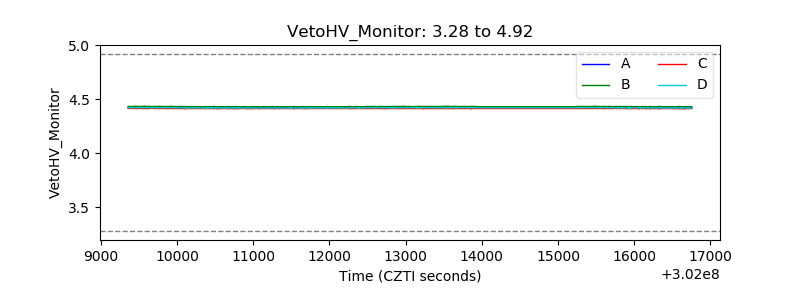 |
| Veto LLD | 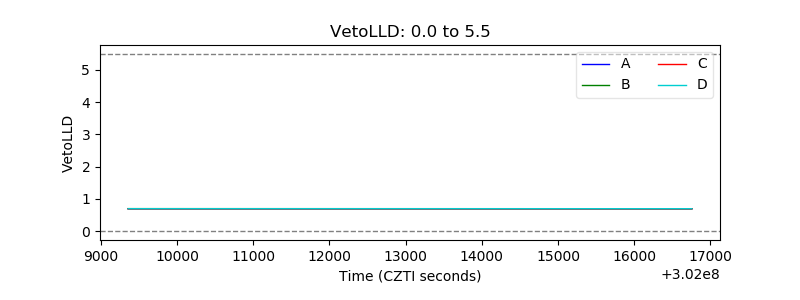 |
| Alpha Counter | 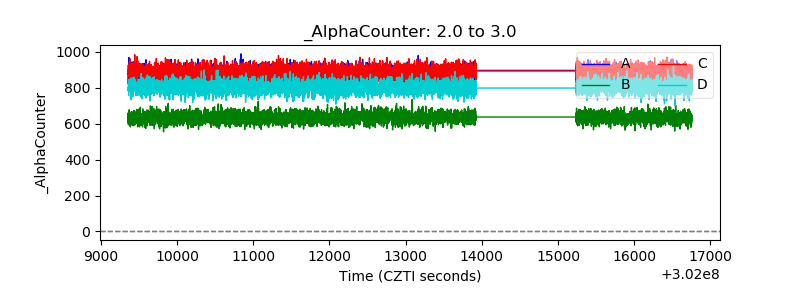 |
| _CPM_Rate | 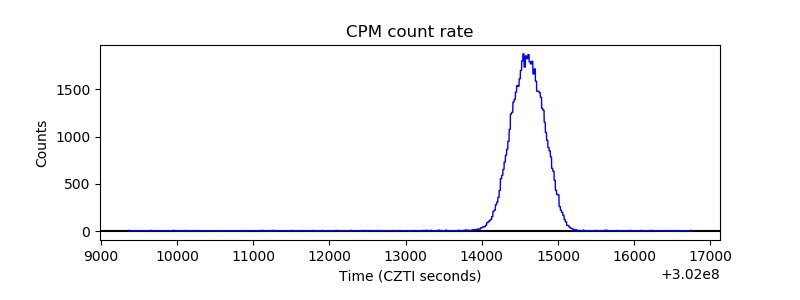 |
| CZT Counter | 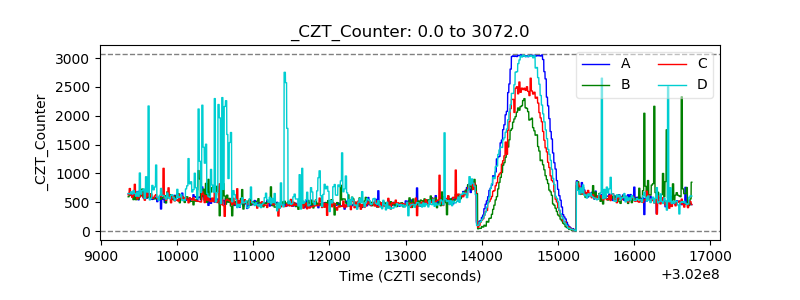 |
| +2.5 Volts monitor |  |
| +5 Volts monitor |  |
| _ROLL_ROT | 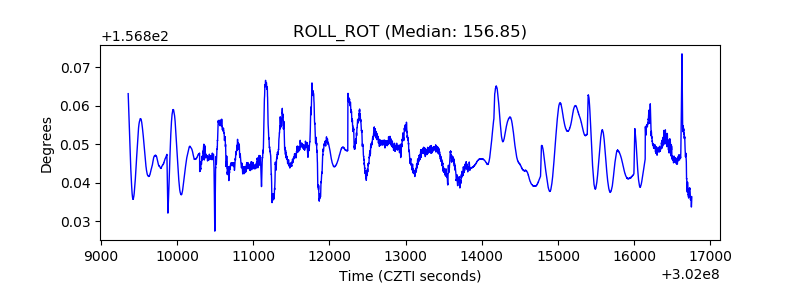 |
| _Roll_DEC | 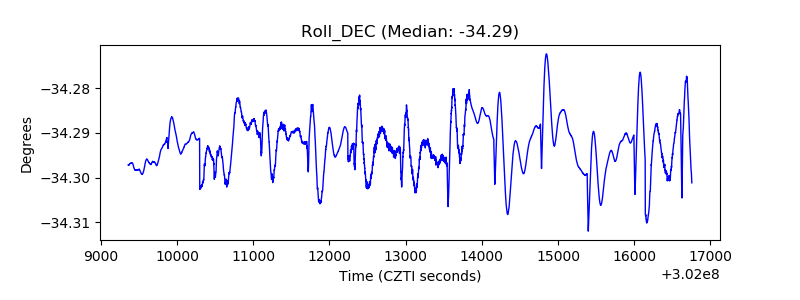 |
| _Roll_RA | 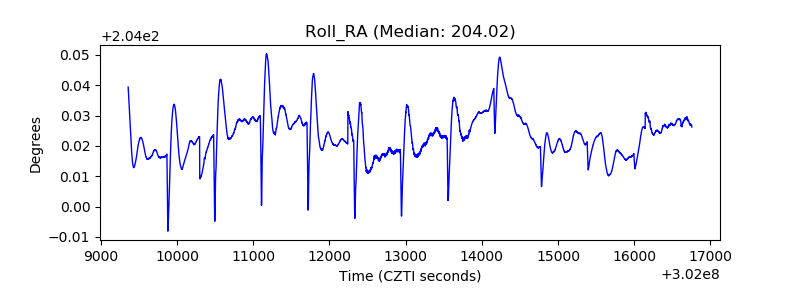 |
| Veto Counter | 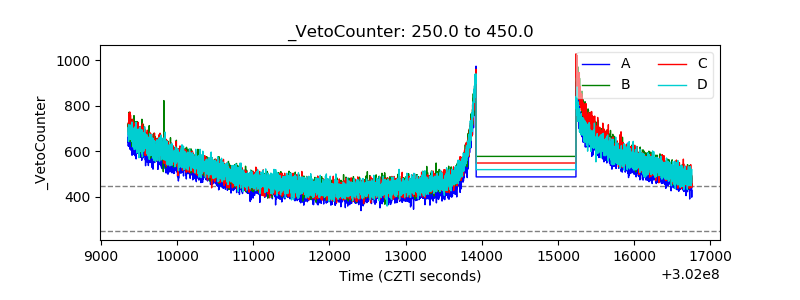 |