| Param | Original file | Final file |
|---|---|---|
| Filename | modeM0/AS1A05_165T07_9000003062_20714cztM0_level2.evt | modeM0/AS1A05_165T07_9000003062_20714cztM0_level2_quad_clean.evt |
| Size (bytes) | 438,681,600 | 89,205,120 |
| Size | 418.4 MB | 85.1 MB |
| Events in quadrant A | 2,943,959 | 604,214 |
| Events in quadrant B | 3,269,914 | 583,718 |
| Events in quadrant C | 2,897,589 | 558,210 |
| Events in quadrant D | 3,778,946 | 549,013 |
| Mode SS | |||
|---|---|---|---|
| Quadrant | BADHDUFLAG | Total packets | Discarded packets |
| A | 0 | 118 | 0 |
| B | 0 | 118 | 0 |
| C | 0 | 118 | 0 |
| D | 0 | 118 | 0 |
| Mode M0 | |||
|---|---|---|---|
| Quadrant | BADHDUFLAG | Total packets | Discarded packets |
| A | 0 | 12253 | 1 |
| B | 0 | 13457 | 1 |
| C | 0 | 12192 | 1 |
| D | 0 | 14855 | 1 |
| Mode M9 | |||
|---|---|---|---|
| Quadrant | BADHDUFLAG | Total packets | Discarded packets |
| A | 0 | 12 | 0 |
| B | 0 | 12 | 0 |
| C | 0 | 12 | 0 |
| D | 0 | 12 | 0 |
| Quadrant | Total seconds | Saturated seconds | Saturation percentage |
|---|---|---|---|
| A | 5812 | 94 | 1.617343% |
| B | 5813 | 148 | 2.546018% |
| C | 5813 | 111 | 1.909513% |
| D | 5813 | 342 | 5.883365% |
Noise dominated data is calculated using 1-second bins in cleaned event files. If a bin has >2000 counts, and if more than 50% of those come from <1% of pixels, then it is considered to be noise-dominated and hence unusable.
| Quadrant | # 1 sec bins | Bins with >0 counts | Bins with >2000 counts | High rate bins dominated by noise | Noise dominated (total time) | Noise dominated (detector-on time) | Marked lightcurve |
|---|---|---|---|---|---|---|---|
| A | 7062 | 5813 | 0 | 0 | 0.00% | 0.00% |  |
| B | 7063 | 5814 | 33 | 33 | 0.47% | 0.57% | 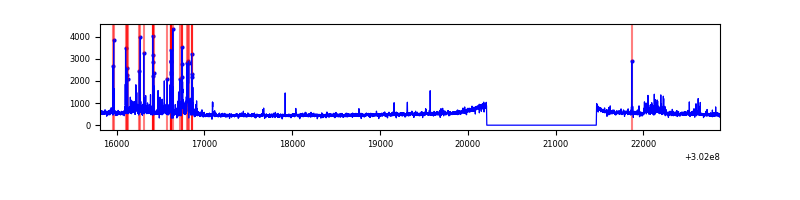 |
| C | 7063 | 5814 | 0 | 0 | 0.00% | 0.00% | 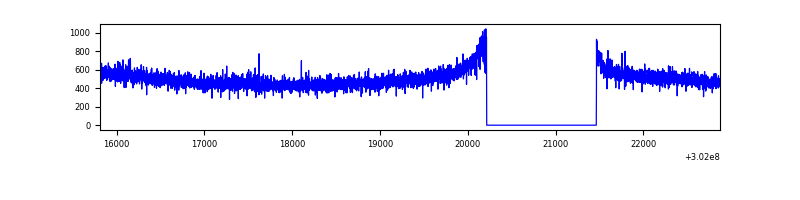 |
| D | 7063 | 5814 | 204 | 204 | 2.89% | 3.51% | 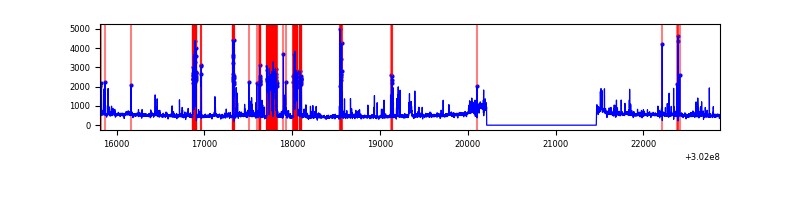 |
Top three noisy pixels from each quadrant. If the there are fewer than three noisy pixels in the level2.evt file, extra rows are filled as -1
| Pixel properties | Quadrant properties | ||||||
|---|---|---|---|---|---|---|---|
| Quadrant | DetID | PixID | Counts | Sigma | Mean | Median | Sigma |
| A | 0 | 226 | 6836 | 39.35 | 765 | 749 | 154.7 |
| A | 3 | 137 | 5822 | 32.8 | 765 | 749 | 154.7 |
| A | 12 | 194 | 5609 | 31.42 | 765 | 749 | 154.7 |
| B | 7 | 220 | 249120 | 1756.26 | 743 | 726 | 141.4 |
| B | 3 | 64 | 58179 | 406.22 | 743 | 726 | 141.4 |
| B | 0 | 190 | 20598 | 140.5 | 743 | 726 | 141.4 |
| C | 14 | 238 | 114825 | 696.92 | 706 | 713 | 163.7 |
| C | 7 | 247 | 11451 | 65.58 | 706 | 713 | 163.7 |
| C | 3 | 233 | 11442 | 65.53 | 706 | 713 | 163.7 |
| D | 1 | 52 | 621994 | 3594.29 | 722 | 701 | 172.9 |
| D | 5 | 222 | 155343 | 894.63 | 722 | 701 | 172.9 |
| D | 1 | 239 | 104114 | 598.26 | 722 | 701 | 172.9 |
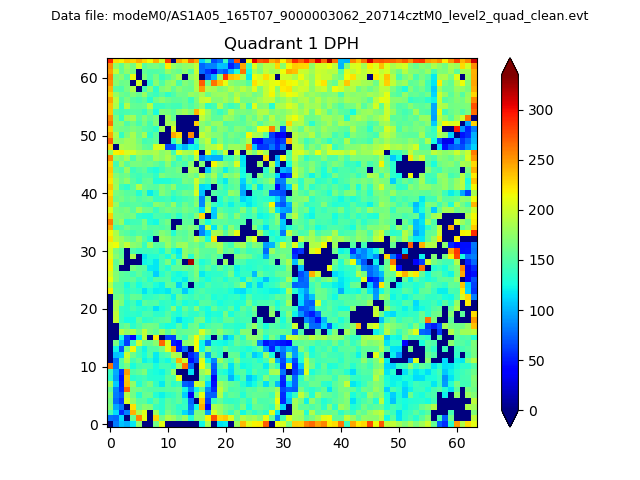
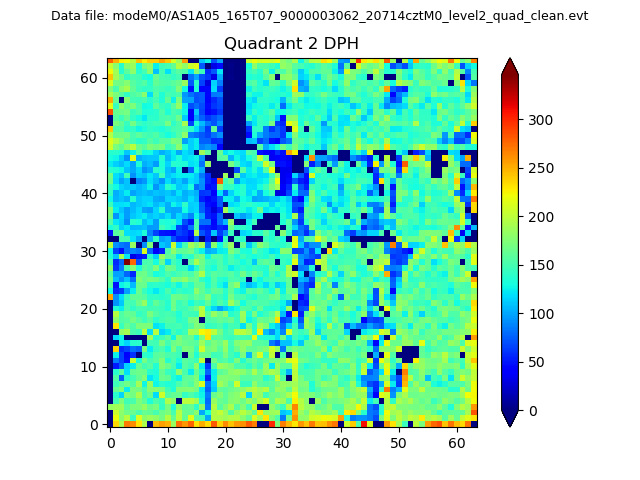
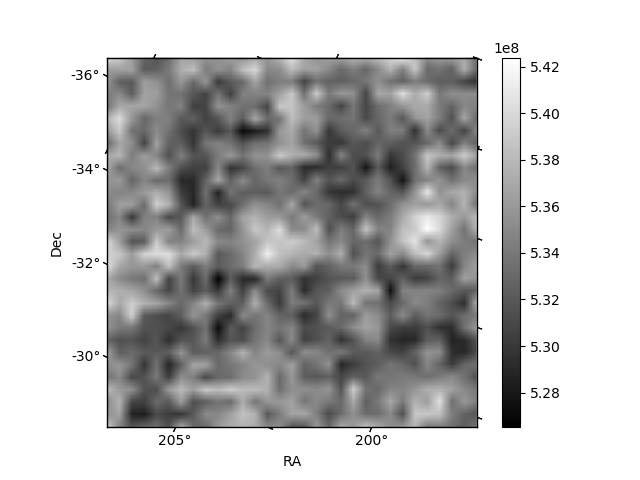
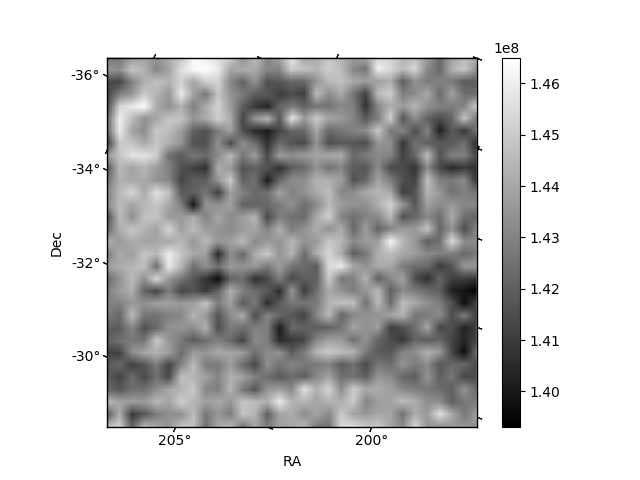
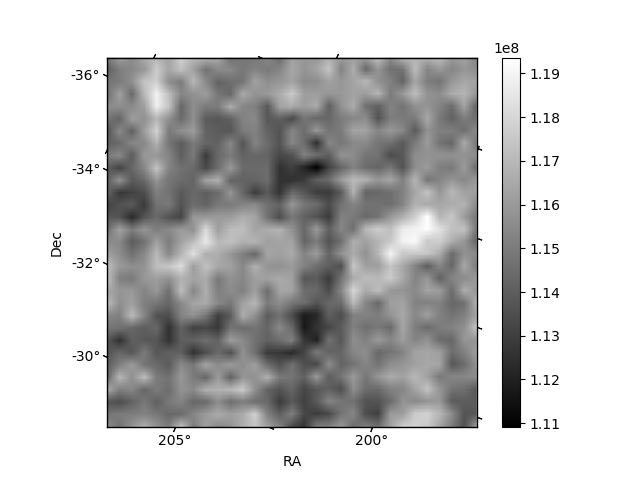
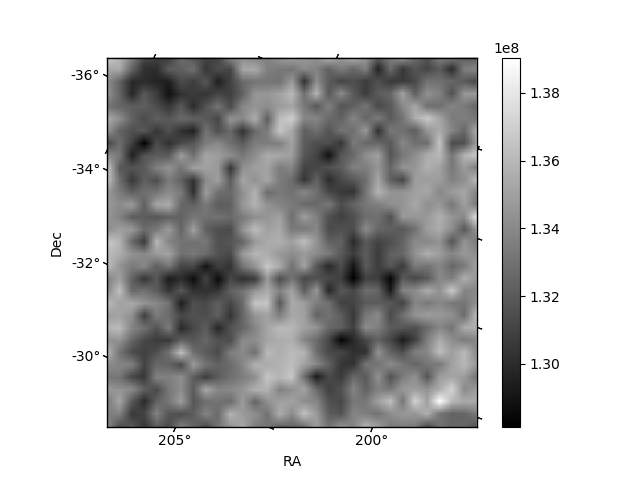
Histogram calculated using DETX and DETY for each event in the final _common_clean file
| Quadrant A | 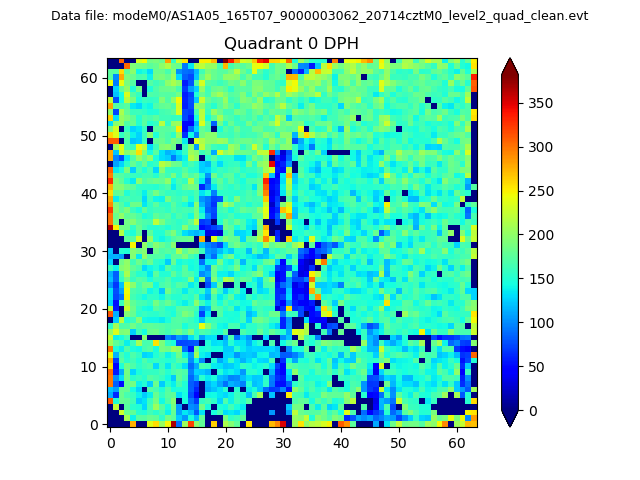 |
 |
Quadrant B |
|---|---|---|---|
| Quadrant D | 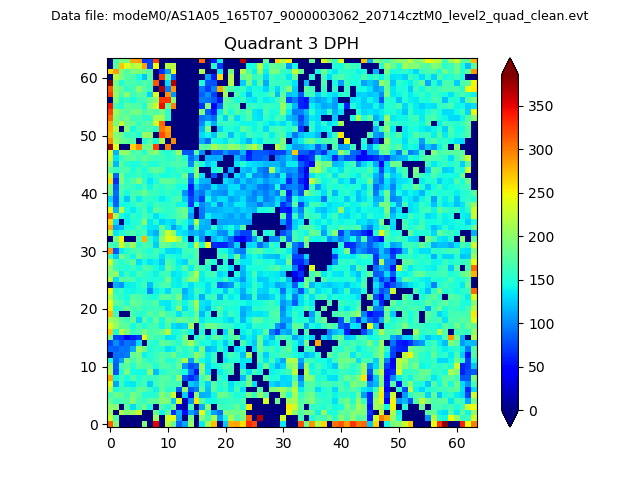 |
 |
Quadrant C |
| Plot type | Count rate plots | Images |
|---|---|---|
| Comparison with Poisson distribution Blue bars denote a histogram of data divided into 1 sec bins. Red curve is a Poisson curve with rate = median count rate of data. |
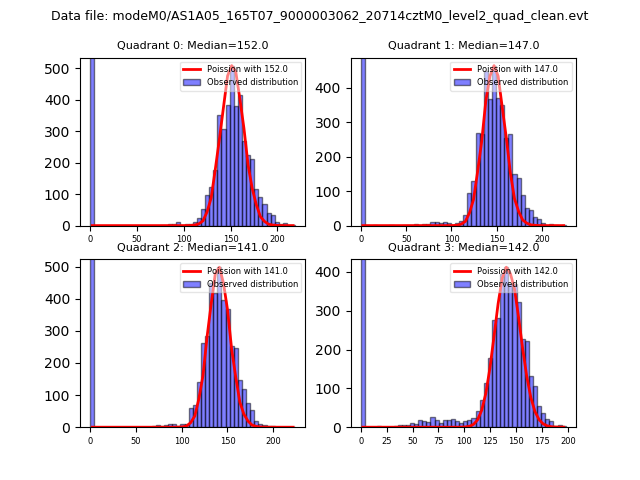 |
 |
| Quadrant-wise count rates Data is divided into 100 sec bins |
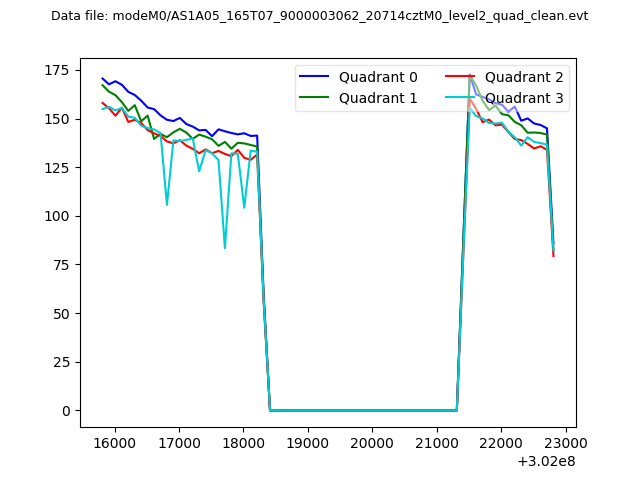 |
|
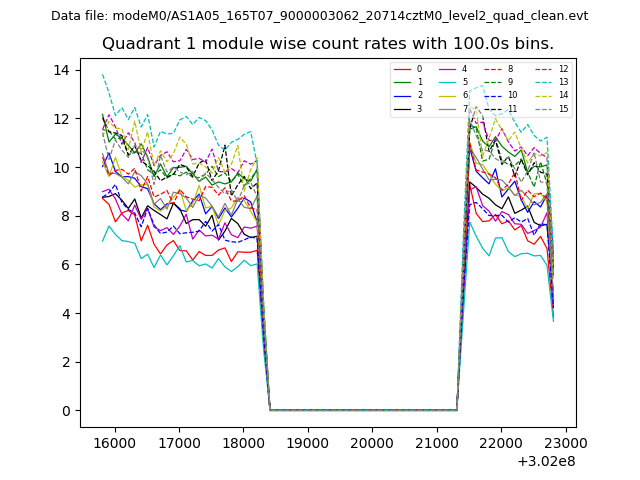
| Module-wise count rates for Quadrant A Data is divided into 100 sec bins |
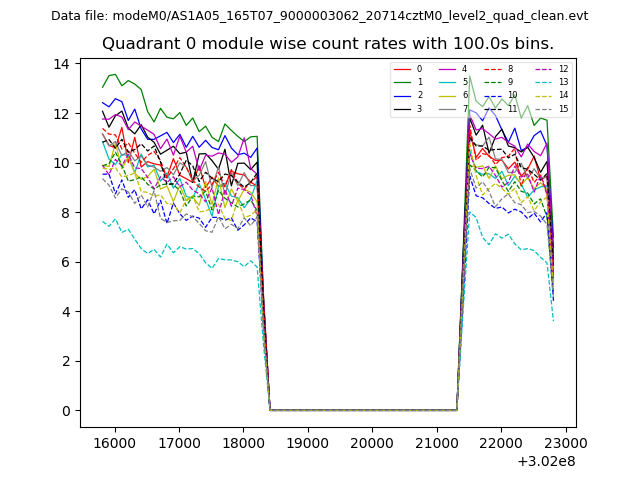 |
 |
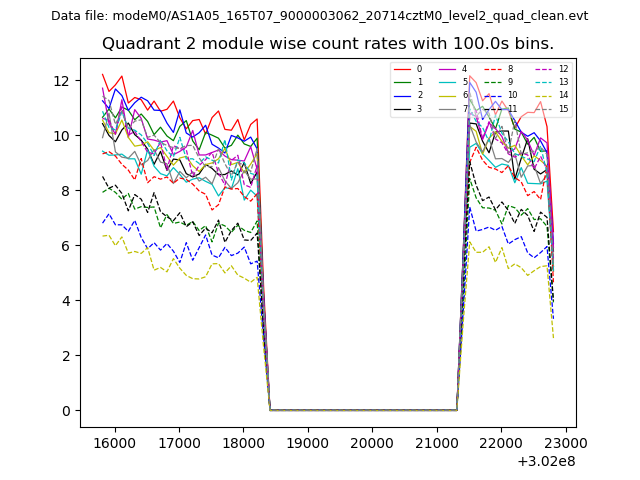
| Module-wise count rates for Quadrant B Data is divided into 100 sec bins |
 |
 |
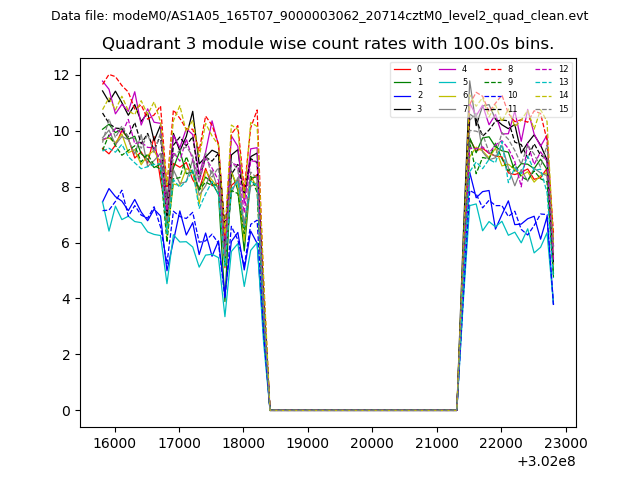
| Module-wise count rates for Quadrant C Data is divided into 100 sec bins |
 |
 |
| Module-wise count rates for Quadrant D Data is divided into 100 sec bins |
 |
 |
| Parameter | Plot |
|---|---|
| CZT HV Monitor | 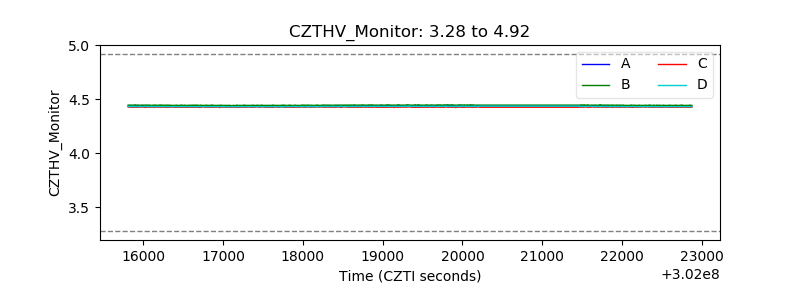 |
| D_VDD |  |
| Temperature 1 | 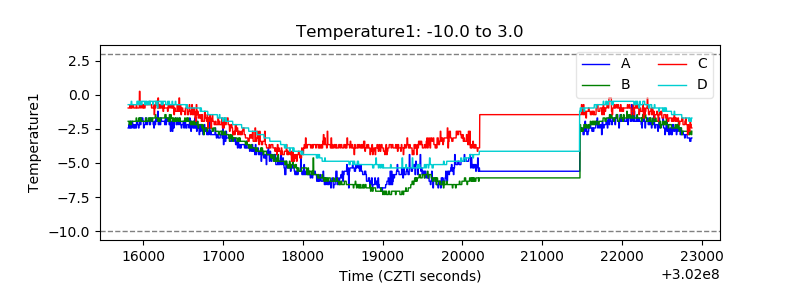 |
| Veto HV Monitor | 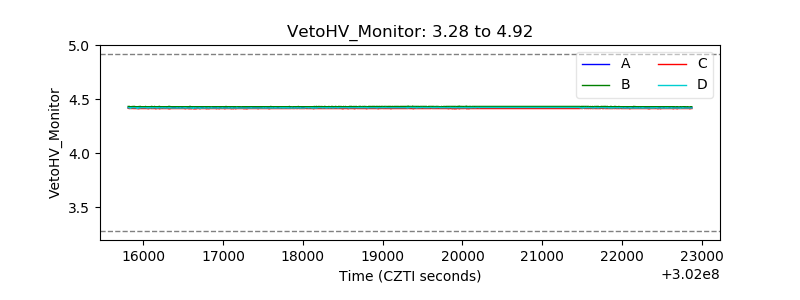 |
| Veto LLD | 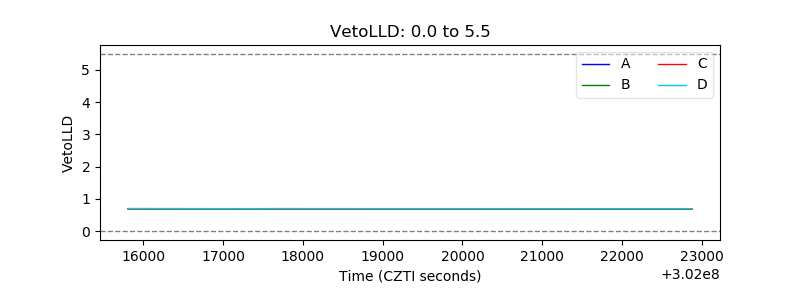 |
| Alpha Counter | 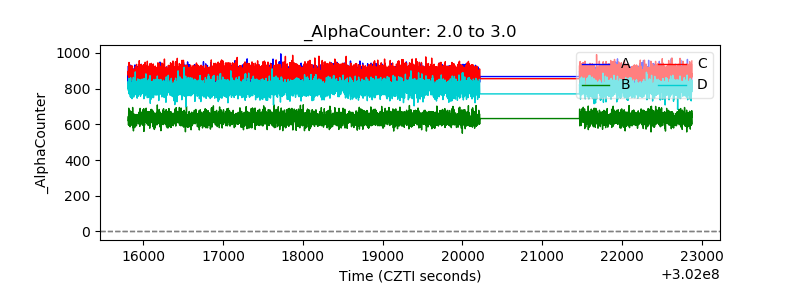 |
| _CPM_Rate | 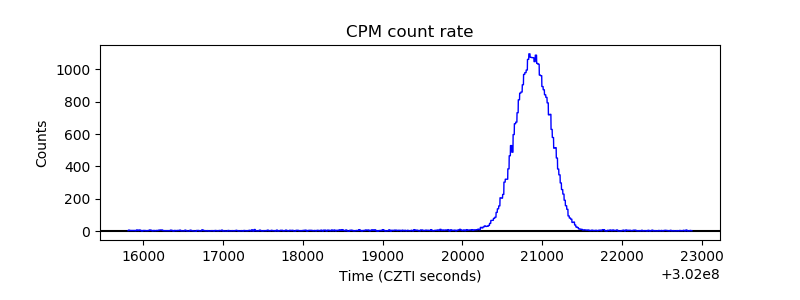 |
| CZT Counter | 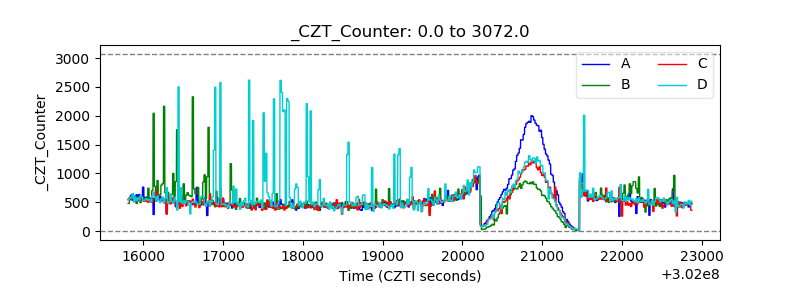 |
| +2.5 Volts monitor |  |
| +5 Volts monitor |  |
| _ROLL_ROT | 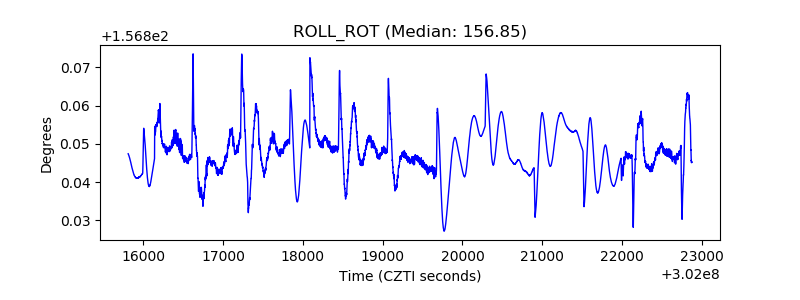 |
| _Roll_DEC | 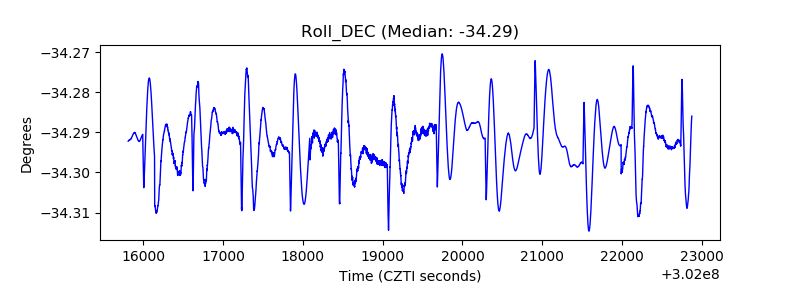 |
| _Roll_RA | 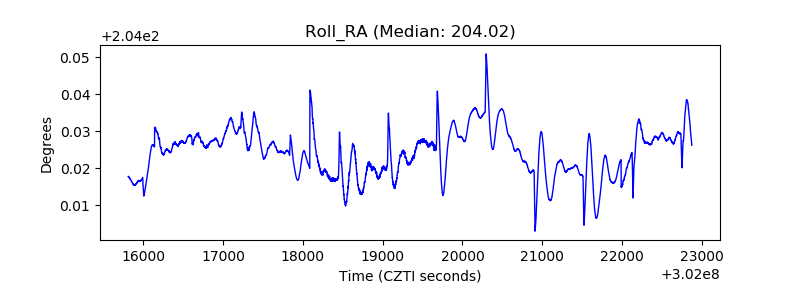 |
| Veto Counter | 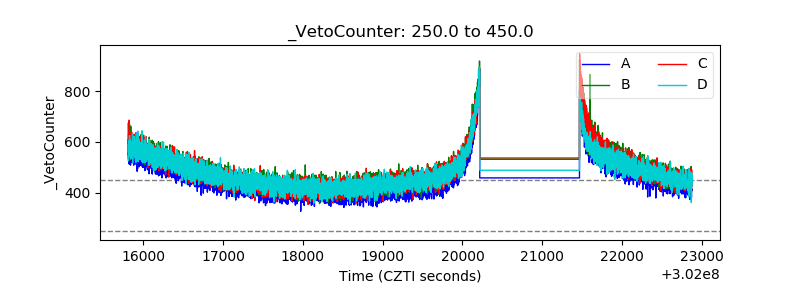 |