| Param | Original file | Final file |
|---|---|---|
| Filename | modeM0/AS1A05_165T07_9000003062_20715cztM0_level2.evt | modeM0/AS1A05_165T07_9000003062_20715cztM0_level2_quad_clean.evt |
| Size (bytes) | 456,249,600 | 95,051,520 |
| Size | 435.1 MB | 90.6 MB |
| Events in quadrant A | 3,169,861 | 632,358 |
| Events in quadrant B | 3,330,385 | 620,900 |
| Events in quadrant C | 3,163,066 | 591,273 |
| Events in quadrant D | 3,716,416 | 584,510 |
| Mode SS | |||
|---|---|---|---|
| Quadrant | BADHDUFLAG | Total packets | Discarded packets |
| A | 0 | 130 | 0 |
| B | 0 | 130 | 0 |
| C | 0 | 130 | 0 |
| D | 0 | 130 | 0 |
| Mode M0 | |||
|---|---|---|---|
| Quadrant | BADHDUFLAG | Total packets | Discarded packets |
| A | 0 | 13496 | 1 |
| B | 0 | 14023 | 1 |
| C | 0 | 13488 | 1 |
| D | 0 | 15267 | 1 |
| Mode M9 | |||
|---|---|---|---|
| Quadrant | BADHDUFLAG | Total packets | Discarded packets |
| A | 0 | 11 | 0 |
| B | 0 | 11 | 0 |
| C | 0 | 11 | 0 |
| D | 0 | 11 | 0 |
| Quadrant | Total seconds | Saturated seconds | Saturation percentage |
|---|---|---|---|
| A | 6446 | 51 | 0.791188% |
| B | 6446 | 59 | 0.915296% |
| C | 6446 | 68 | 1.054918% |
| D | 6447 | 126 | 1.954397% |
Noise dominated data is calculated using 1-second bins in cleaned event files. If a bin has >2000 counts, and if more than 50% of those come from <1% of pixels, then it is considered to be noise-dominated and hence unusable.
| Quadrant | # 1 sec bins | Bins with >0 counts | Bins with >2000 counts | High rate bins dominated by noise | Noise dominated (total time) | Noise dominated (detector-on time) | Marked lightcurve |
|---|---|---|---|---|---|---|---|
| A | 7506 | 6447 | 1 | 1 | 0.01% | 0.02% | 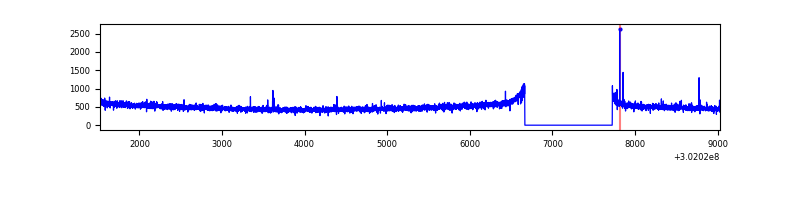 |
| B | 7506 | 6447 | 2 | 2 | 0.03% | 0.03% |  |
| C | 7506 | 6447 | 0 | 0 | 0.00% | 0.00% | 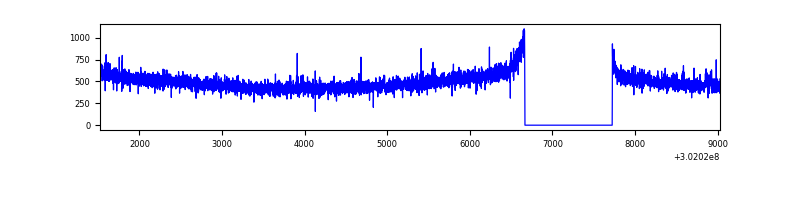 |
| D | 7507 | 6448 | 45 | 45 | 0.60% | 0.70% | 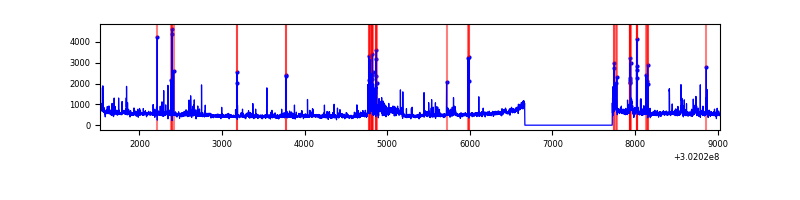 |
Top three noisy pixels from each quadrant. If the there are fewer than three noisy pixels in the level2.evt file, extra rows are filled as -1
| Pixel properties | Quadrant properties | ||||||
|---|---|---|---|---|---|---|---|
| Quadrant | DetID | PixID | Counts | Sigma | Mean | Median | Sigma |
| A | 5 | 16 | 13238 | 75.92 | 820 | 803 | 163.8 |
| A | 0 | 226 | 7314 | 39.75 | 820 | 803 | 163.8 |
| A | 3 | 137 | 6267 | 33.36 | 820 | 803 | 163.8 |
| B | 7 | 220 | 52477 | 337.77 | 805 | 786 | 153.0 |
| B | 0 | 190 | 44269 | 284.14 | 805 | 786 | 153.0 |
| B | 0 | 229 | 25520 | 161.62 | 805 | 786 | 153.0 |
| C | 14 | 238 | 121758 | 676.26 | 764 | 772 | 178.9 |
| C | 3 | 233 | 22361 | 120.67 | 764 | 772 | 178.9 |
| C | 7 | 247 | 12967 | 68.16 | 764 | 772 | 178.9 |
| D | 5 | 222 | 200618 | 1056.62 | 777 | 753 | 189.2 |
| D | 1 | 52 | 163656 | 861.21 | 777 | 753 | 189.2 |
| D | 7 | 238 | 122768 | 645.05 | 777 | 753 | 189.2 |
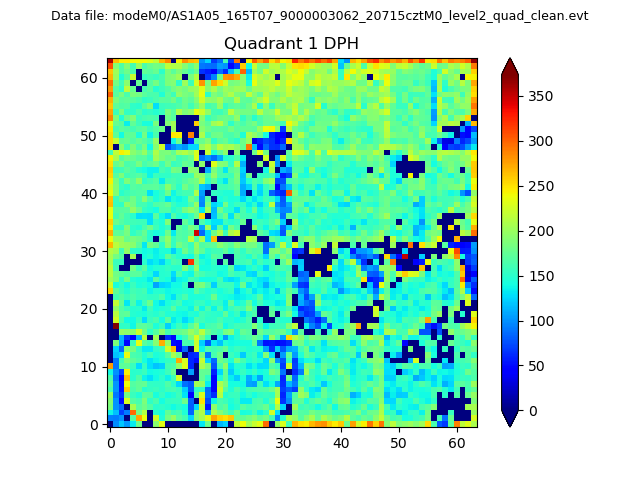
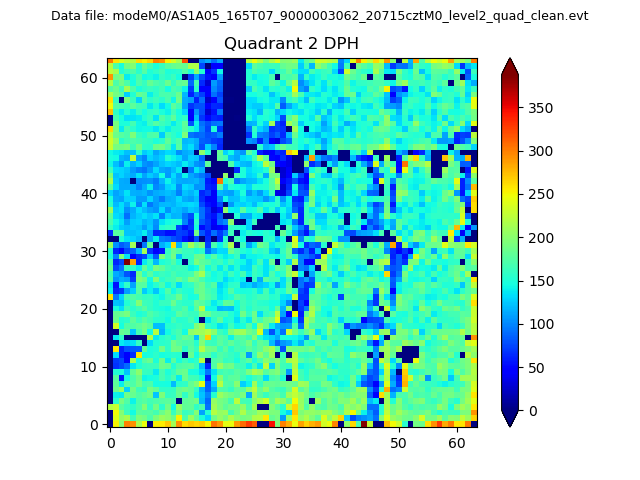
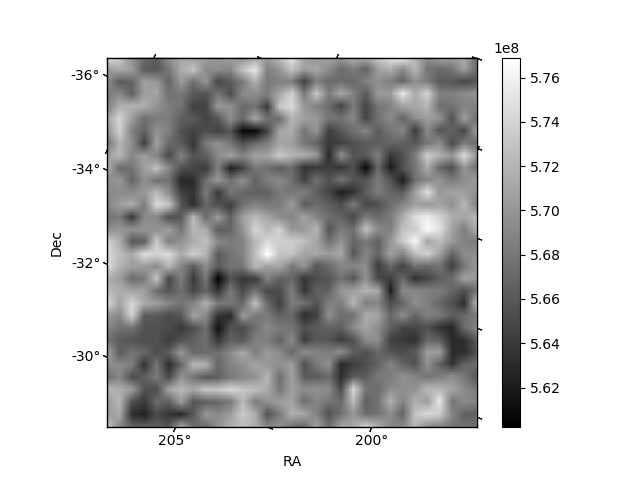
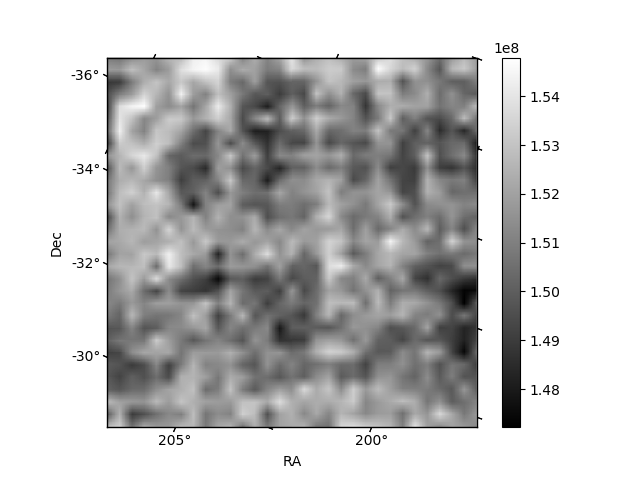
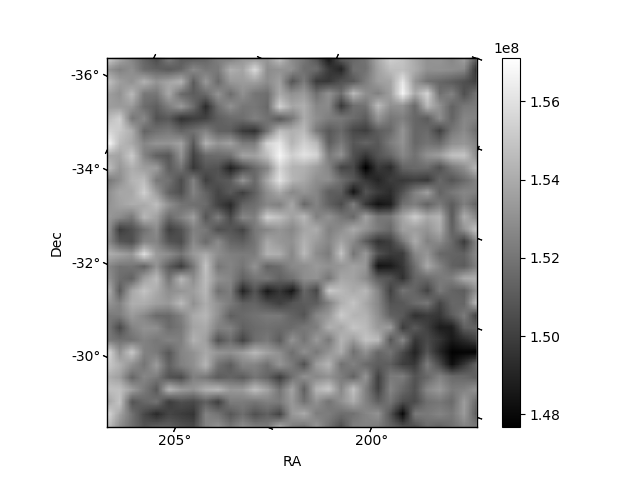
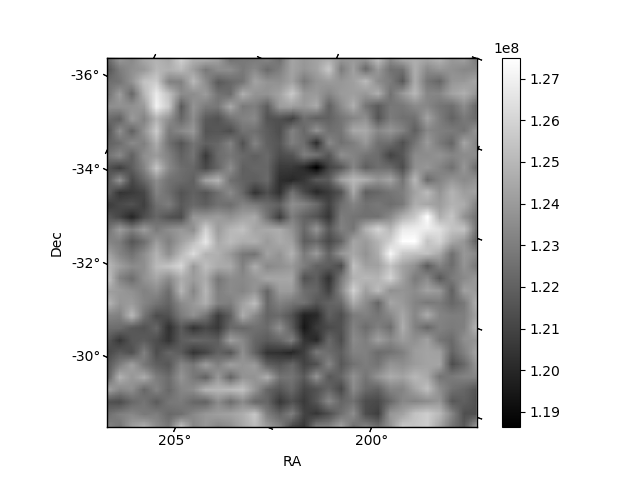
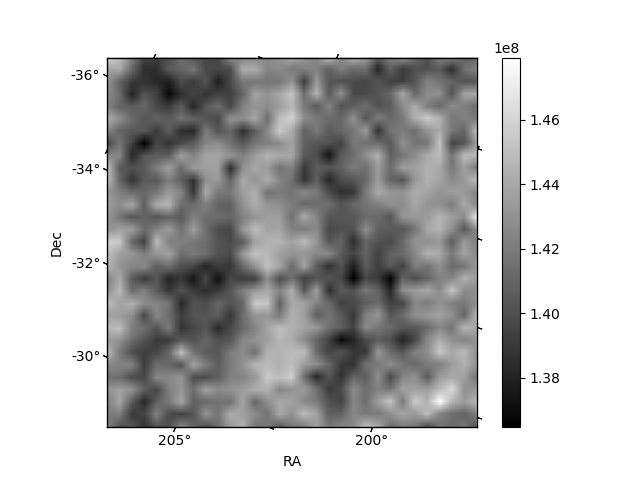
Histogram calculated using DETX and DETY for each event in the final _common_clean file
| Quadrant A | 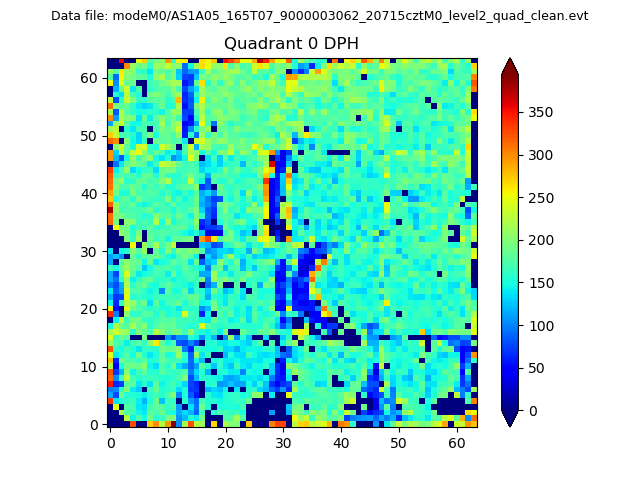 |
 |
Quadrant B |
|---|---|---|---|
| Quadrant D | 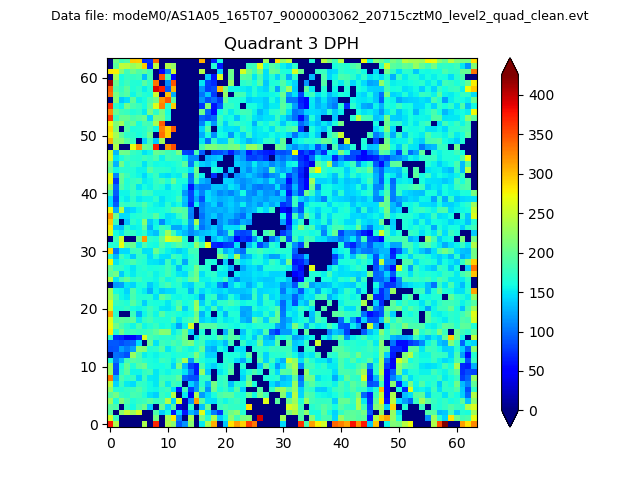 |
 |
Quadrant C |
| Plot type | Count rate plots | Images |
|---|---|---|
| Comparison with Poisson distribution Blue bars denote a histogram of data divided into 1 sec bins. Red curve is a Poisson curve with rate = median count rate of data. |
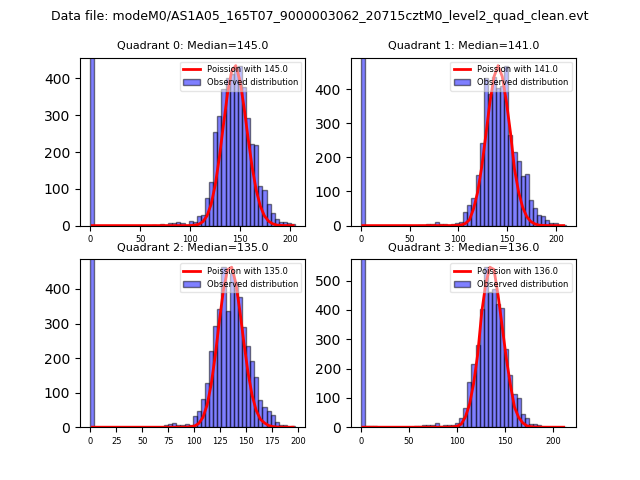 |
 |
| Quadrant-wise count rates Data is divided into 100 sec bins |
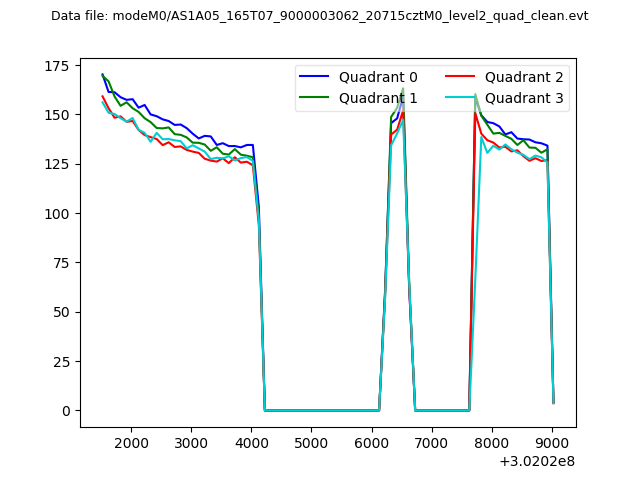 |
|
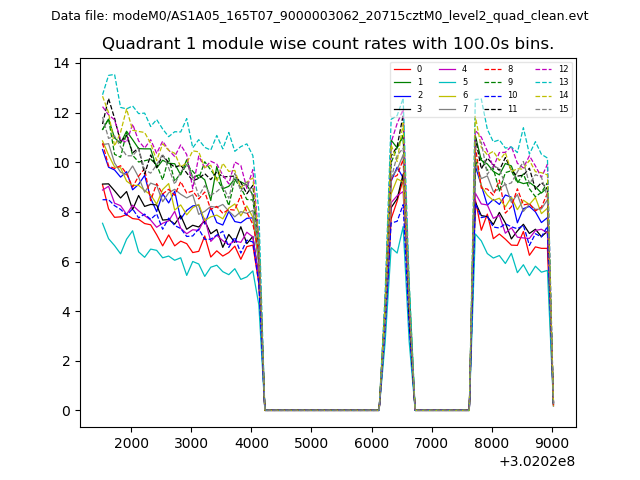
| Module-wise count rates for Quadrant A Data is divided into 100 sec bins |
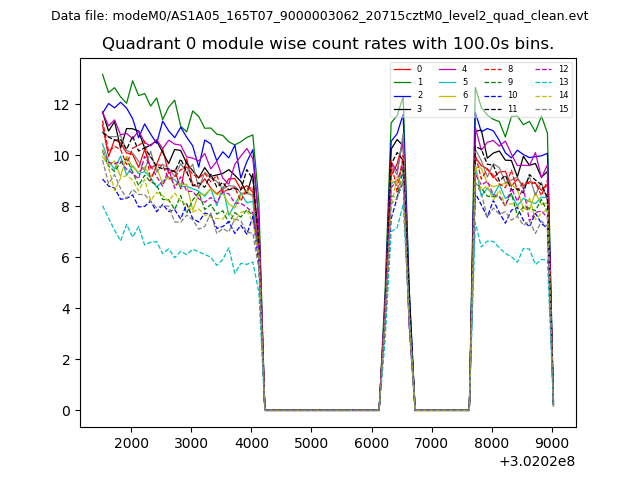 |
 |
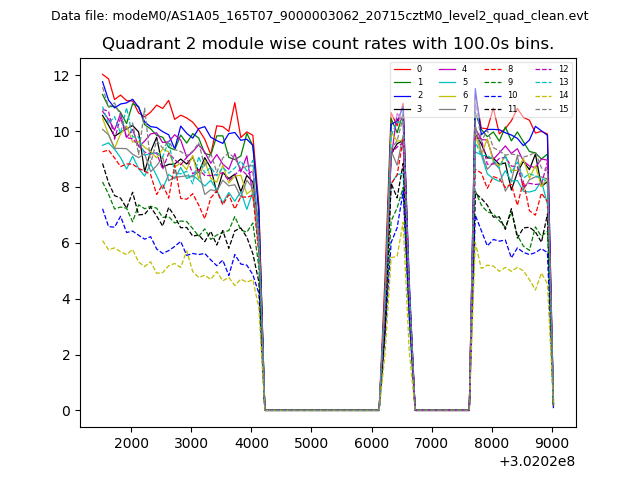
| Module-wise count rates for Quadrant B Data is divided into 100 sec bins |
 |
 |
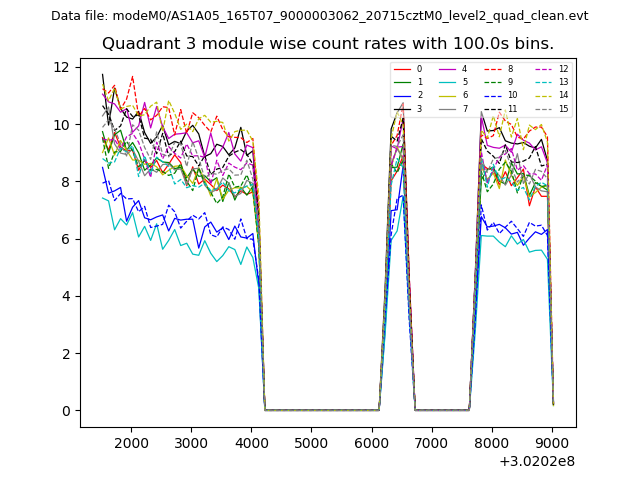
| Module-wise count rates for Quadrant C Data is divided into 100 sec bins |
 |
 |
| Module-wise count rates for Quadrant D Data is divided into 100 sec bins |
 |
 |
| Parameter | Plot |
|---|---|
| CZT HV Monitor | 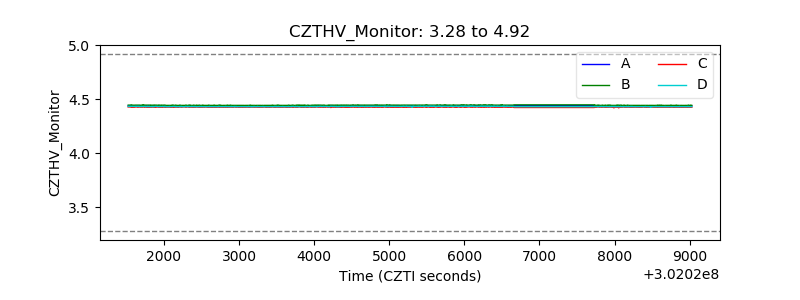 |
| D_VDD | 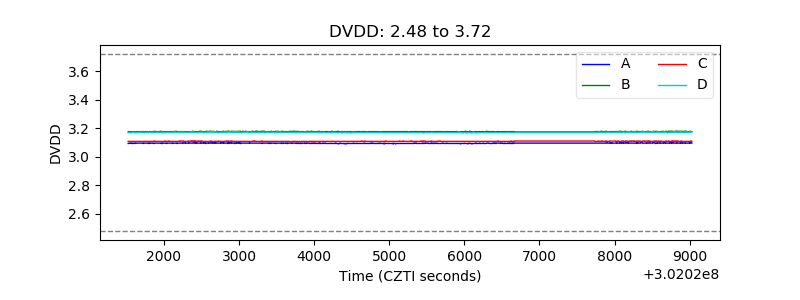 |
| Temperature 1 | 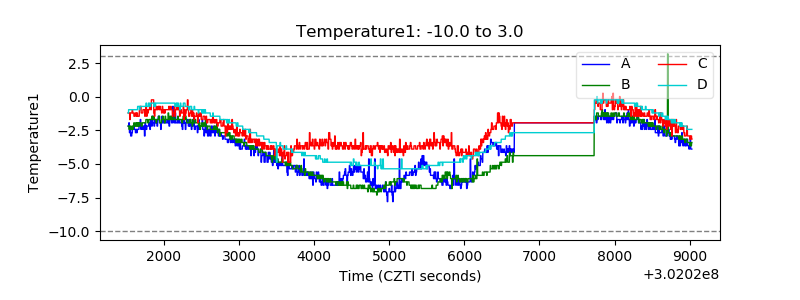 |
| Veto HV Monitor | 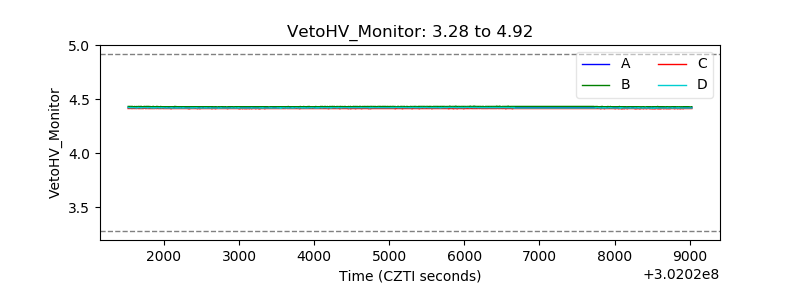 |
| Veto LLD | 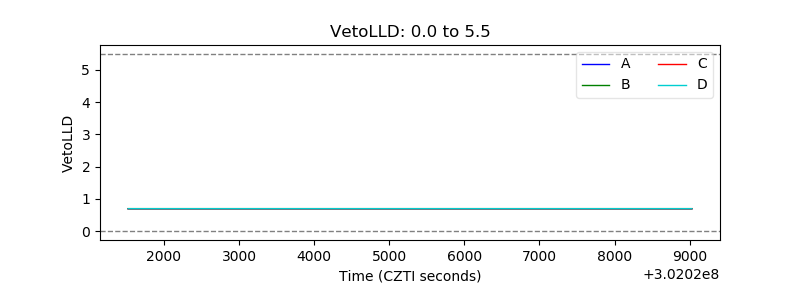 |
| Alpha Counter | 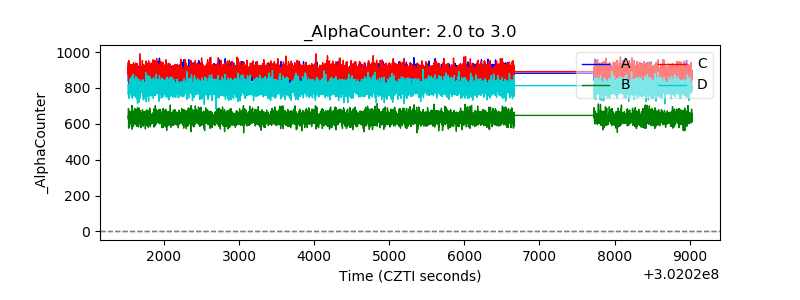 |
| _CPM_Rate | 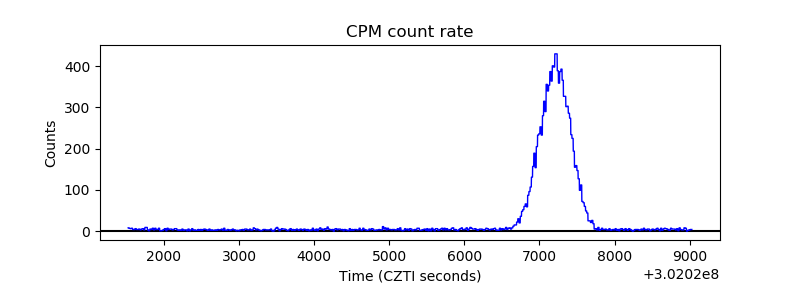 |
| CZT Counter | 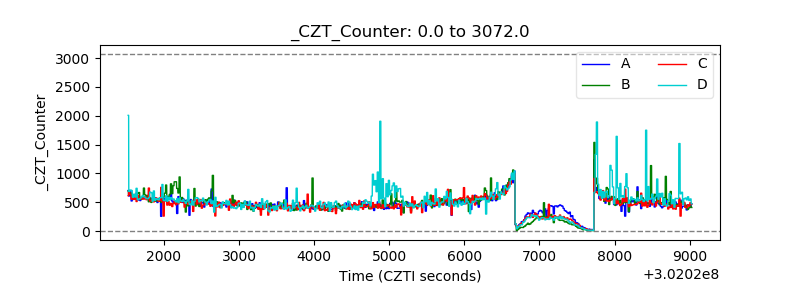 |
| +2.5 Volts monitor |  |
| +5 Volts monitor |  |
| _ROLL_ROT | 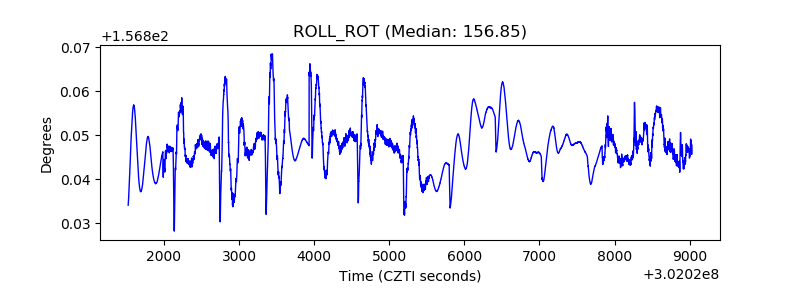 |
| _Roll_DEC | 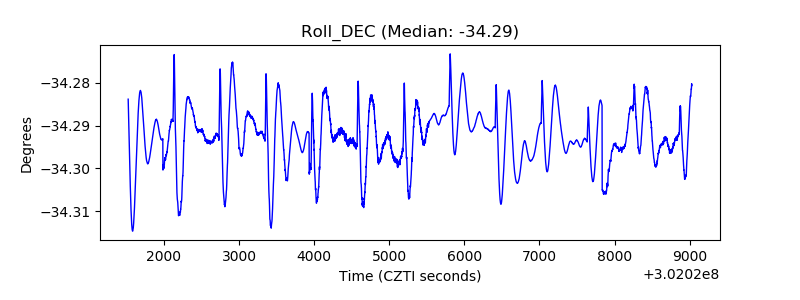 |
| _Roll_RA | 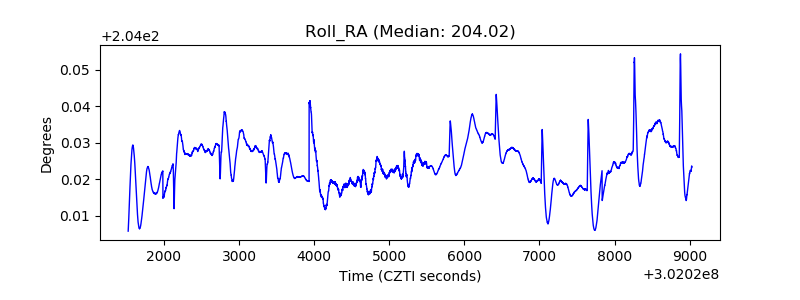 |
| Veto Counter | 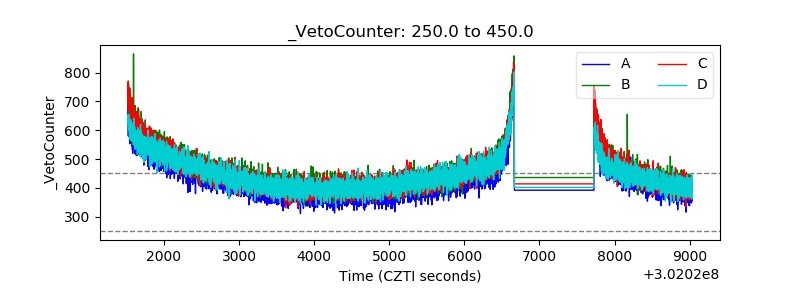 |