| Param | Original file | Final file |
|---|---|---|
| Filename | modeM0/AS1A05_165T07_9000003062_20716cztM0_level2.evt | modeM0/AS1A05_165T07_9000003062_20716cztM0_level2_quad_clean.evt |
| Size (bytes) | 450,434,880 | 93,421,440 |
| Size | 429.6 MB | 89.1 MB |
| Events in quadrant A | 3,089,480 | 612,144 |
| Events in quadrant B | 3,258,854 | 604,589 |
| Events in quadrant C | 3,093,541 | 578,572 |
| Events in quadrant D | 3,751,953 | 574,573 |
| Mode SS | |||
|---|---|---|---|
| Quadrant | BADHDUFLAG | Total packets | Discarded packets |
| A | 0 | 134 | 0 |
| B | 0 | 134 | 0 |
| C | 0 | 134 | 0 |
| D | 0 | 134 | 0 |
| Mode M0 | |||
|---|---|---|---|
| Quadrant | BADHDUFLAG | Total packets | Discarded packets |
| A | 0 | 13468 | 1 |
| B | 0 | 13900 | 4 |
| C | 0 | 13497 | 1 |
| D | 0 | 15416 | 1 |
| Mode M9 | |||
|---|---|---|---|
| Quadrant | BADHDUFLAG | Total packets | Discarded packets |
| A | 0 | 7 | 0 |
| B | 0 | 7 | 0 |
| C | 0 | 7 | 0 |
| D | 0 | 7 | 0 |
| Quadrant | Total seconds | Saturated seconds | Saturation percentage |
|---|---|---|---|
| A | 6586 | 28 | 0.425144% |
| B | 6586 | 31 | 0.470695% |
| C | 6586 | 37 | 0.561798% |
| D | 6586 | 31 | 0.470695% |
Noise dominated data is calculated using 1-second bins in cleaned event files. If a bin has >2000 counts, and if more than 50% of those come from <1% of pixels, then it is considered to be noise-dominated and hence unusable.
| Quadrant | # 1 sec bins | Bins with >0 counts | Bins with >2000 counts | High rate bins dominated by noise | Noise dominated (total time) | Noise dominated (detector-on time) | Marked lightcurve |
|---|---|---|---|---|---|---|---|
| A | 7306 | 6587 | 0 | 0 | 0.00% | 0.00% | 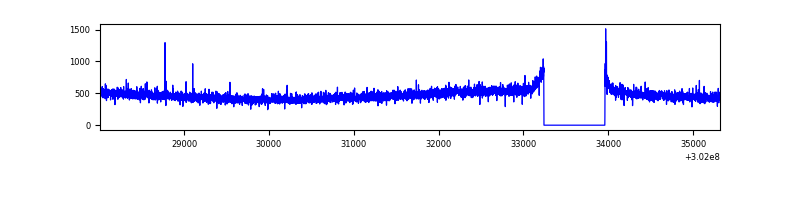 |
| B | 7306 | 6587 | 8 | 8 | 0.11% | 0.12% |  |
| C | 7306 | 6587 | 0 | 0 | 0.00% | 0.00% | 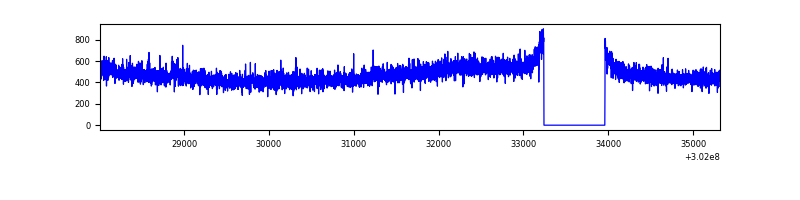 |
| D | 7306 | 6587 | 24 | 24 | 0.33% | 0.36% |  |
Top three noisy pixels from each quadrant. If the there are fewer than three noisy pixels in the level2.evt file, extra rows are filled as -1
| Pixel properties | Quadrant properties | ||||||
|---|---|---|---|---|---|---|---|
| Quadrant | DetID | PixID | Counts | Sigma | Mean | Median | Sigma |
| A | 5 | 16 | 7379 | 40.79 | 801 | 784 | 161.7 |
| A | 0 | 226 | 7010 | 38.51 | 801 | 784 | 161.7 |
| A | 3 | 137 | 6194 | 33.46 | 801 | 784 | 161.7 |
| B | 0 | 190 | 67817 | 443.11 | 791 | 771 | 151.3 |
| B | 0 | 229 | 24293 | 155.46 | 791 | 771 | 151.3 |
| B | 0 | 197 | 21999 | 140.3 | 791 | 771 | 151.3 |
| C | 14 | 238 | 117237 | 663.65 | 751 | 758 | 175.5 |
| C | 7 | 247 | 16513 | 89.77 | 751 | 758 | 175.5 |
| C | 3 | 233 | 13451 | 72.32 | 751 | 758 | 175.5 |
| D | 1 | 52 | 248111 | 1337.39 | 767 | 746 | 185.0 |
| D | 1 | 20 | 172209 | 927.02 | 767 | 746 | 185.0 |
| D | 7 | 38 | 99034 | 531.4 | 767 | 746 | 185.0 |
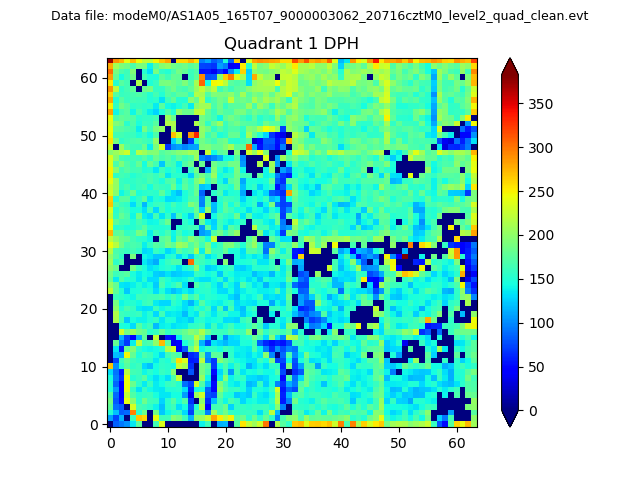
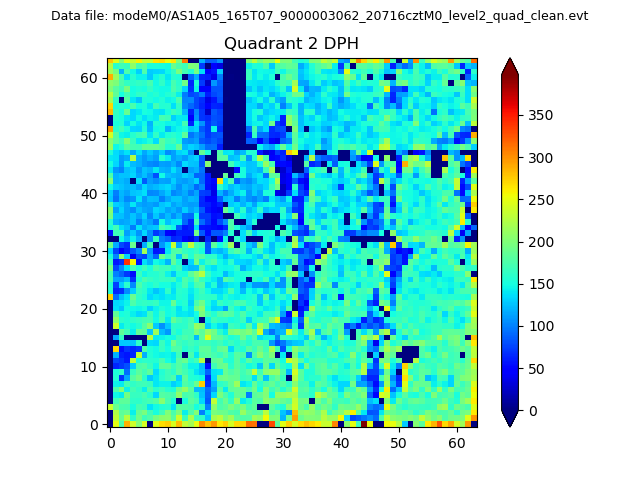
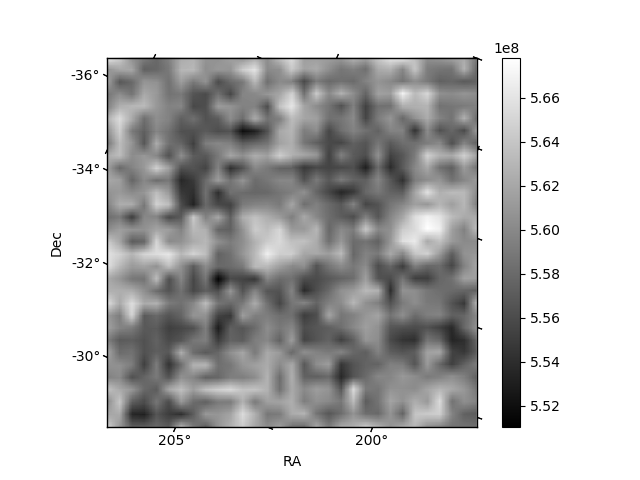
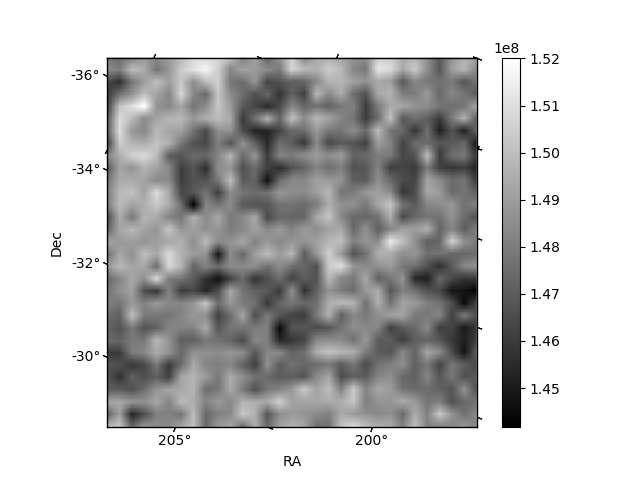
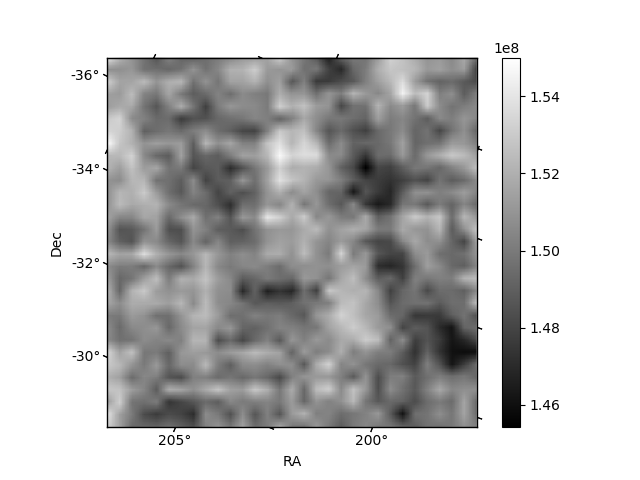
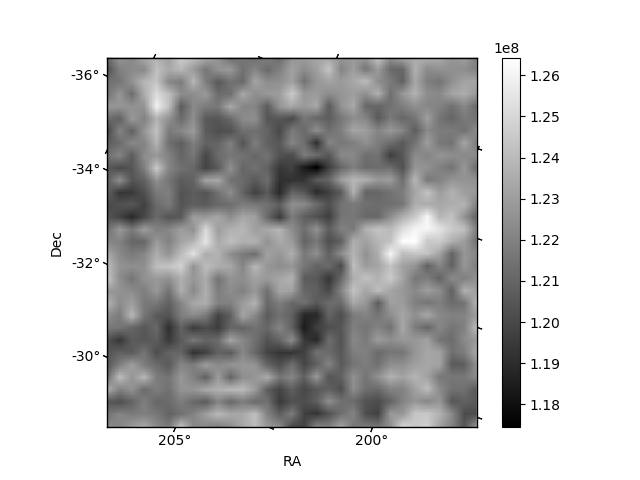
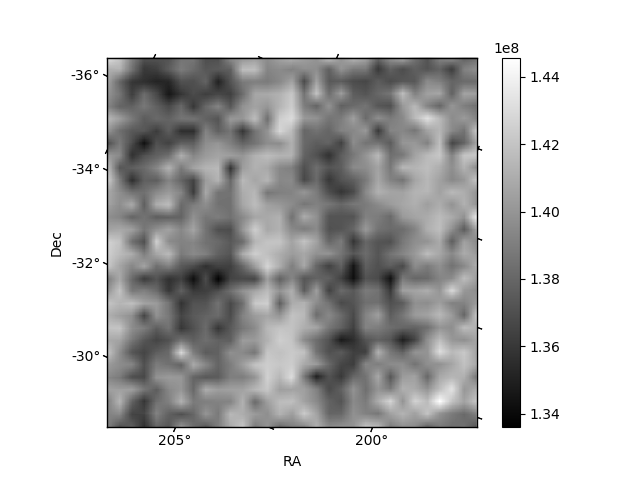
Histogram calculated using DETX and DETY for each event in the final _common_clean file
| Quadrant A | 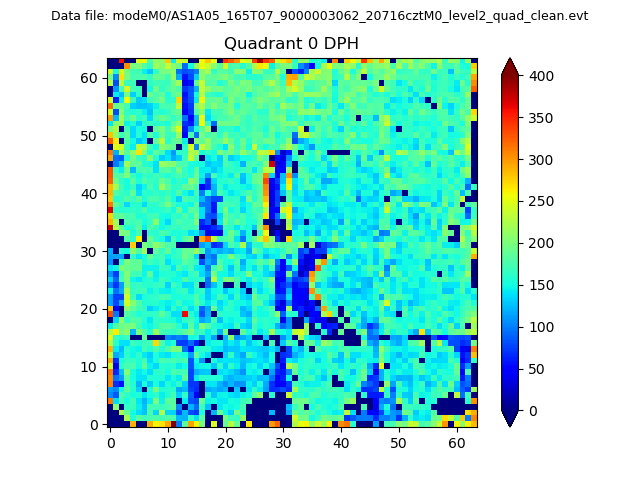 |
 |
Quadrant B |
|---|---|---|---|
| Quadrant D | 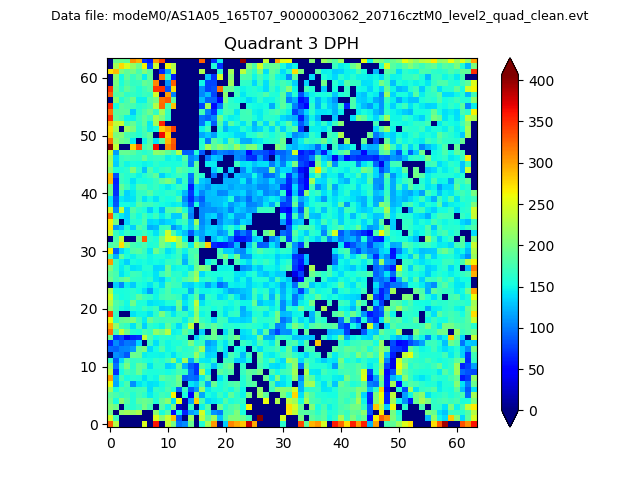 |
 |
Quadrant C |
| Plot type | Count rate plots | Images |
|---|---|---|
| Comparison with Poisson distribution Blue bars denote a histogram of data divided into 1 sec bins. Red curve is a Poisson curve with rate = median count rate of data. |
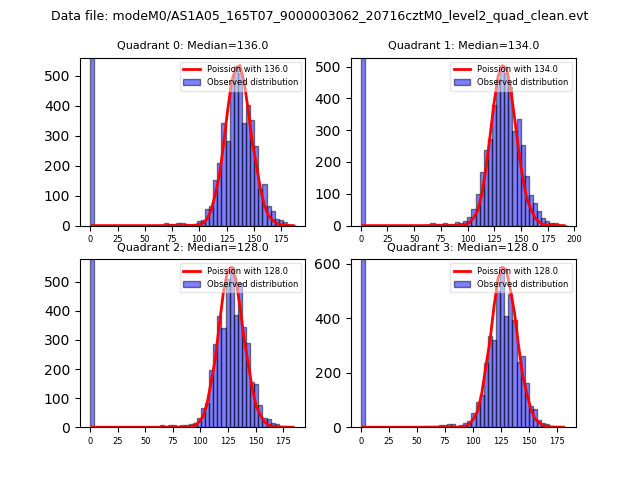 |
 |
| Quadrant-wise count rates Data is divided into 100 sec bins |
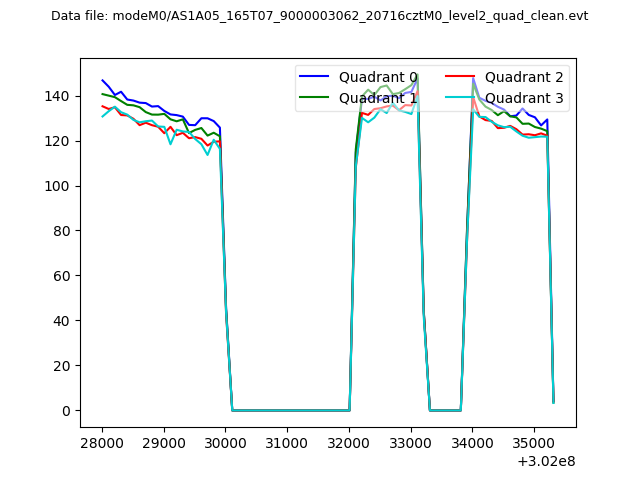 |
|
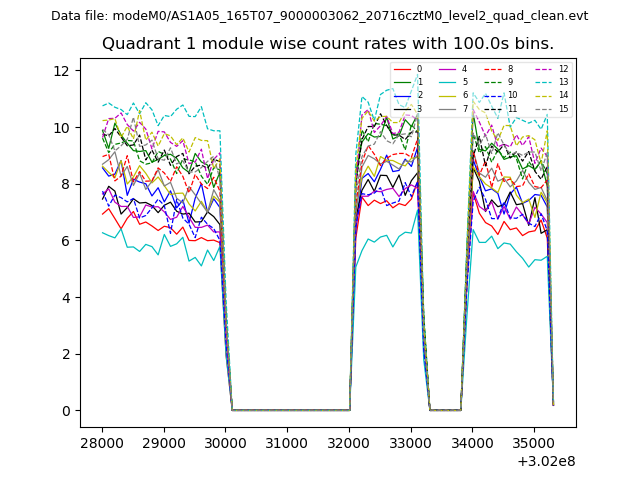
| Module-wise count rates for Quadrant A Data is divided into 100 sec bins |
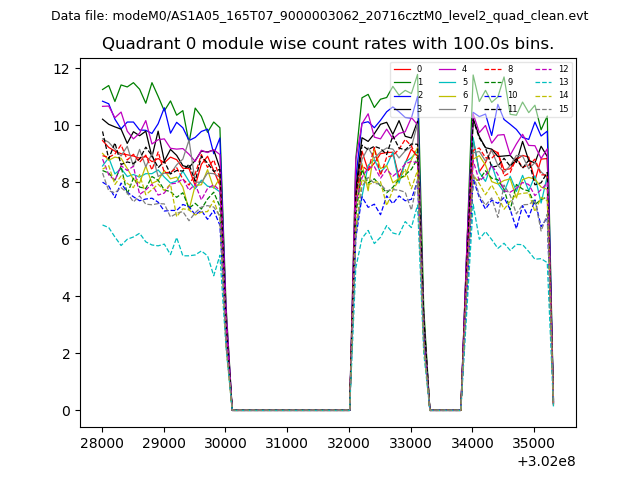 |
 |
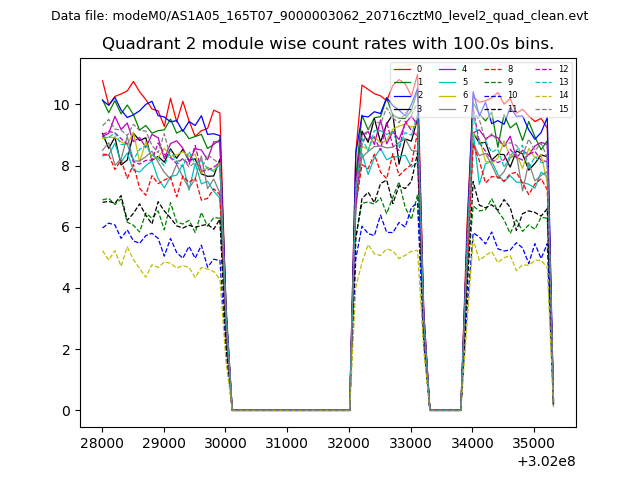
| Module-wise count rates for Quadrant B Data is divided into 100 sec bins |
 |
 |
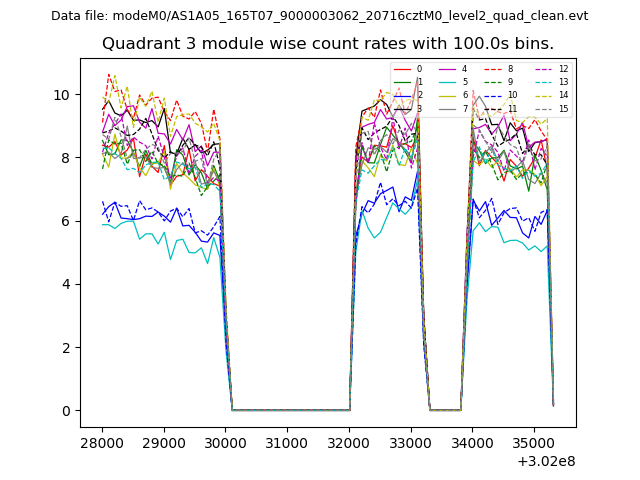
| Module-wise count rates for Quadrant C Data is divided into 100 sec bins |
 |
 |
| Module-wise count rates for Quadrant D Data is divided into 100 sec bins |
 |
 |
| Parameter | Plot |
|---|---|
| CZT HV Monitor | 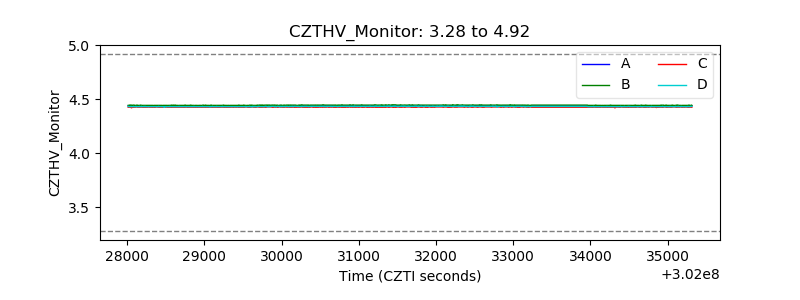 |
| D_VDD | 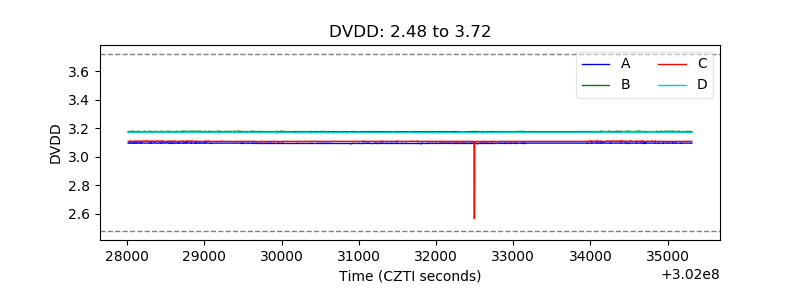 |
| Temperature 1 | 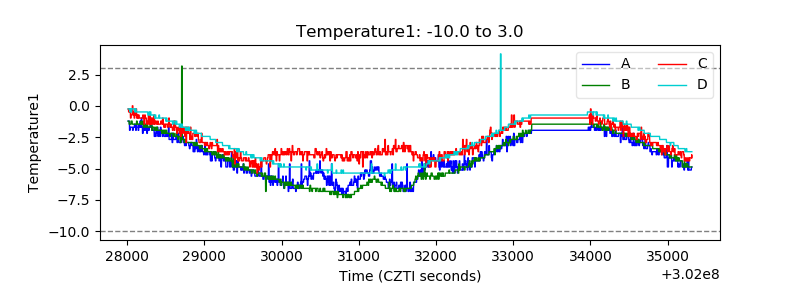 |
| Veto HV Monitor | 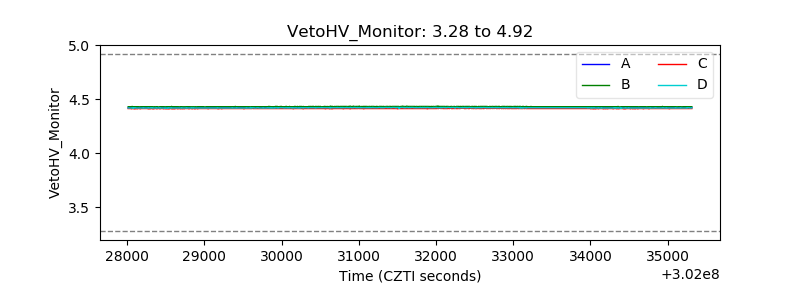 |
| Veto LLD | 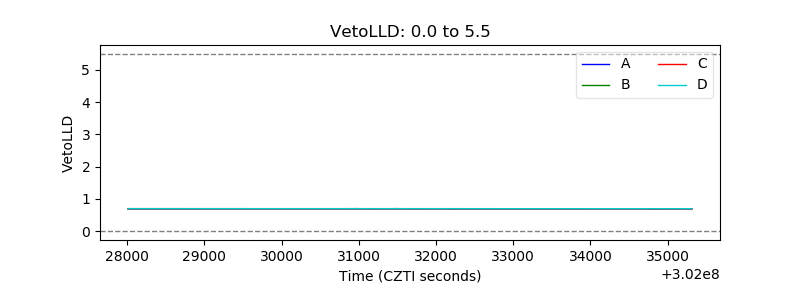 |
| Alpha Counter | 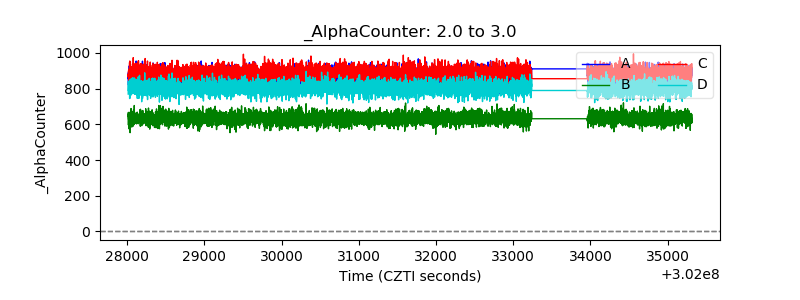 |
| _CPM_Rate | 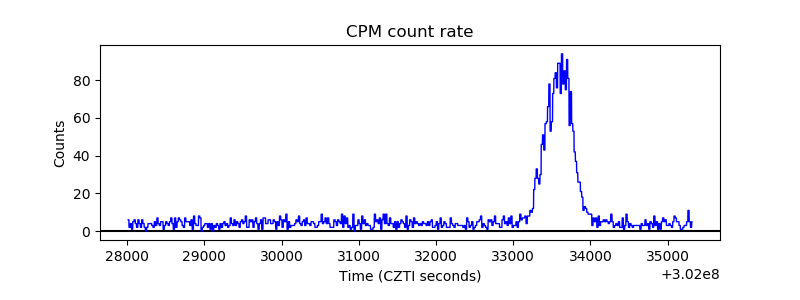 |
| CZT Counter | 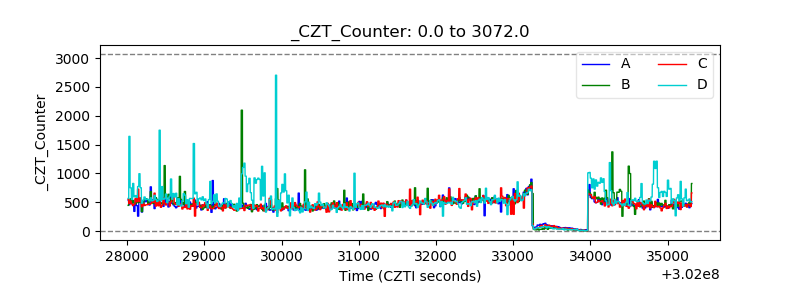 |
| +2.5 Volts monitor |  |
| +5 Volts monitor |  |
| _ROLL_ROT | 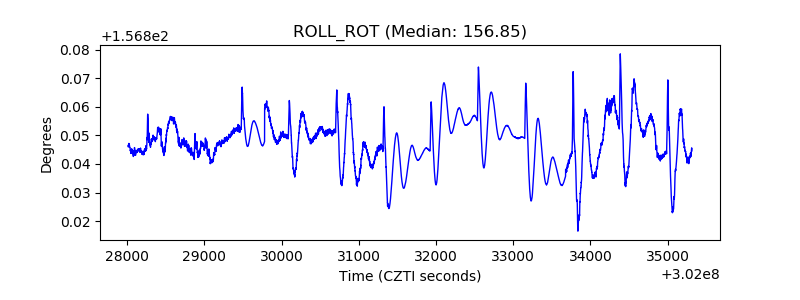 |
| _Roll_DEC |  |
| _Roll_RA | 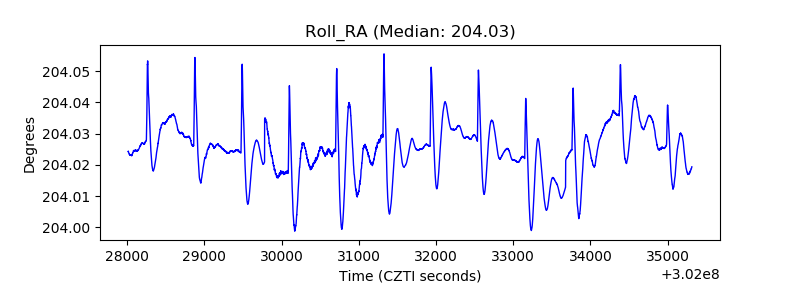 |
| Veto Counter | 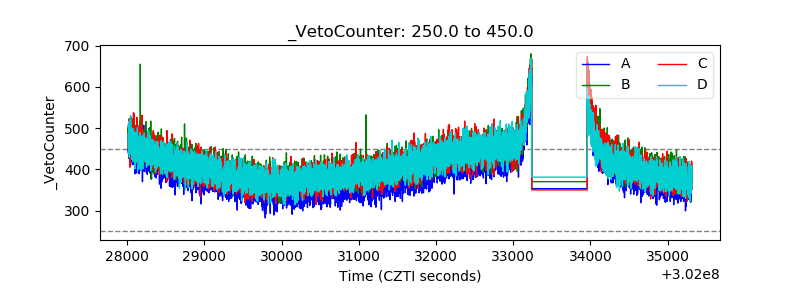 |