| Param | Original file | Final file |
|---|---|---|
| Filename | modeM0/AS1A05_165T07_9000003062_20717cztM0_level2.evt | modeM0/AS1A05_165T07_9000003062_20717cztM0_level2_quad_clean.evt |
| Size (bytes) | 552,427,200 | 104,581,440 |
| Size | 526.8 MB | 99.7 MB |
| Events in quadrant A | 3,430,124 | 691,704 |
| Events in quadrant B | 3,746,787 | 678,964 |
| Events in quadrant C | 3,409,782 | 656,646 |
| Events in quadrant D | 5,651,311 | 634,509 |
| Mode SS | |||
|---|---|---|---|
| Quadrant | BADHDUFLAG | Total packets | Discarded packets |
| A | 0 | 148 | 0 |
| B | 0 | 148 | 0 |
| C | 0 | 148 | 0 |
| D | 0 | 148 | 0 |
| Mode M0 | |||
|---|---|---|---|
| Quadrant | BADHDUFLAG | Total packets | Discarded packets |
| A | 0 | 14988 | 2 |
| B | 0 | 15910 | 3 |
| C | 0 | 14915 | 2 |
| D | 0 | 21657 | 2 |
| Mode M9 | |||
|---|---|---|---|
| Quadrant | BADHDUFLAG | Total packets | Discarded packets |
| A | 0 | 6 | 0 |
| B | 0 | 7 | 0 |
| C | 0 | 7 | 0 |
| D | 0 | 7 | 0 |
| Quadrant | Total seconds | Saturated seconds | Saturation percentage |
|---|---|---|---|
| A | 7256 | 38 | 0.523705% |
| B | 7255 | 130 | 1.791868% |
| C | 7255 | 58 | 0.799449% |
| D | 7255 | 320 | 4.410751% |
Noise dominated data is calculated using 1-second bins in cleaned event files. If a bin has >2000 counts, and if more than 50% of those come from <1% of pixels, then it is considered to be noise-dominated and hence unusable.
| Quadrant | # 1 sec bins | Bins with >0 counts | Bins with >2000 counts | High rate bins dominated by noise | Noise dominated (total time) | Noise dominated (detector-on time) | Marked lightcurve |
|---|---|---|---|---|---|---|---|
| A | 7591 | 7257 | 0 | 0 | 0.00% | 0.00% | 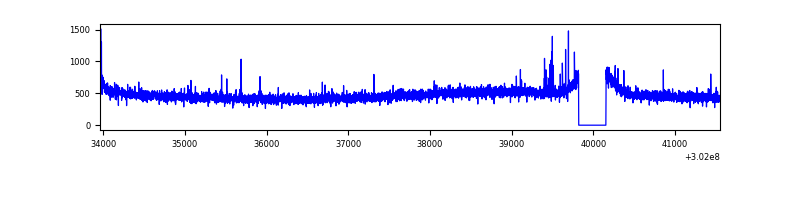 |
| B | 7590 | 7256 | 29 | 29 | 0.38% | 0.40% |  |
| C | 7590 | 7256 | 0 | 0 | 0.00% | 0.00% | 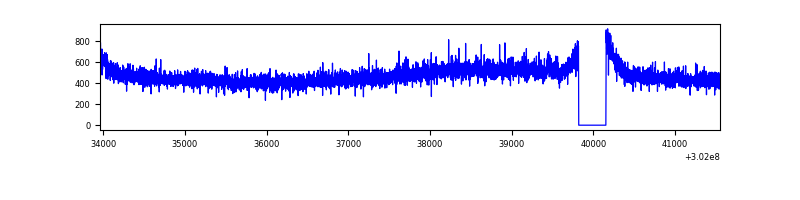 |
| D | 7590 | 7256 | 290 | 290 | 3.82% | 4.00% | 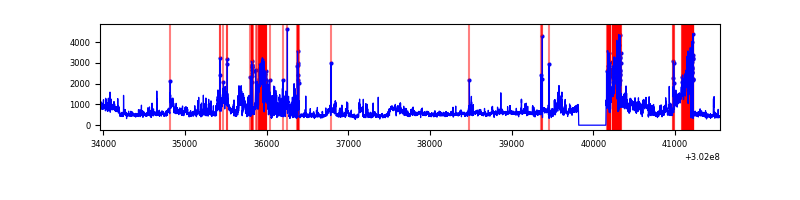 |
Top three noisy pixels from each quadrant. If the there are fewer than three noisy pixels in the level2.evt file, extra rows are filled as -1
| Pixel properties | Quadrant properties | ||||||
|---|---|---|---|---|---|---|---|
| Quadrant | DetID | PixID | Counts | Sigma | Mean | Median | Sigma |
| A | 5 | 16 | 30401 | 165.75 | 881 | 863 | 178.2 |
| A | 0 | 226 | 7576 | 37.67 | 881 | 863 | 178.2 |
| A | 3 | 137 | 7145 | 35.25 | 881 | 863 | 178.2 |
| B | 7 | 220 | 204694 | 1230.86 | 867 | 847 | 165.6 |
| B | 0 | 190 | 69232 | 412.92 | 867 | 847 | 165.6 |
| B | 3 | 64 | 21628 | 125.48 | 867 | 847 | 165.6 |
| C | 14 | 238 | 127952 | 656.81 | 827 | 830 | 193.5 |
| C | 7 | 247 | 40448 | 204.7 | 827 | 830 | 193.5 |
| C | 8 | 208 | 11409 | 54.66 | 827 | 830 | 193.5 |
| D | 1 | 52 | 1023448 | 5073.33 | 829 | 804 | 201.6 |
| D | 5 | 222 | 494199 | 2447.73 | 829 | 804 | 201.6 |
| D | 1 | 20 | 329987 | 1633.07 | 829 | 804 | 201.6 |
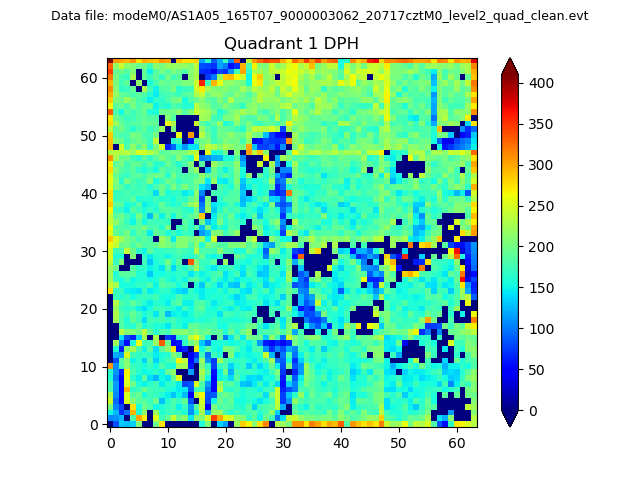
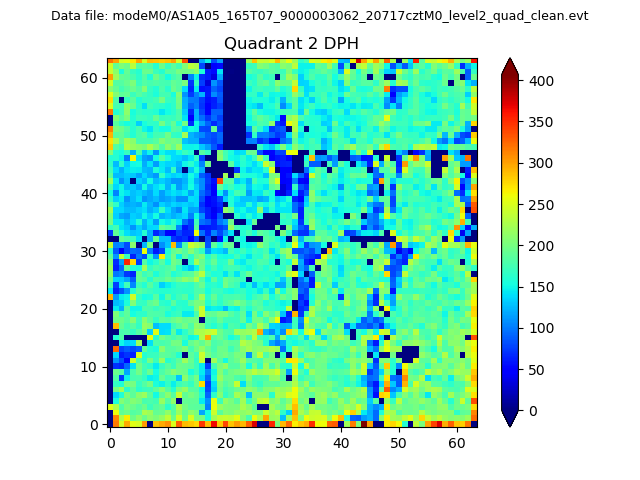
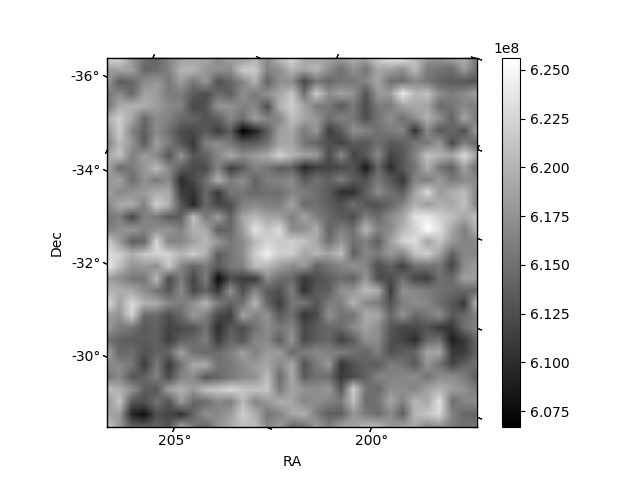
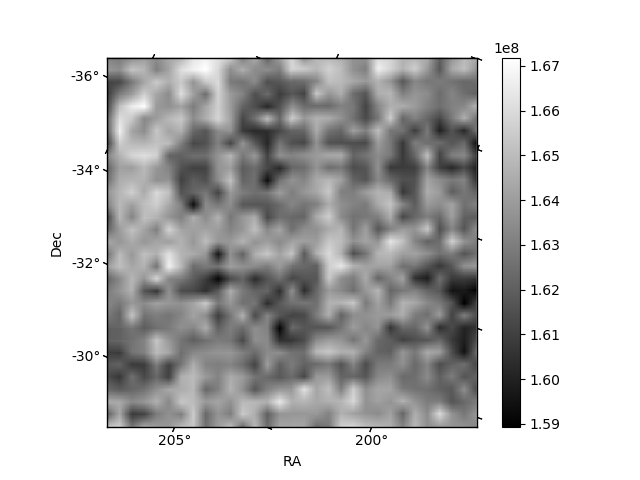
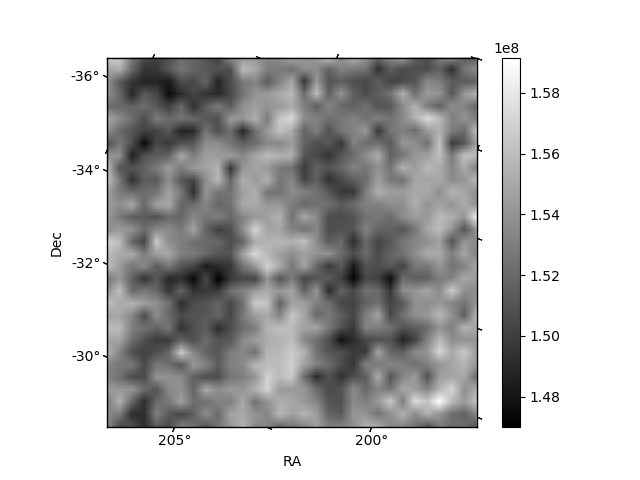
Histogram calculated using DETX and DETY for each event in the final _common_clean file
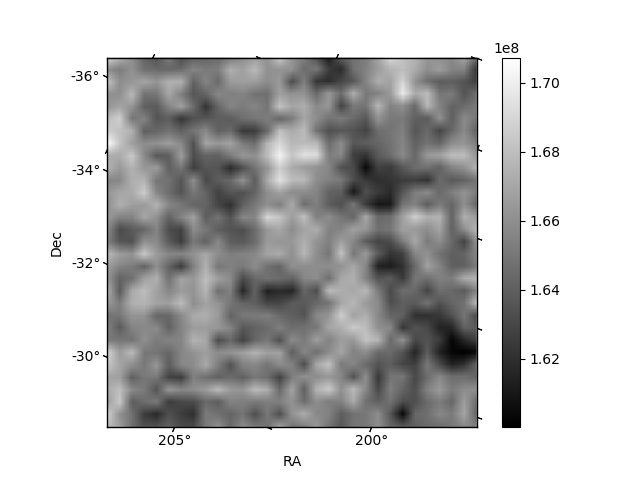
| Quadrant A | 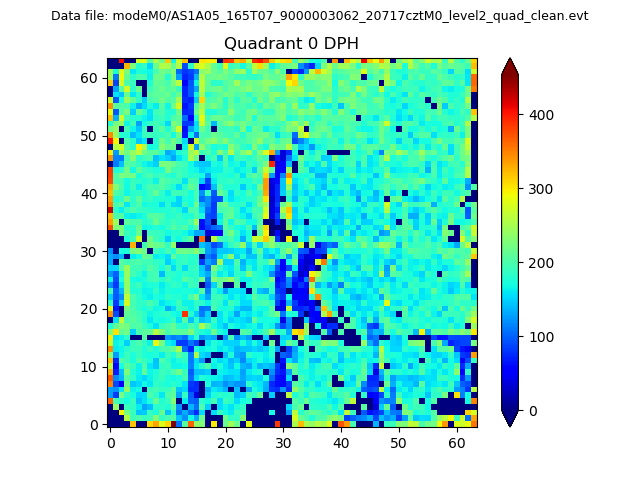 |
 |
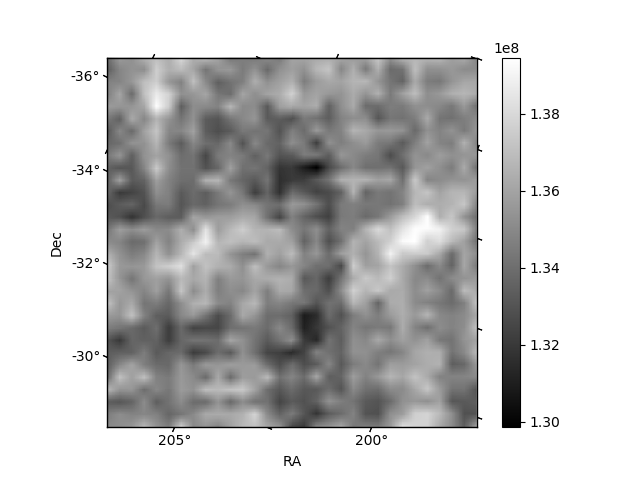
Quadrant B |
|---|---|---|---|
| Quadrant D | 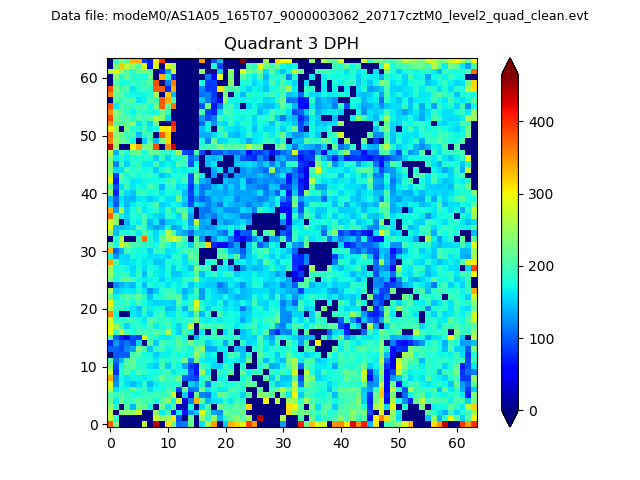 |
 |
Quadrant C |
| Plot type | Count rate plots | Images |
|---|---|---|
| Comparison with Poisson distribution Blue bars denote a histogram of data divided into 1 sec bins. Red curve is a Poisson curve with rate = median count rate of data. |
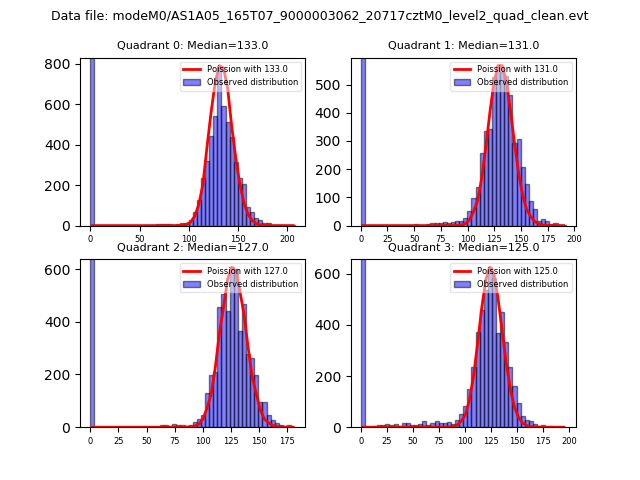 |
 |
| Quadrant-wise count rates Data is divided into 100 sec bins |
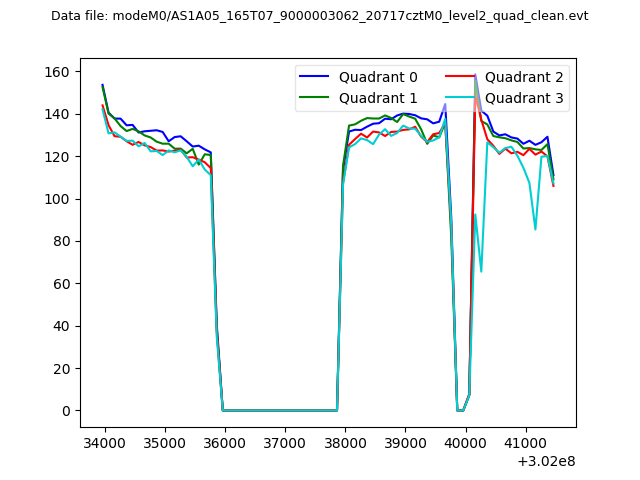 |
|
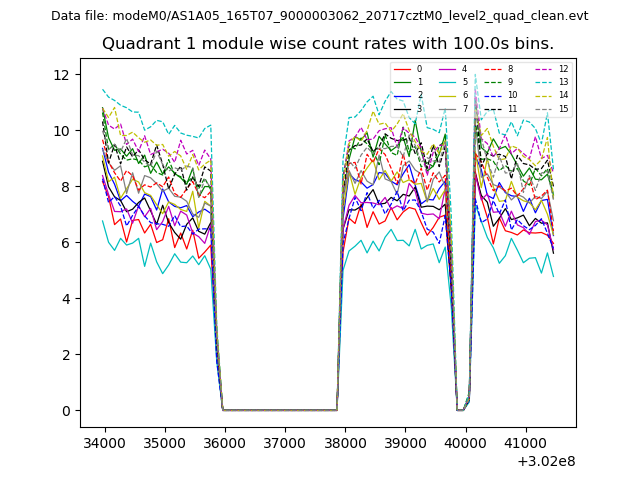
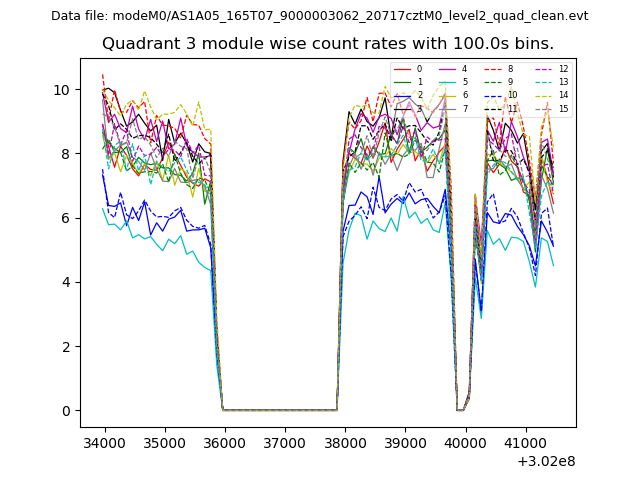
| Module-wise count rates for Quadrant A Data is divided into 100 sec bins |
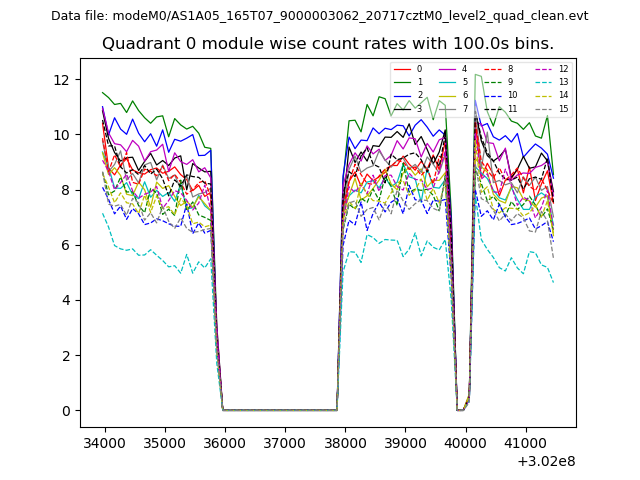 |
 |
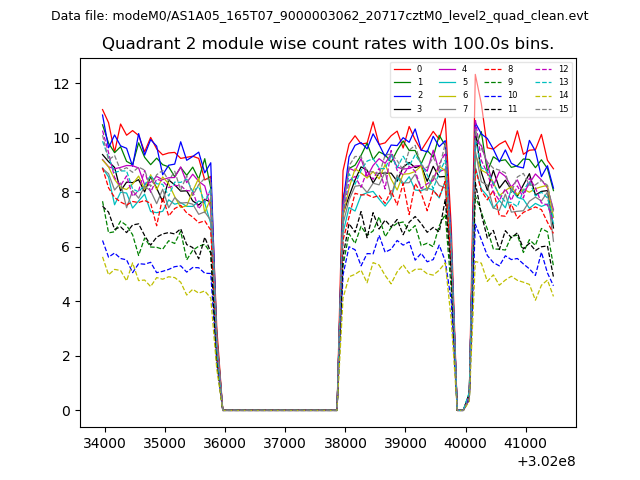
| Module-wise count rates for Quadrant B Data is divided into 100 sec bins |
 |
 |
| Module-wise count rates for Quadrant C Data is divided into 100 sec bins |
 |
 |
| Module-wise count rates for Quadrant D Data is divided into 100 sec bins |
 |
 |
| Parameter | Plot |
|---|---|
| CZT HV Monitor | 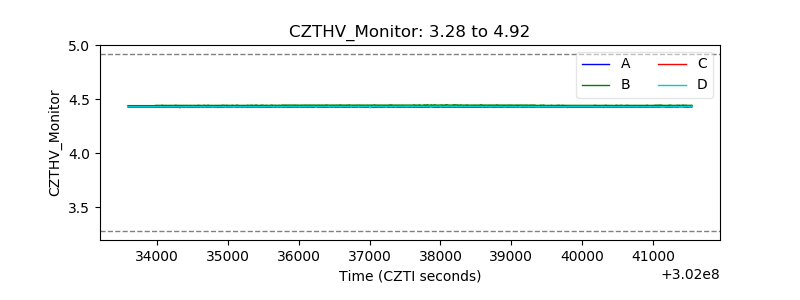 |
| D_VDD |  |
| Temperature 1 | 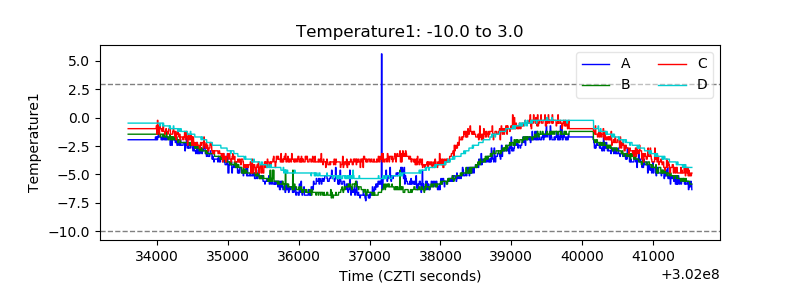 |
| Veto HV Monitor | 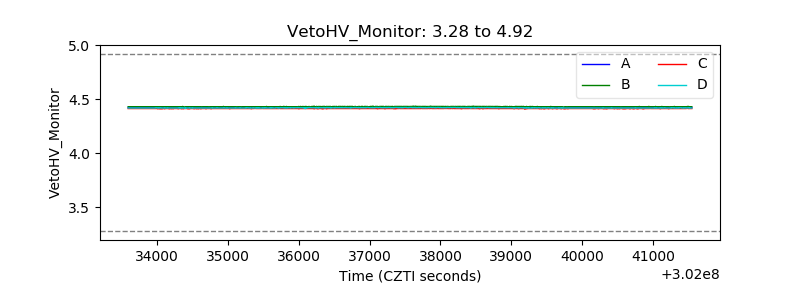 |
| Veto LLD | 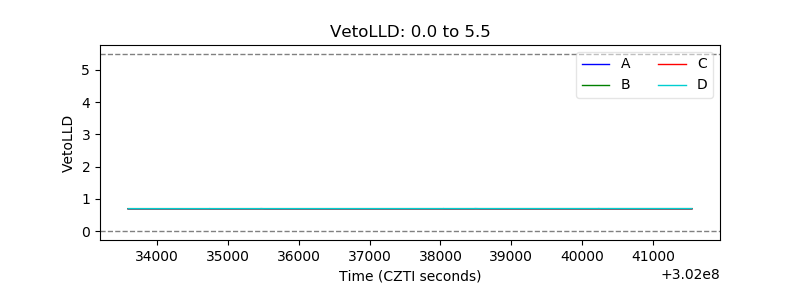 |
| Alpha Counter | 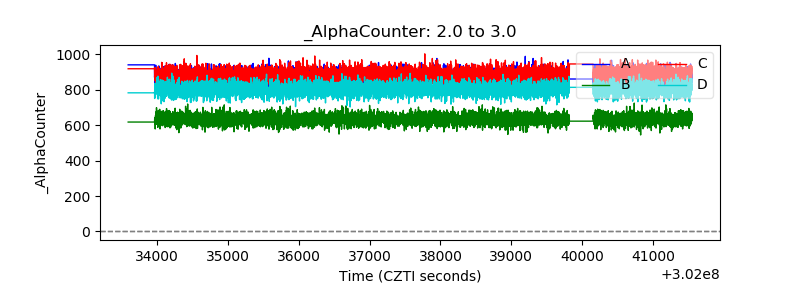 |
| _CPM_Rate | 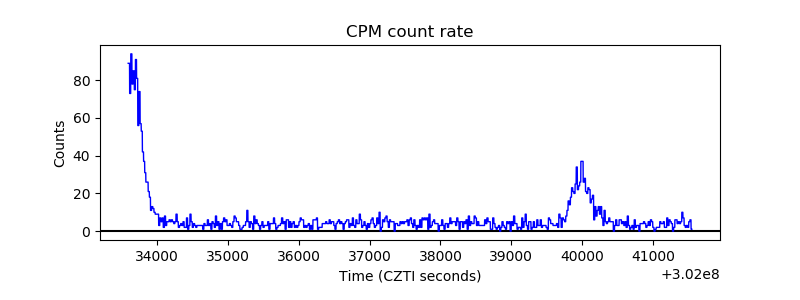 |
| CZT Counter | 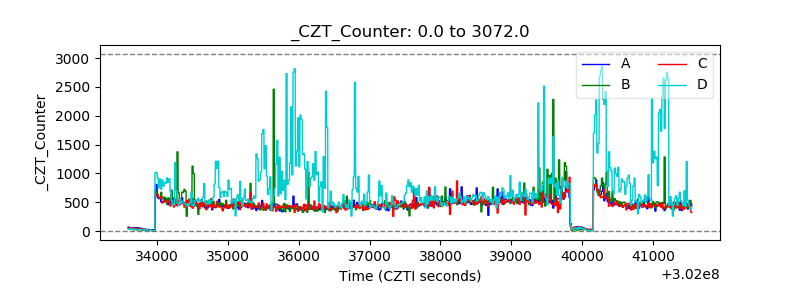 |
| +2.5 Volts monitor |  |
| +5 Volts monitor |  |
| _ROLL_ROT | 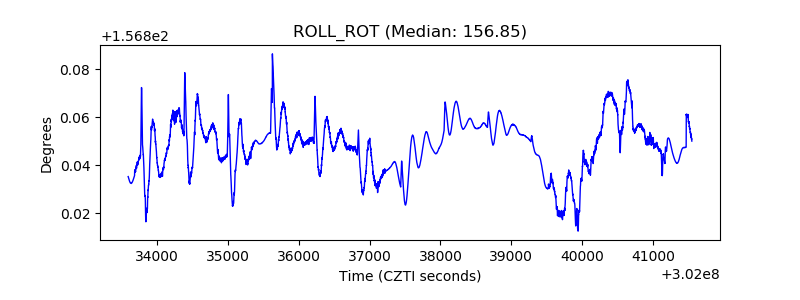 |
| _Roll_DEC |  |
| _Roll_RA | 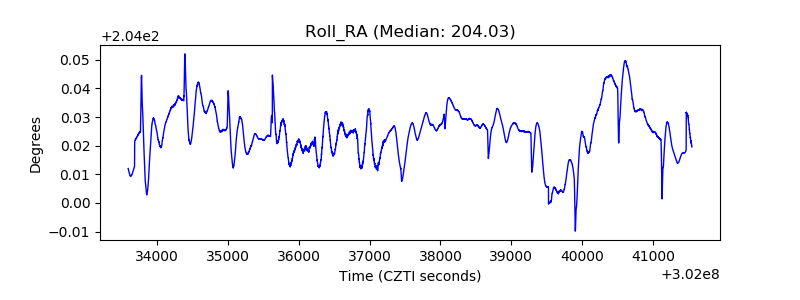 |
| Veto Counter | 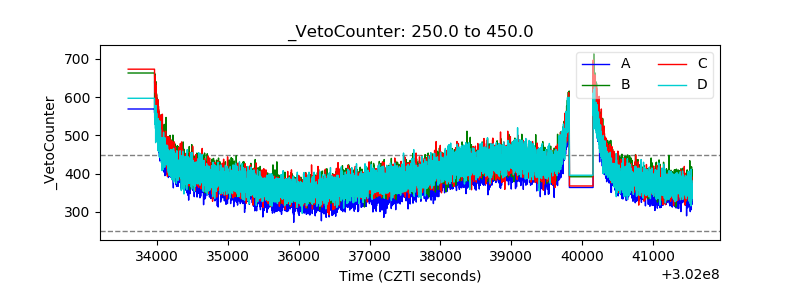 |