| Param | Original file | Final file |
|---|---|---|
| Filename | modeM0/AS1A05_165T07_9000003062_20718cztM0_level2.evt | modeM0/AS1A05_165T07_9000003062_20718cztM0_level2_quad_clean.evt |
| Size (bytes) | 563,814,720 | 100,509,120 |
| Size | 537.7 MB | 95.9 MB |
| Events in quadrant A | 3,535,267 | 660,391 |
| Events in quadrant B | 3,748,053 | 651,902 |
| Events in quadrant C | 3,497,103 | 628,563 |
| Events in quadrant D | 5,789,752 | 584,806 |
| Mode SS | |||
|---|---|---|---|
| Quadrant | BADHDUFLAG | Total packets | Discarded packets |
| A | 0 | 152 | 0 |
| B | 0 | 152 | 0 |
| C | 0 | 152 | 0 |
| D | 0 | 152 | 0 |
| Mode M0 | |||
|---|---|---|---|
| Quadrant | BADHDUFLAG | Total packets | Discarded packets |
| A | 0 | 15477 | 2 |
| B | 0 | 16107 | 2 |
| C | 0 | 15305 | 2 |
| D | 0 | 22446 | 2 |
| Mode M9 | |||
|---|---|---|---|
| Quadrant | BADHDUFLAG | Total packets | Discarded packets |
| A | 0 | 6 | 0 |
| B | 0 | 7 | 0 |
| C | 0 | 7 | 0 |
| D | 0 | 7 | 0 |
| Quadrant | Total seconds | Saturated seconds | Saturation percentage |
|---|---|---|---|
| A | 7447 | 58 | 0.778837% |
| B | 7447 | 125 | 1.678528% |
| C | 7447 | 84 | 1.127971% |
| D | 7447 | 652 | 8.755203% |
Noise dominated data is calculated using 1-second bins in cleaned event files. If a bin has >2000 counts, and if more than 50% of those come from <1% of pixels, then it is considered to be noise-dominated and hence unusable.
| Quadrant | # 1 sec bins | Bins with >0 counts | Bins with >2000 counts | High rate bins dominated by noise | Noise dominated (total time) | Noise dominated (detector-on time) | Marked lightcurve |
|---|---|---|---|---|---|---|---|
| A | 7792 | 7448 | 0 | 0 | 0.00% | 0.00% | 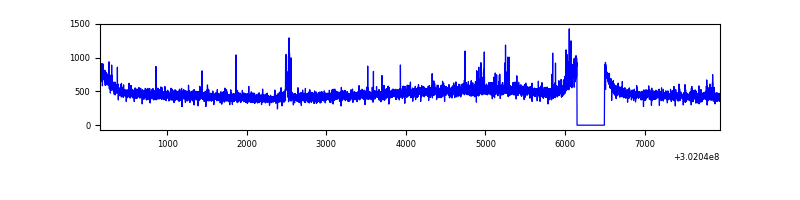 |
| B | 7792 | 7448 | 30 | 30 | 0.39% | 0.40% | 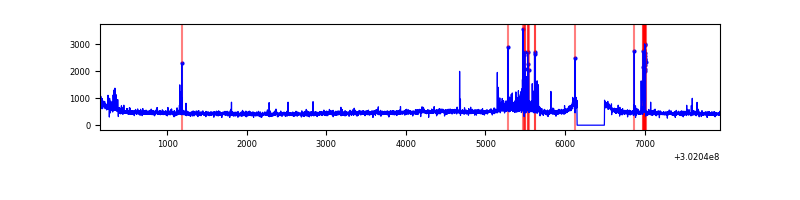 |
| C | 7792 | 7448 | 0 | 0 | 0.00% | 0.00% | 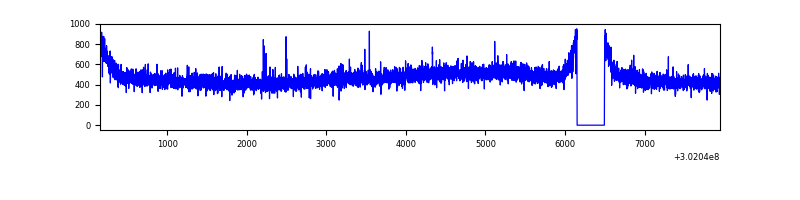 |
| D | 7792 | 7448 | 473 | 473 | 6.07% | 6.35% | 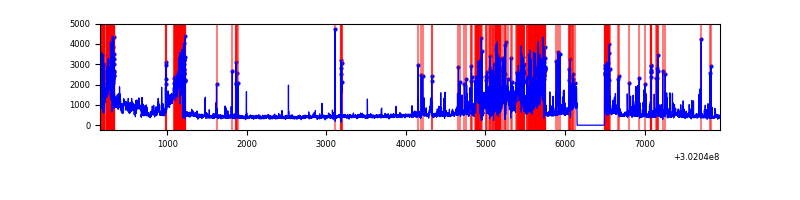 |
Top three noisy pixels from each quadrant. If the there are fewer than three noisy pixels in the level2.evt file, extra rows are filled as -1
| Pixel properties | Quadrant properties | ||||||
|---|---|---|---|---|---|---|---|
| Quadrant | DetID | PixID | Counts | Sigma | Mean | Median | Sigma |
| A | 10 | 253 | 35782 | 190.76 | 899 | 883 | 182.9 |
| A | 5 | 16 | 27546 | 145.74 | 899 | 883 | 182.9 |
| A | 0 | 226 | 7938 | 38.56 | 899 | 883 | 182.9 |
| B | 7 | 220 | 185759 | 1089.66 | 885 | 866 | 169.7 |
| B | 0 | 190 | 38226 | 220.18 | 885 | 866 | 169.7 |
| B | 12 | 111 | 20314 | 114.62 | 885 | 866 | 169.7 |
| C | 14 | 238 | 131780 | 660.37 | 844 | 849 | 198.3 |
| C | 7 | 247 | 35639 | 175.47 | 844 | 849 | 198.3 |
| C | 8 | 208 | 28177 | 137.83 | 844 | 849 | 198.3 |
| D | 1 | 52 | 1817498 | 9015.41 | 827 | 803 | 201.5 |
| D | 5 | 222 | 325612 | 1611.88 | 827 | 803 | 201.5 |
| D | 7 | 38 | 268917 | 1330.52 | 827 | 803 | 201.5 |
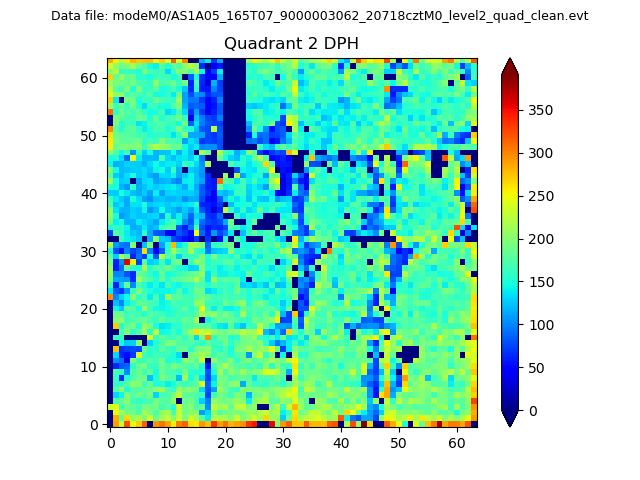
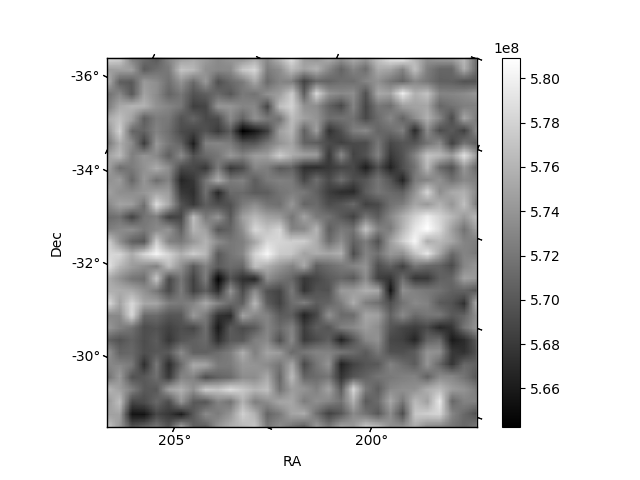
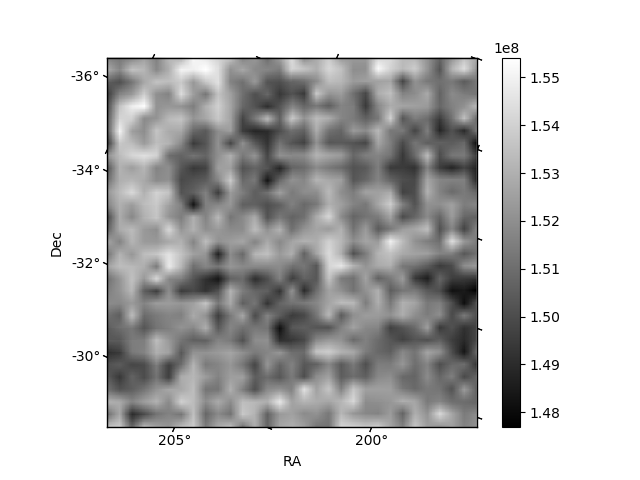
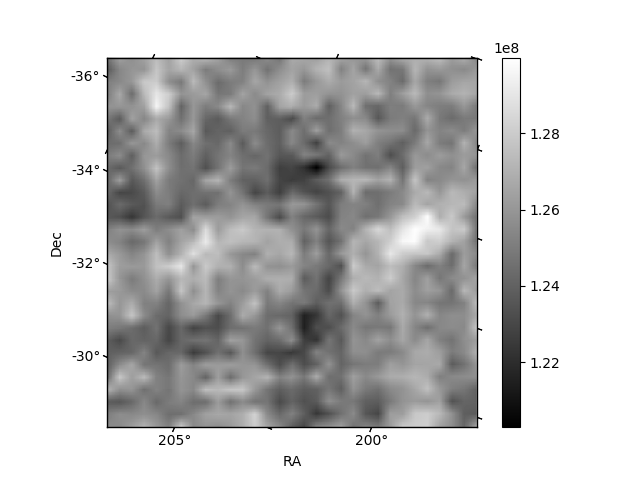
Histogram calculated using DETX and DETY for each event in the final _common_clean file
| Quadrant A | 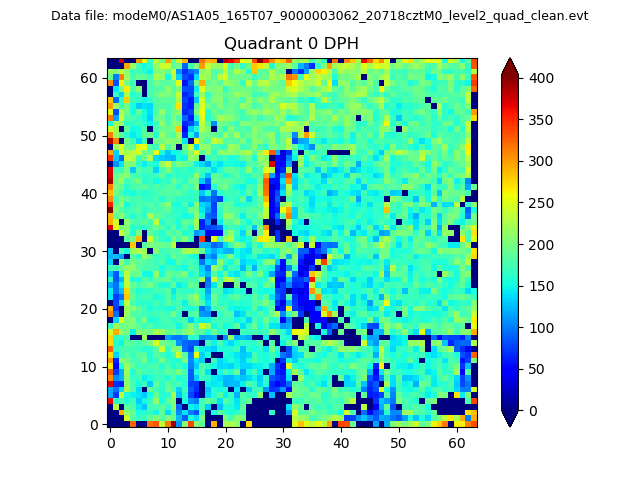 |
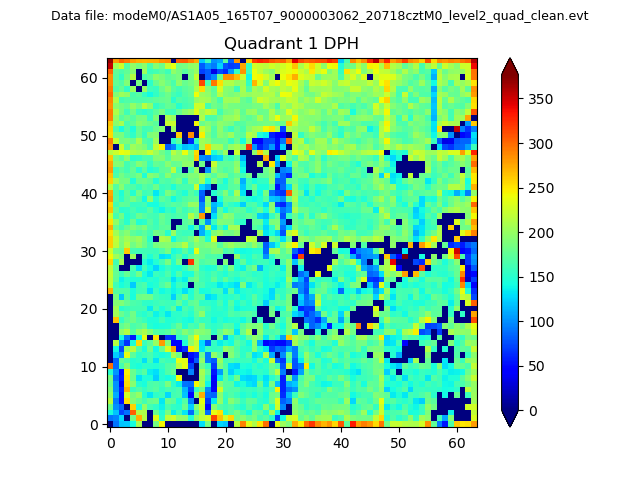 |
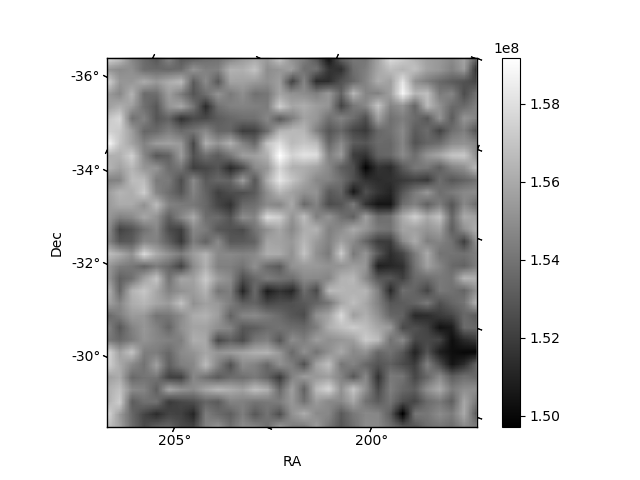
Quadrant B |
|---|---|---|---|
| Quadrant D | 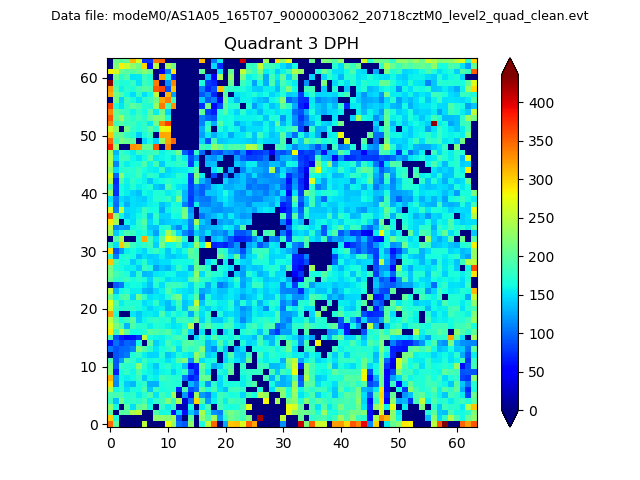 |
 |
Quadrant C |
| Plot type | Count rate plots | Images |
|---|---|---|
| Comparison with Poisson distribution Blue bars denote a histogram of data divided into 1 sec bins. Red curve is a Poisson curve with rate = median count rate of data. |
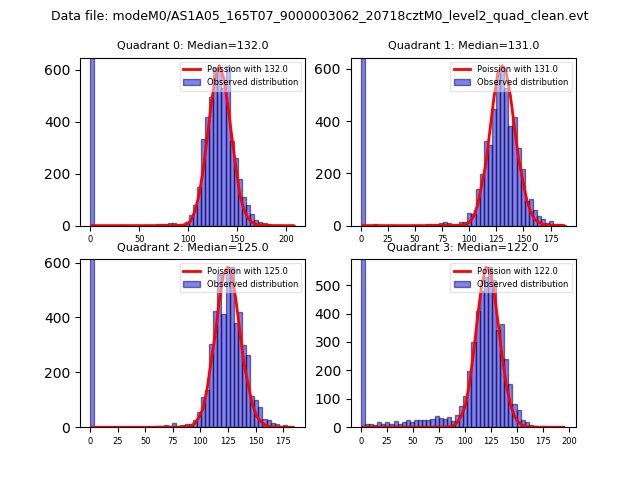 |
 |
| Quadrant-wise count rates Data is divided into 100 sec bins |
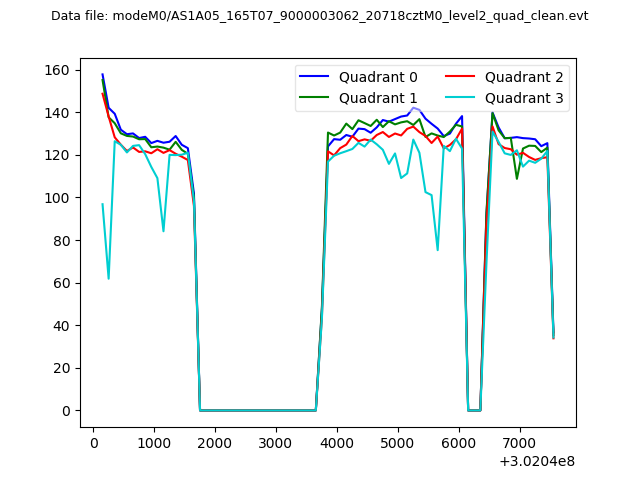 |
|
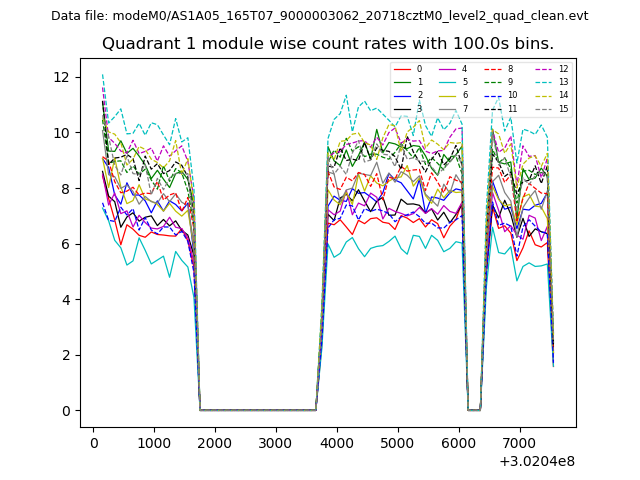
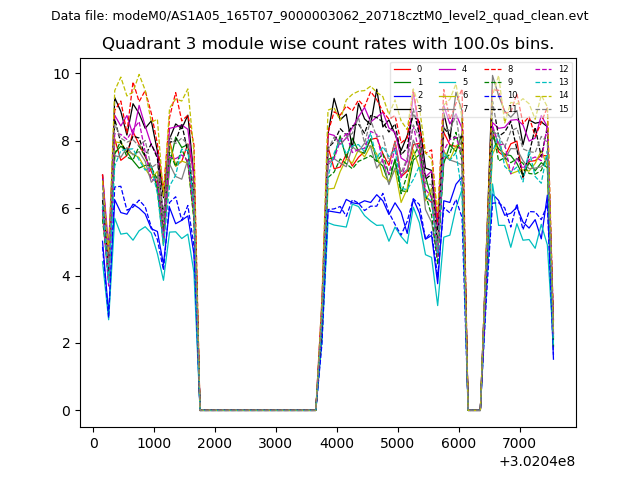
| Module-wise count rates for Quadrant A Data is divided into 100 sec bins |
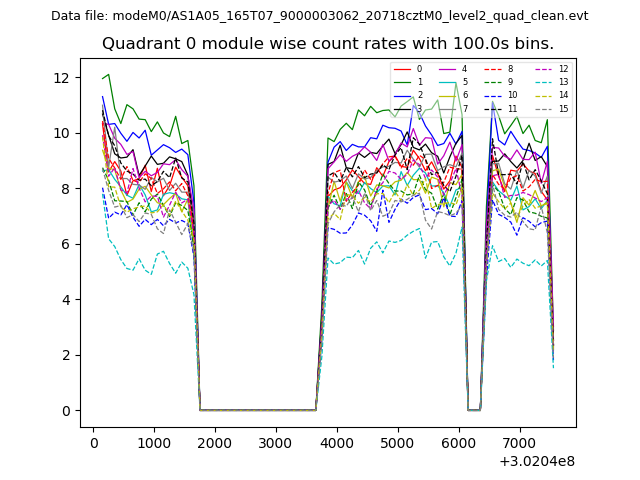 |
 |
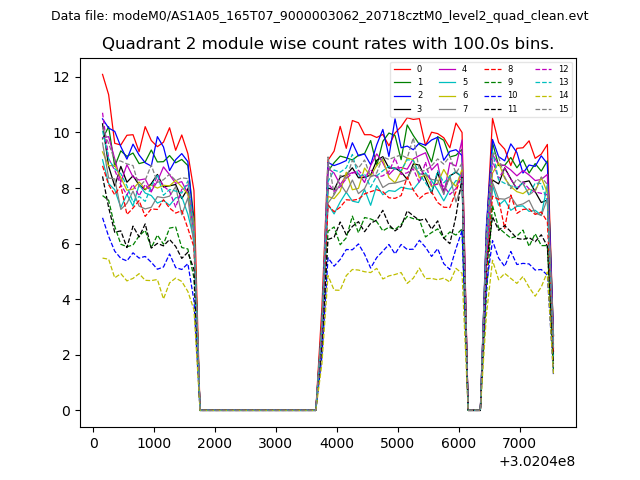
| Module-wise count rates for Quadrant B Data is divided into 100 sec bins |
 |
 |
| Module-wise count rates for Quadrant C Data is divided into 100 sec bins |
 |
 |
| Module-wise count rates for Quadrant D Data is divided into 100 sec bins |
 |
 |
| Parameter | Plot |
|---|---|
| CZT HV Monitor | 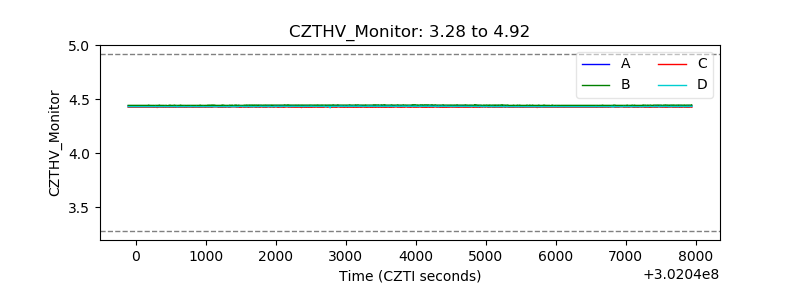 |
| D_VDD | 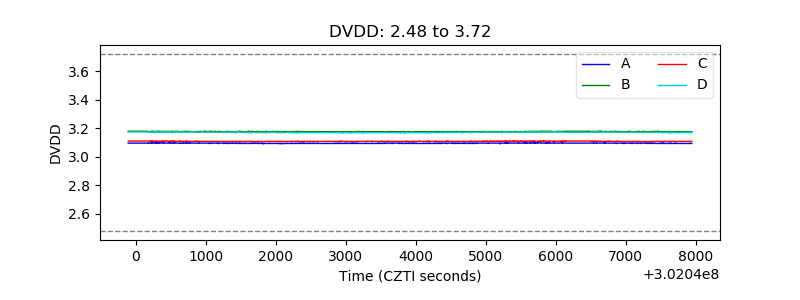 |
| Temperature 1 | 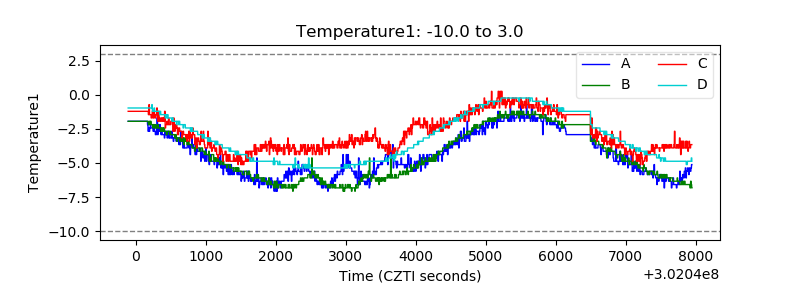 |
| Veto HV Monitor |  |
| Veto LLD |  |
| Alpha Counter | 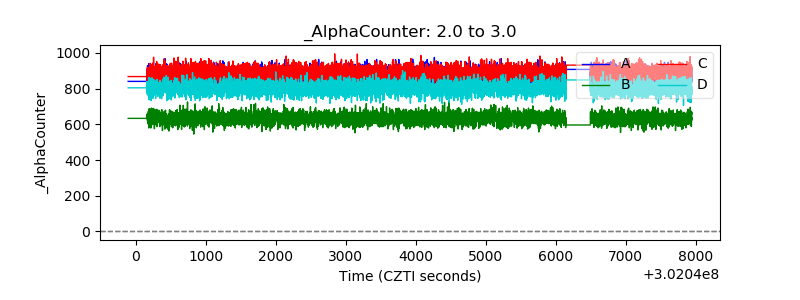 |
| _CPM_Rate | 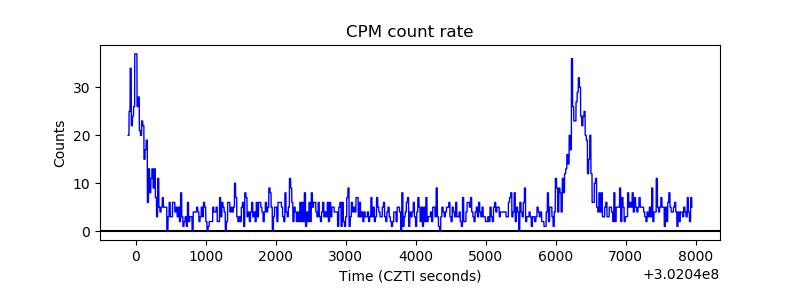 |
| CZT Counter | 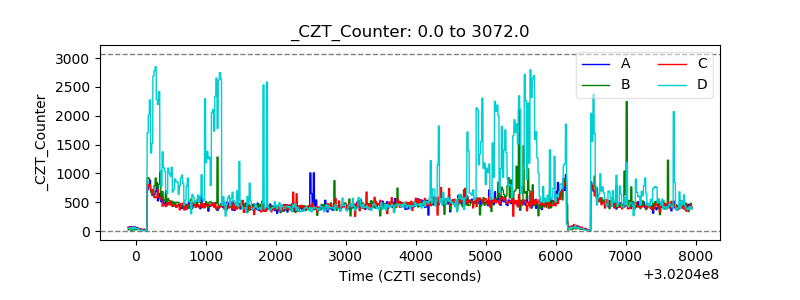 |
| +2.5 Volts monitor |  |
| +5 Volts monitor | 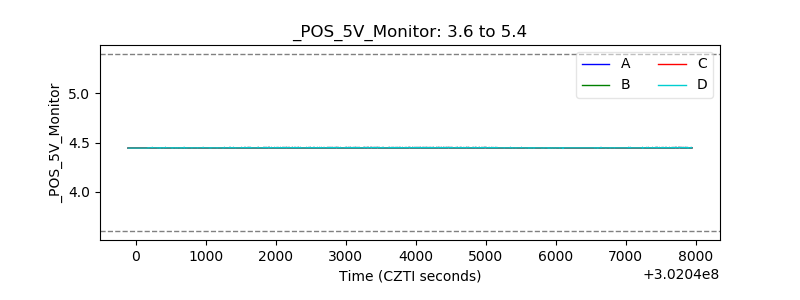 |
| _ROLL_ROT | 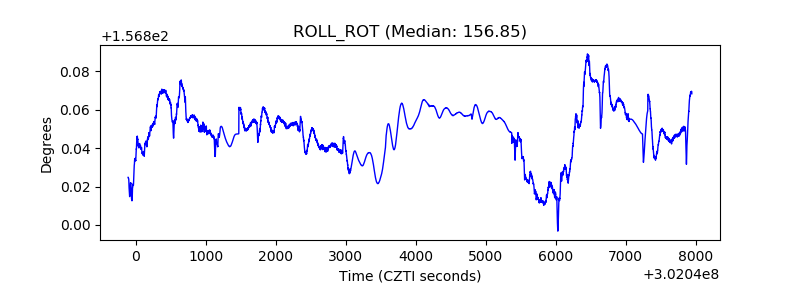 |
| _Roll_DEC | 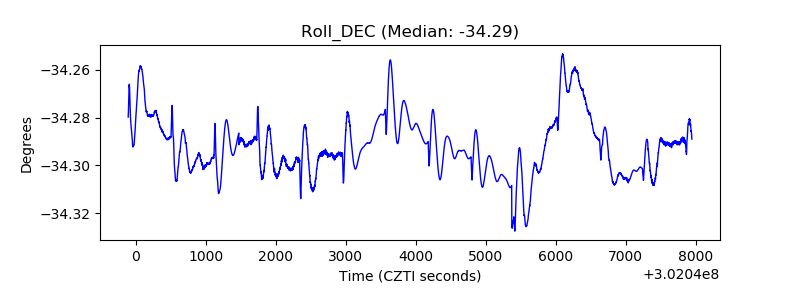 |
| _Roll_RA | 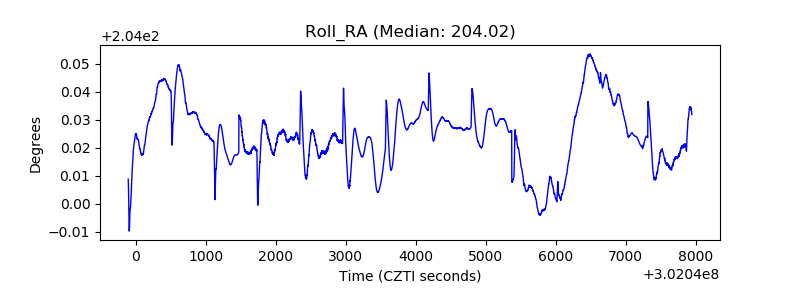 |
| Veto Counter | 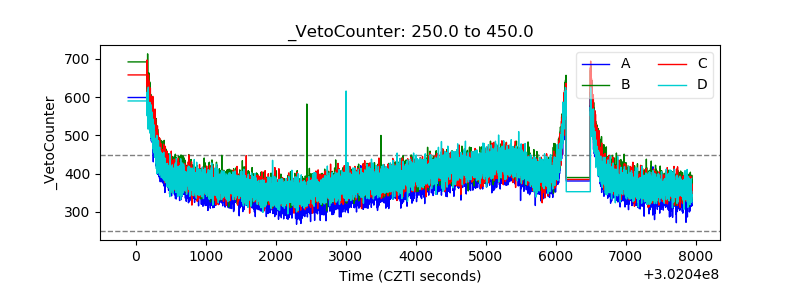 |