| Param | Original file | Final file |
|---|---|---|
| Filename | modeM0/AS1A05_165T07_9000003062_20723cztM0_level2.evt | modeM0/AS1A05_165T07_9000003062_20723cztM0_level2_quad_clean.evt |
| Size (bytes) | 445,680,000 | 86,849,280 |
| Size | 425.0 MB | 82.8 MB |
| Events in quadrant A | 3,228,373 | 557,245 |
| Events in quadrant B | 3,449,869 | 555,583 |
| Events in quadrant C | 3,242,418 | 532,992 |
| Events in quadrant D | 3,138,288 | 533,951 |
| Mode SS | |||
|---|---|---|---|
| Quadrant | BADHDUFLAG | Total packets | Discarded packets |
| A | 0 | 132 | 0 |
| B | 0 | 132 | 0 |
| C | 0 | 132 | 0 |
| D | 0 | 132 | 0 |
| Mode M0 | |||
|---|---|---|---|
| Quadrant | BADHDUFLAG | Total packets | Discarded packets |
| A | 0 | 13594 | 2 |
| B | 0 | 14136 | 2 |
| C | 0 | 13663 | 2 |
| D | 0 | 13451 | 2 |
| Mode M9 | |||
|---|---|---|---|
| Quadrant | BADHDUFLAG | Total packets | Discarded packets |
| A | 0 | 14 | 0 |
| B | 0 | 15 | 0 |
| C | 0 | 15 | 0 |
| D | 0 | 15 | 0 |
| Quadrant | Total seconds | Saturated seconds | Saturation percentage |
|---|---|---|---|
| A | 6450 | 36 | 0.558140% |
| B | 6449 | 66 | 1.023414% |
| C | 6449 | 88 | 1.364553% |
| D | 6449 | 34 | 0.527214% |
Noise dominated data is calculated using 1-second bins in cleaned event files. If a bin has >2000 counts, and if more than 50% of those come from <1% of pixels, then it is considered to be noise-dominated and hence unusable.
| Quadrant | # 1 sec bins | Bins with >0 counts | Bins with >2000 counts | High rate bins dominated by noise | Noise dominated (total time) | Noise dominated (detector-on time) | Marked lightcurve |
|---|---|---|---|---|---|---|---|
| A | 7575 | 6451 | 2 | 2 | 0.03% | 0.03% | 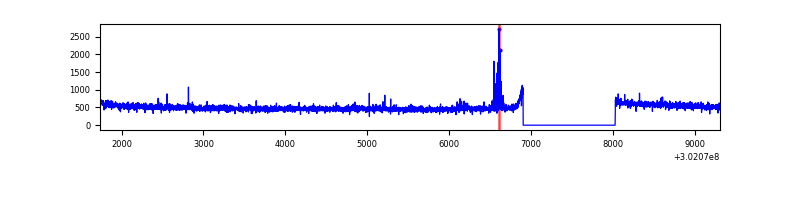 |
| B | 7574 | 6450 | 14 | 14 | 0.18% | 0.22% |  |
| C | 7574 | 6449 | 0 | 0 | 0.00% | 0.00% | 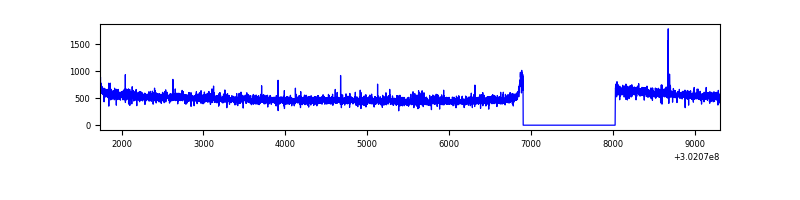 |
| D | 7574 | 6450 | 2 | 2 | 0.03% | 0.03% | 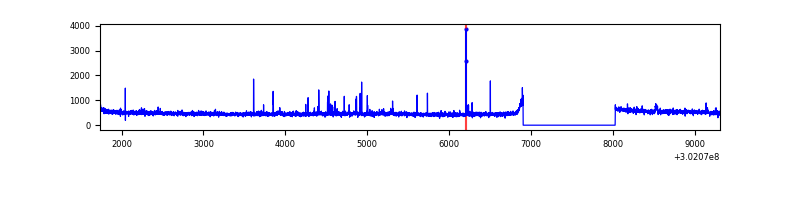 |
Top three noisy pixels from each quadrant. If the there are fewer than three noisy pixels in the level2.evt file, extra rows are filled as -1
| Pixel properties | Quadrant properties | ||||||
|---|---|---|---|---|---|---|---|
| Quadrant | DetID | PixID | Counts | Sigma | Mean | Median | Sigma |
| A | 10 | 253 | 37515 | 221.17 | 826 | 809 | 166.0 |
| A | 8 | 6 | 8671 | 47.37 | 826 | 809 | 166.0 |
| A | 0 | 226 | 7298 | 39.1 | 826 | 809 | 166.0 |
| B | 7 | 220 | 165804 | 1087.06 | 814 | 797 | 151.8 |
| B | 0 | 229 | 25376 | 161.93 | 814 | 797 | 151.8 |
| B | 0 | 197 | 19801 | 125.2 | 814 | 797 | 151.8 |
| C | 14 | 238 | 125580 | 690.37 | 784 | 790 | 180.8 |
| C | 8 | 208 | 25933 | 139.09 | 784 | 790 | 180.8 |
| C | 9 | 54 | 18059 | 95.53 | 784 | 790 | 180.8 |
| D | 1 | 52 | 30093 | 153.18 | 803 | 781 | 191.4 |
| D | 2 | 234 | 24991 | 126.52 | 803 | 781 | 191.4 |
| D | 1 | 20 | 20961 | 105.46 | 803 | 781 | 191.4 |
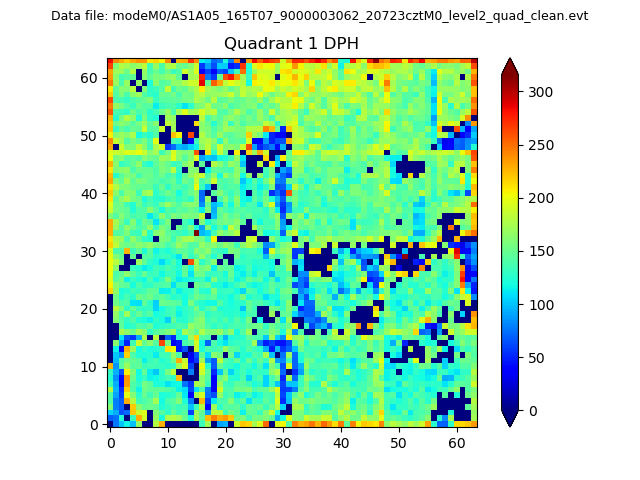
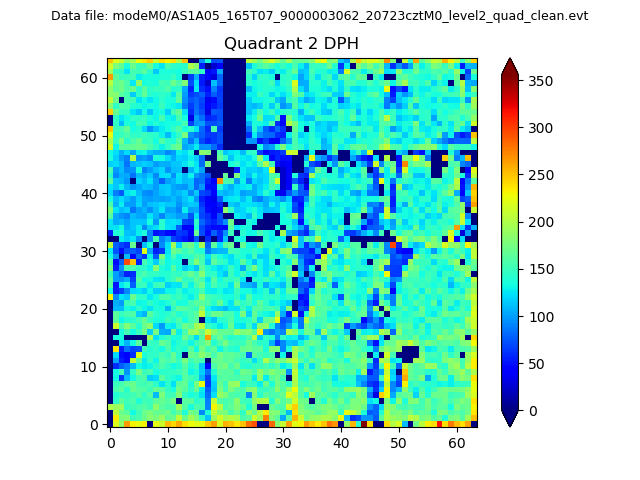
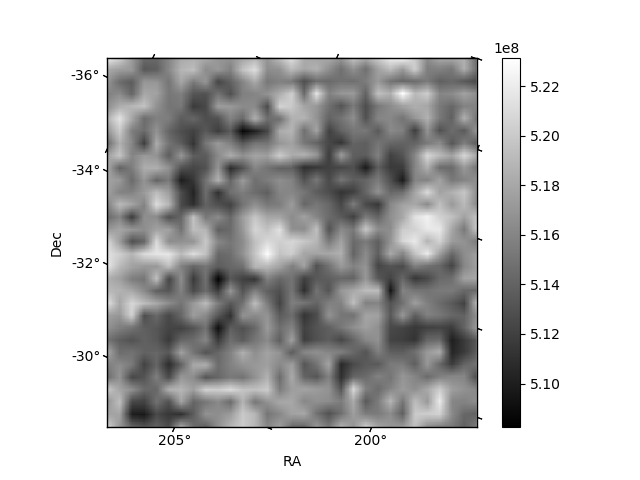
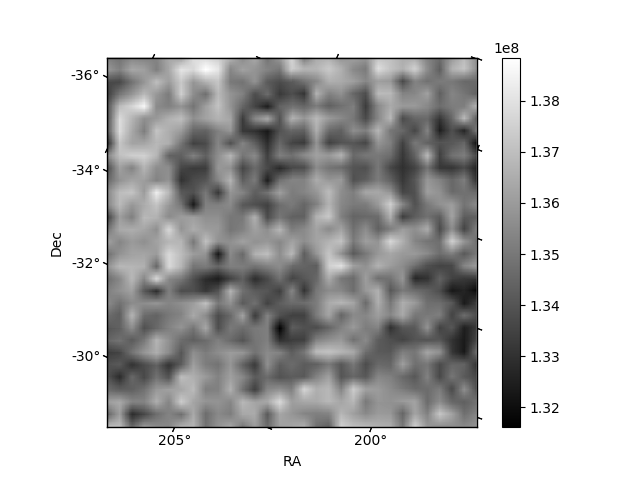
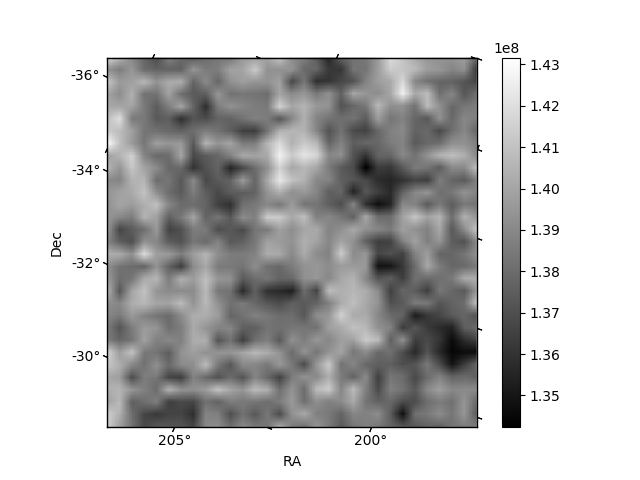
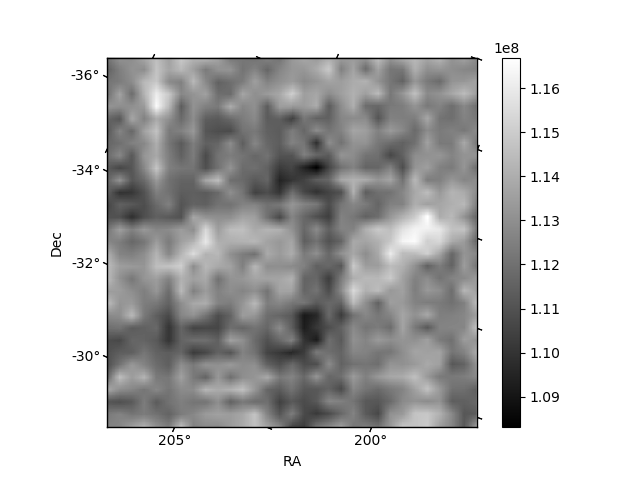
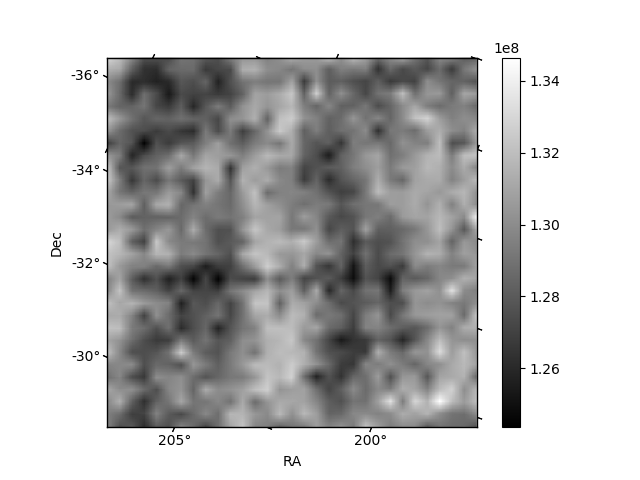
Histogram calculated using DETX and DETY for each event in the final _common_clean file
| Quadrant A | 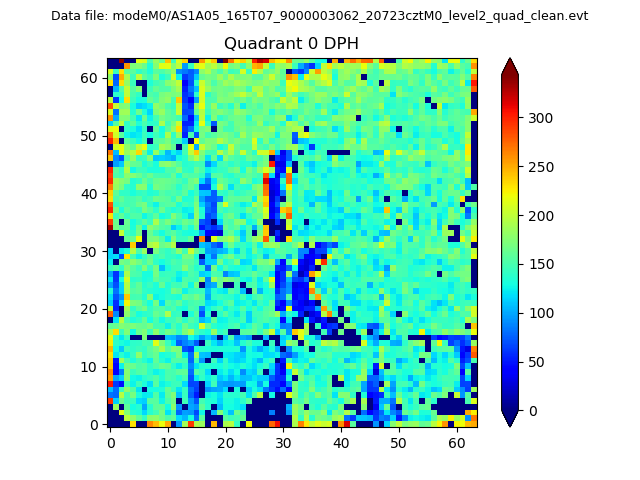 |
 |
Quadrant B |
|---|---|---|---|
| Quadrant D | 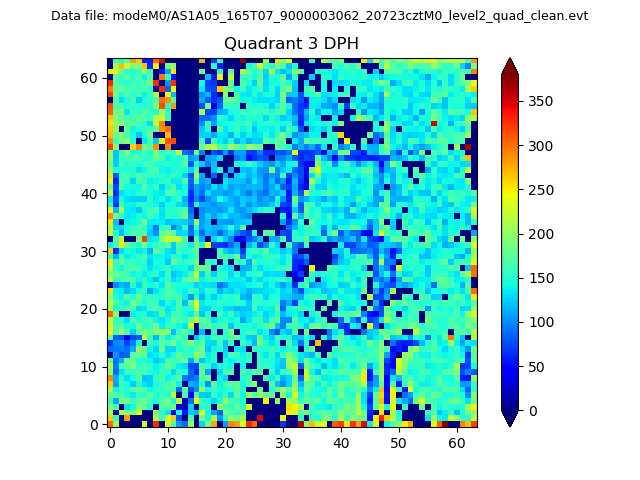 |
 |
Quadrant C |
| Plot type | Count rate plots | Images |
|---|---|---|
| Comparison with Poisson distribution Blue bars denote a histogram of data divided into 1 sec bins. Red curve is a Poisson curve with rate = median count rate of data. |
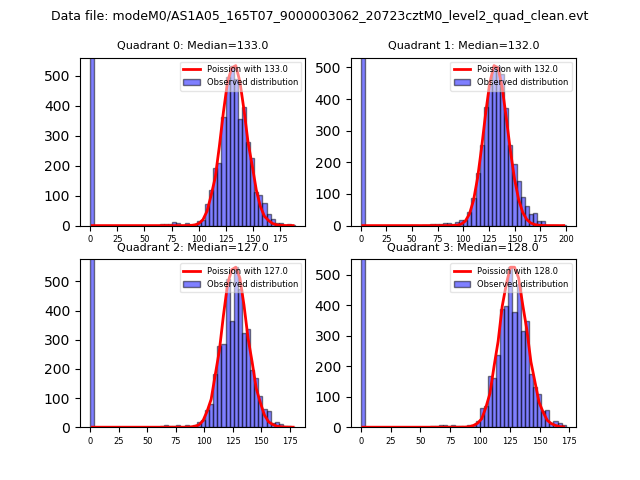 |
 |
| Quadrant-wise count rates Data is divided into 100 sec bins |
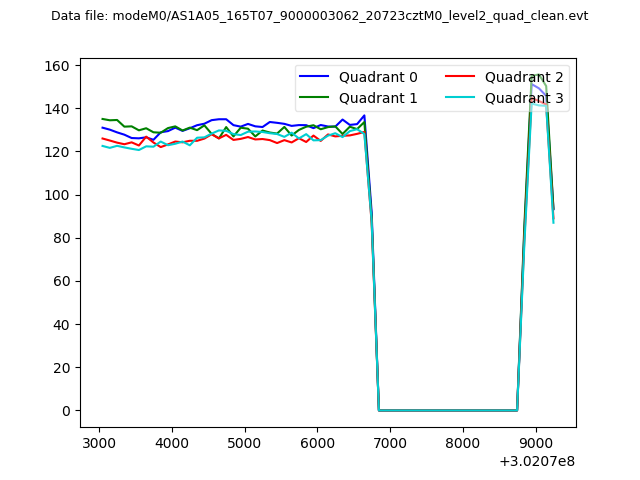 |
|
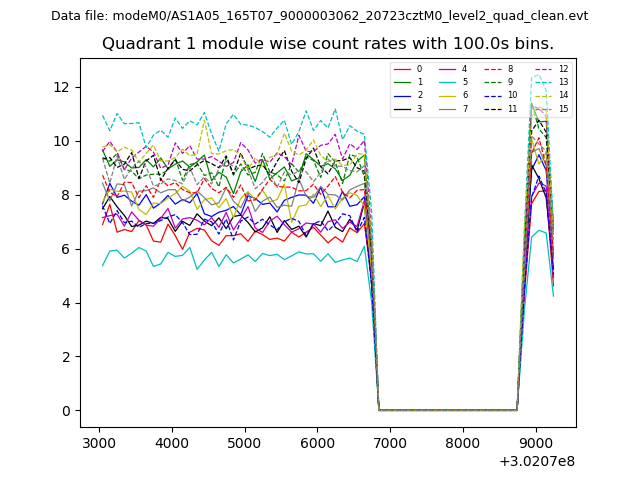
| Module-wise count rates for Quadrant A Data is divided into 100 sec bins |
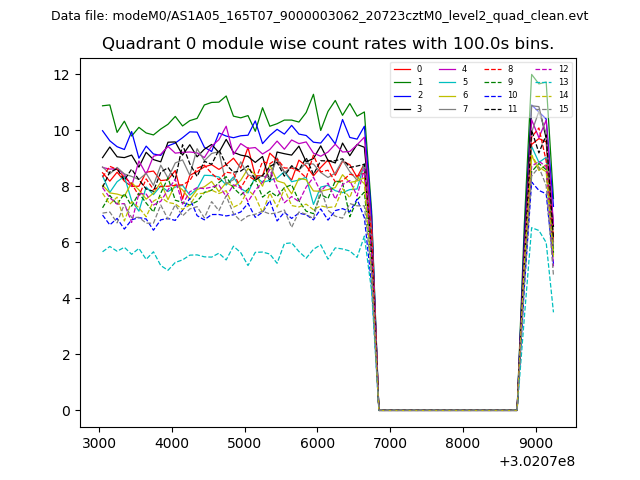 |
 |
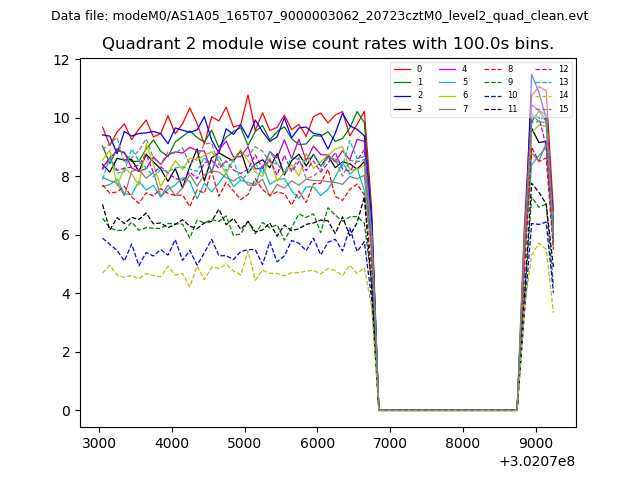
| Module-wise count rates for Quadrant B Data is divided into 100 sec bins |
 |
 |
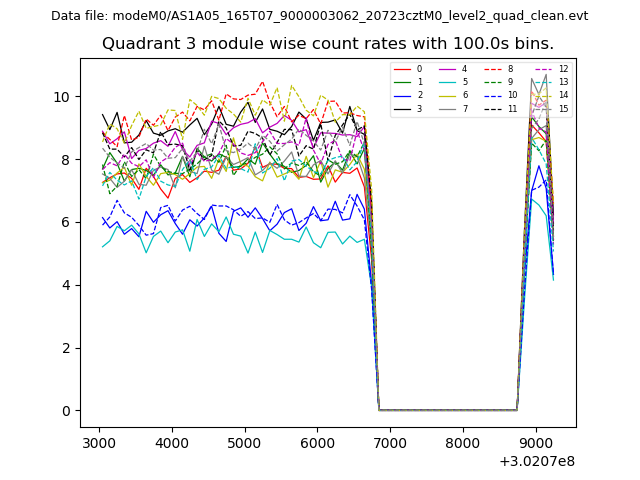
| Module-wise count rates for Quadrant C Data is divided into 100 sec bins |
 |
 |
| Module-wise count rates for Quadrant D Data is divided into 100 sec bins |
 |
 |
| Parameter | Plot |
|---|---|
| CZT HV Monitor | 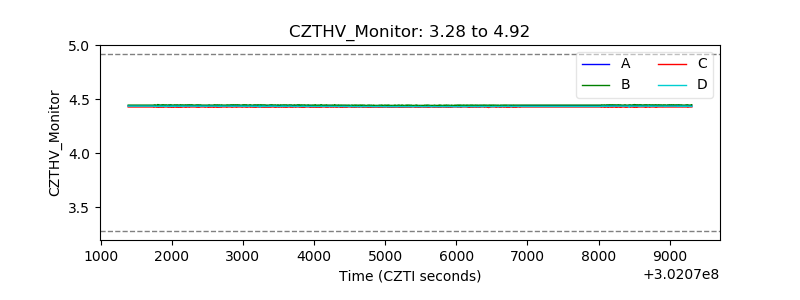 |
| D_VDD |  |
| Temperature 1 | 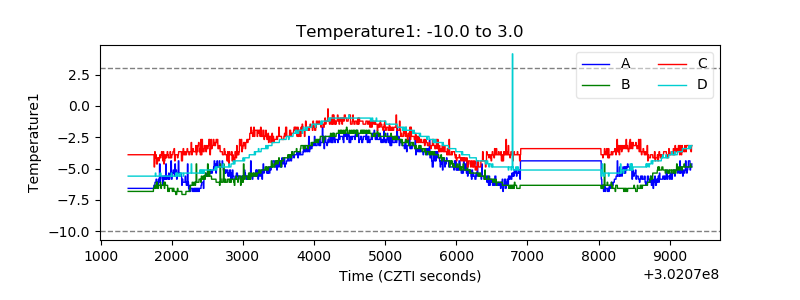 |
| Veto HV Monitor |  |
| Veto LLD | 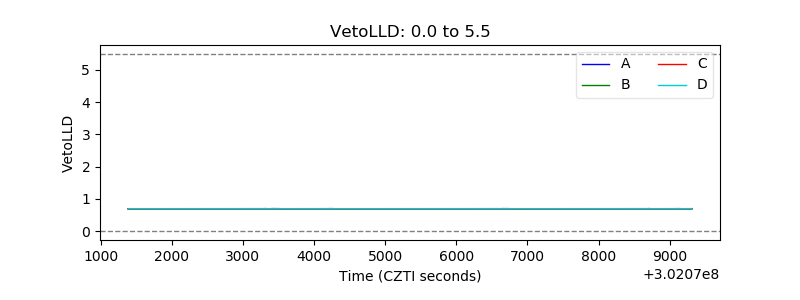 |
| Alpha Counter | 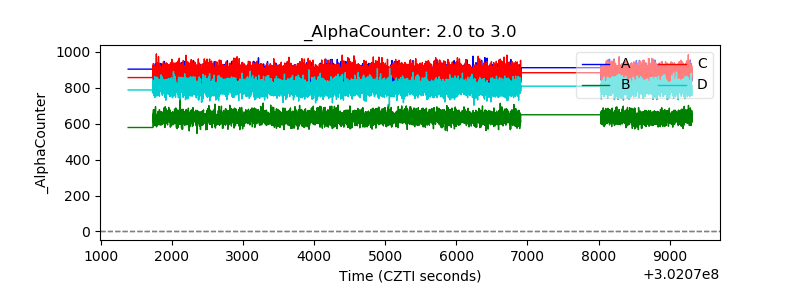 |
| _CPM_Rate | 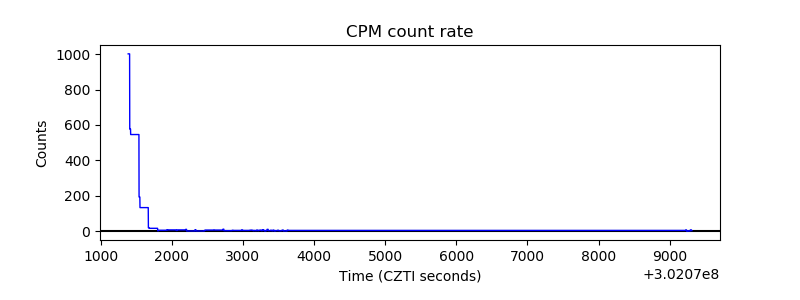 |
| CZT Counter | 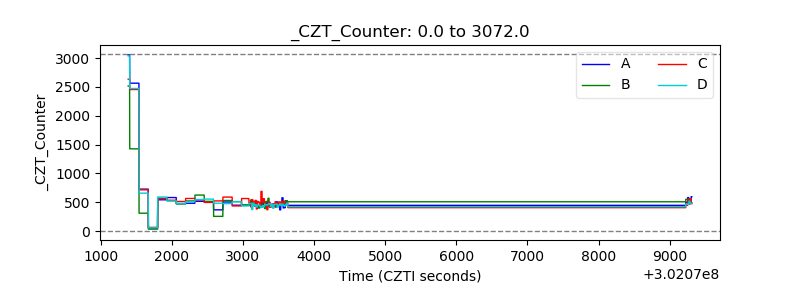 |
| +2.5 Volts monitor |  |
| +5 Volts monitor |  |
| _ROLL_ROT | 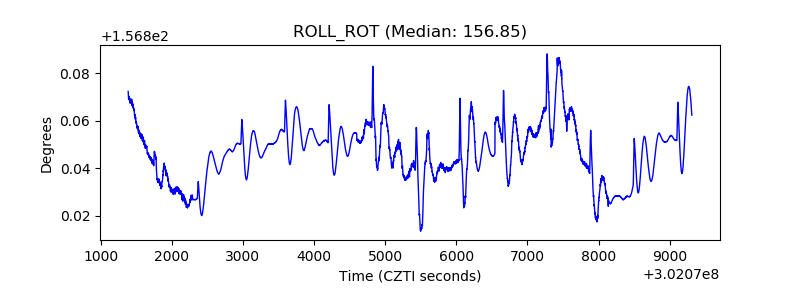 |
| _Roll_DEC | 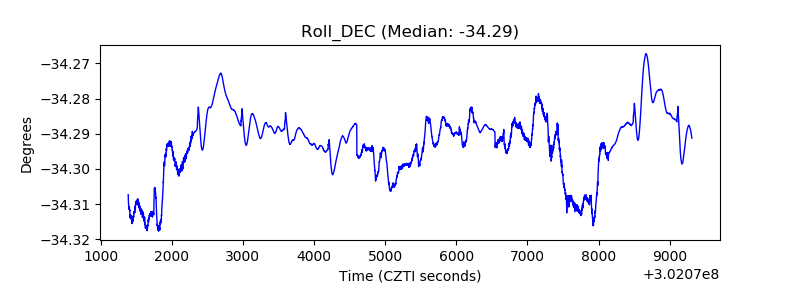 |
| _Roll_RA | 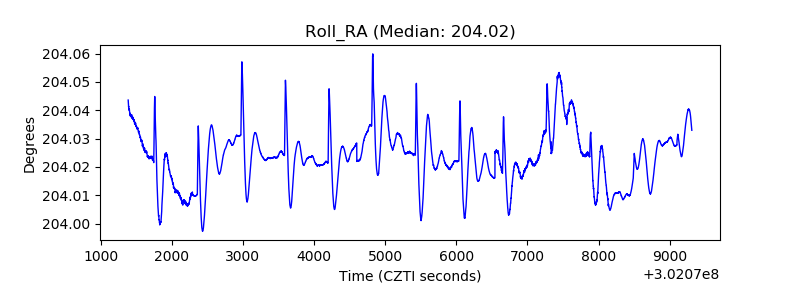 |
| Veto Counter | 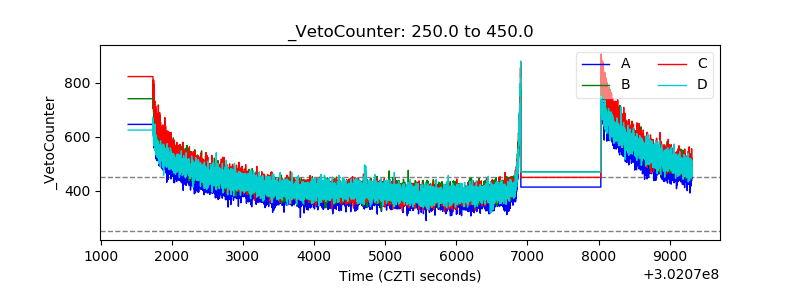 |