| Param | Original file | Final file |
|---|---|---|
| Filename | modeM0/AS1A05_165T07_9000003062_20725cztM0_level2.evt | modeM0/AS1A05_165T07_9000003062_20725cztM0_level2_quad_clean.evt |
| Size (bytes) | 472,285,440 | 100,103,040 |
| Size | 450.4 MB | 95.5 MB |
| Events in quadrant A | 3,324,369 | 665,864 |
| Events in quadrant B | 3,581,771 | 657,672 |
| Events in quadrant C | 3,347,520 | 635,140 |
| Events in quadrant D | 3,618,732 | 630,352 |
| Mode SS | |||
|---|---|---|---|
| Quadrant | BADHDUFLAG | Total packets | Discarded packets |
| A | 0 | 128 | 0 |
| B | 0 | 128 | 0 |
| C | 0 | 128 | 0 |
| D | 0 | 128 | 0 |
| Mode M0 | |||
|---|---|---|---|
| Quadrant | BADHDUFLAG | Total packets | Discarded packets |
| A | 0 | 13956 | 2 |
| B | 0 | 14698 | 2 |
| C | 0 | 14126 | 2 |
| D | 0 | 14893 | 3 |
| Mode M9 | |||
|---|---|---|---|
| Quadrant | BADHDUFLAG | Total packets | Discarded packets |
| A | 0 | 13 | 0 |
| B | 0 | 14 | 0 |
| C | 0 | 14 | 0 |
| D | 0 | 14 | 0 |
| Quadrant | Total seconds | Saturated seconds | Saturation percentage |
|---|---|---|---|
| A | 6347 | 86 | 1.354971% |
| B | 6347 | 125 | 1.969434% |
| C | 6347 | 142 | 2.237277% |
| D | 6346 | 108 | 1.701859% |
Noise dominated data is calculated using 1-second bins in cleaned event files. If a bin has >2000 counts, and if more than 50% of those come from <1% of pixels, then it is considered to be noise-dominated and hence unusable.
| Quadrant | # 1 sec bins | Bins with >0 counts | Bins with >2000 counts | High rate bins dominated by noise | Noise dominated (total time) | Noise dominated (detector-on time) | Marked lightcurve |
|---|---|---|---|---|---|---|---|
| A | 7512 | 6347 | 0 | 0 | 0.00% | 0.00% |  |
| B | 7512 | 6347 | 32 | 32 | 0.43% | 0.50% | 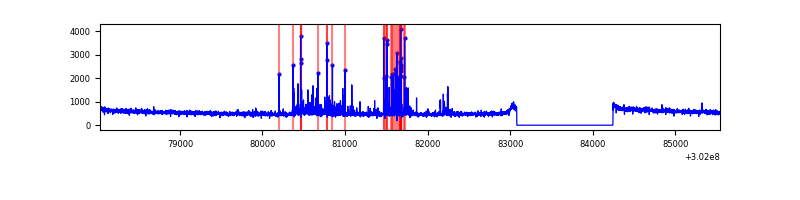 |
| C | 7512 | 6347 | 0 | 0 | 0.00% | 0.00% | 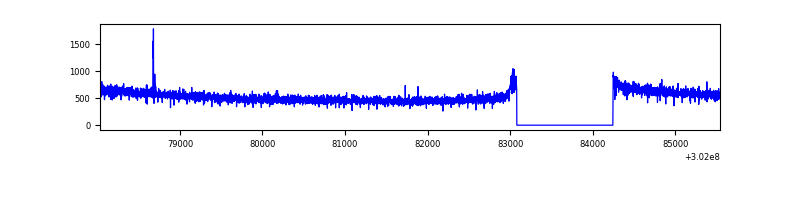 |
| D | 7511 | 6346 | 27 | 27 | 0.36% | 0.43% | 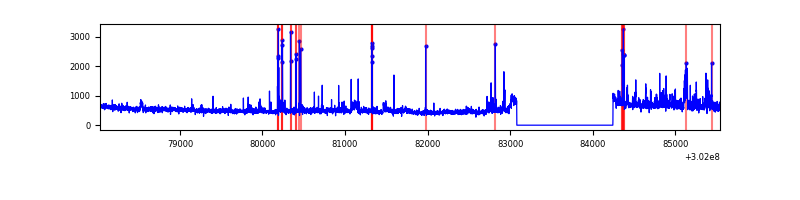 |
Top three noisy pixels from each quadrant. If the there are fewer than three noisy pixels in the level2.evt file, extra rows are filled as -1
| Pixel properties | Quadrant properties | ||||||
|---|---|---|---|---|---|---|---|
| Quadrant | DetID | PixID | Counts | Sigma | Mean | Median | Sigma |
| A | 8 | 205 | 7899 | 40.95 | 861 | 844 | 172.3 |
| A | 0 | 226 | 7524 | 38.78 | 861 | 844 | 172.3 |
| A | 3 | 137 | 6536 | 33.04 | 861 | 844 | 172.3 |
| B | 7 | 220 | 216504 | 1374.1 | 841 | 825 | 157.0 |
| B | 3 | 64 | 22788 | 139.93 | 841 | 825 | 157.0 |
| B | 0 | 197 | 21887 | 134.19 | 841 | 825 | 157.0 |
| C | 14 | 238 | 130294 | 691.01 | 814 | 821 | 187.4 |
| C | 8 | 208 | 18648 | 95.14 | 814 | 821 | 187.4 |
| C | 3 | 233 | 10519 | 51.76 | 814 | 821 | 187.4 |
| D | 5 | 222 | 235240 | 1180.81 | 836 | 815 | 198.5 |
| D | 1 | 20 | 99155 | 495.34 | 836 | 815 | 198.5 |
| D | 1 | 52 | 41464 | 204.75 | 836 | 815 | 198.5 |
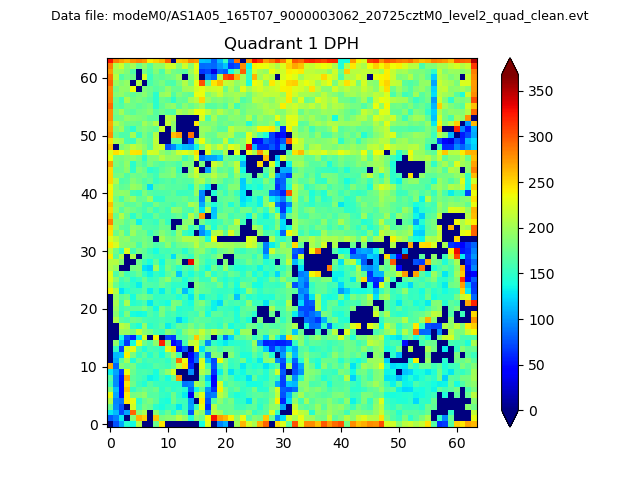
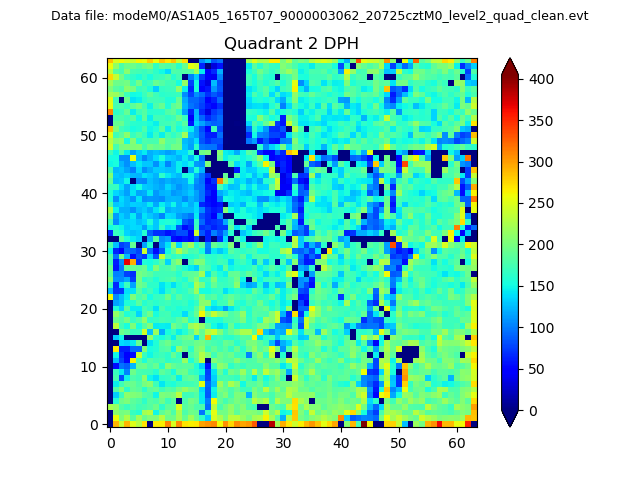
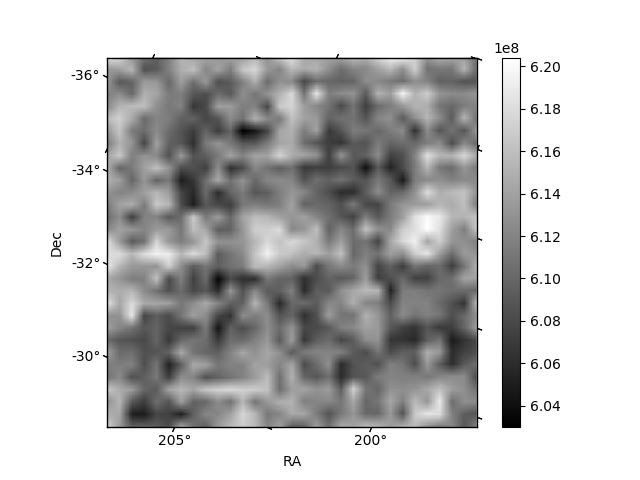
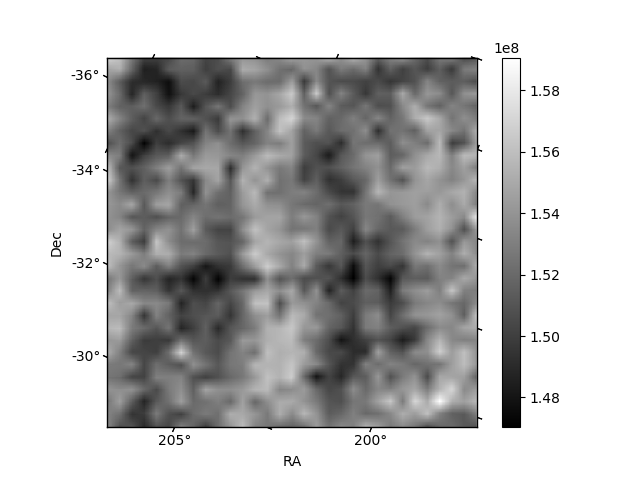
Histogram calculated using DETX and DETY for each event in the final _common_clean file
| Quadrant A | 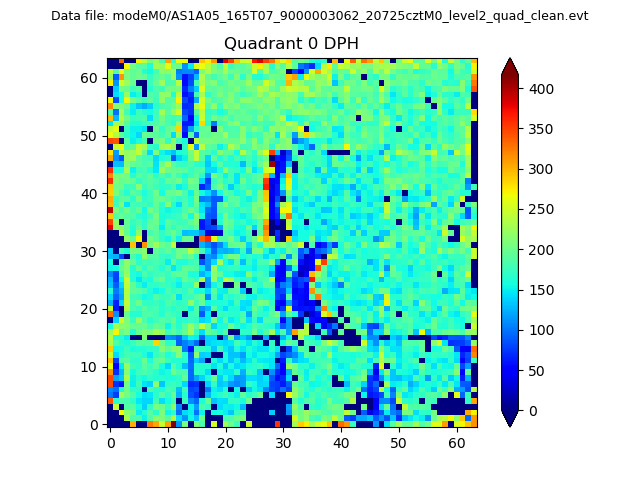 |
 |
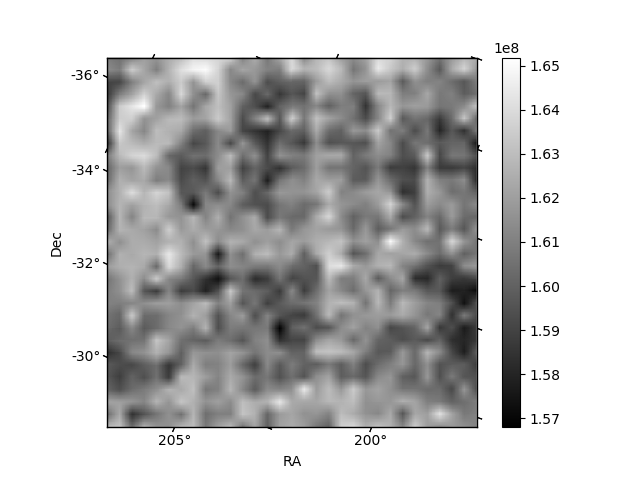
Quadrant B |
|---|---|---|---|
| Quadrant D | 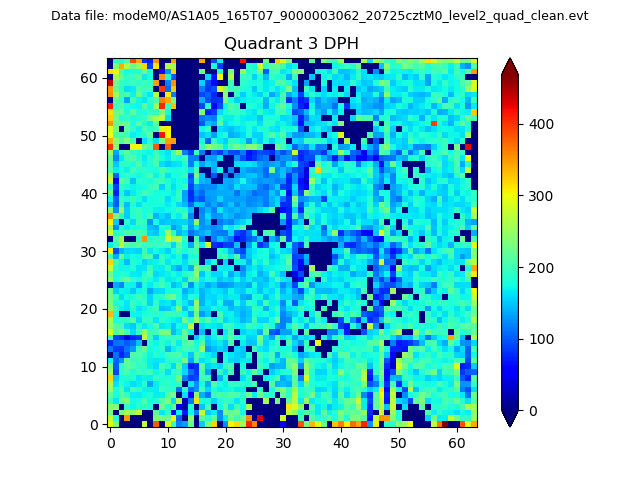 |
 |
Quadrant C |
| Plot type | Count rate plots | Images |
|---|---|---|
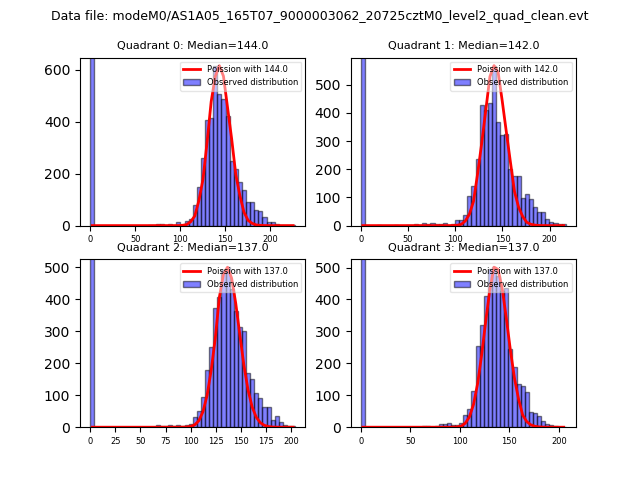
| Comparison with Poisson distribution Blue bars denote a histogram of data divided into 1 sec bins. Red curve is a Poisson curve with rate = median count rate of data. |
 |
 |
| Quadrant-wise count rates Data is divided into 100 sec bins |
 |
|
| Module-wise count rates for Quadrant A Data is divided into 100 sec bins |
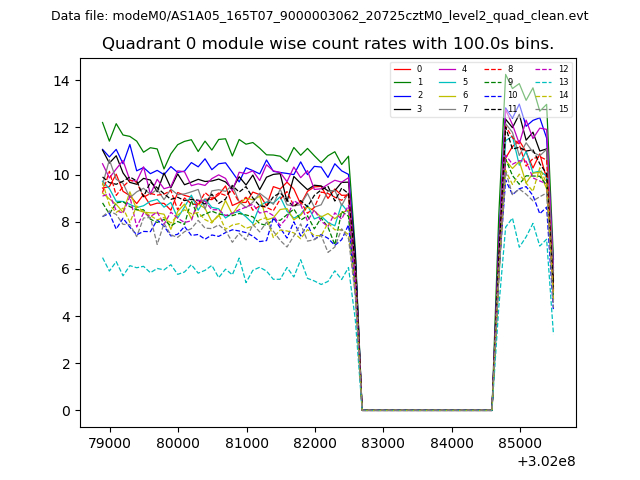 |
 |
| Module-wise count rates for Quadrant B Data is divided into 100 sec bins |
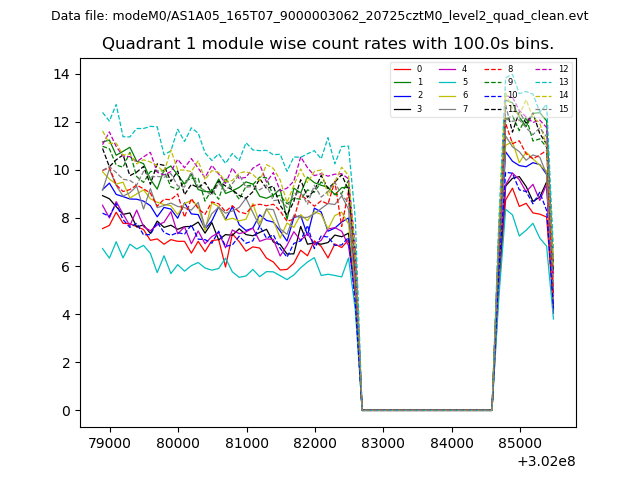 |
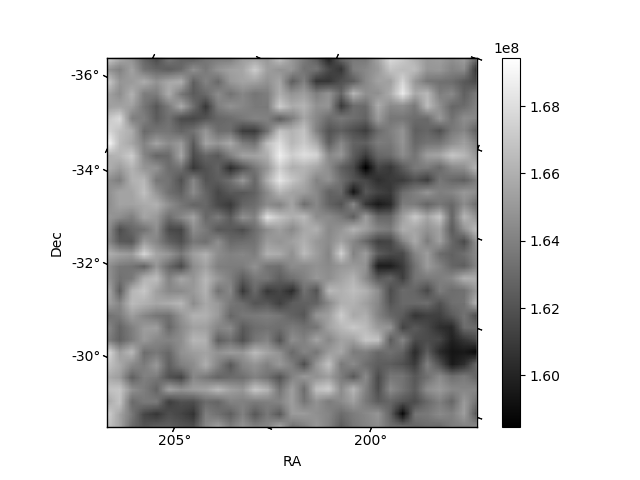 |
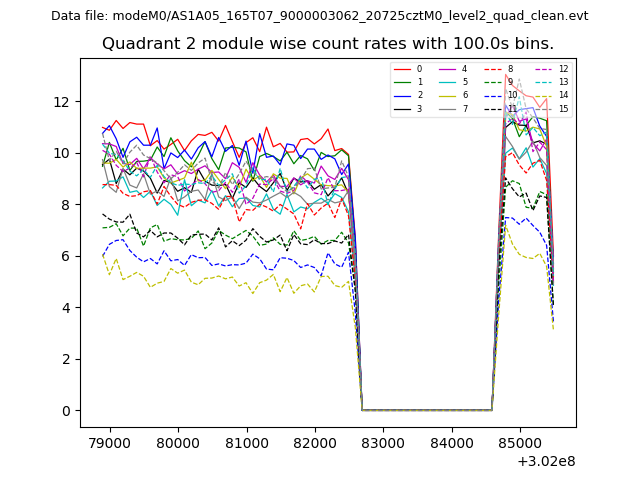
| Module-wise count rates for Quadrant C Data is divided into 100 sec bins |
 |
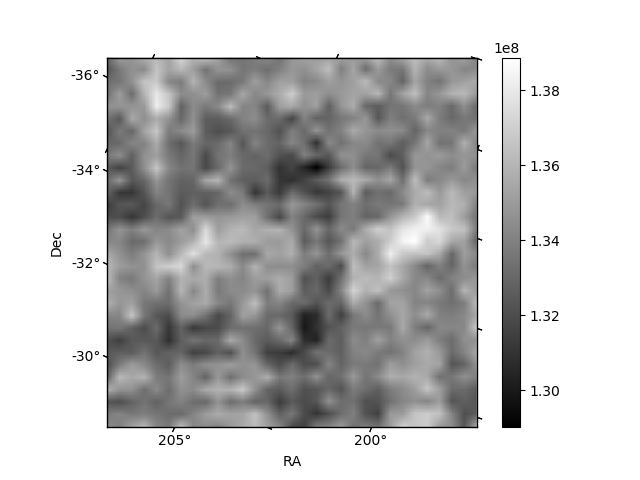 |
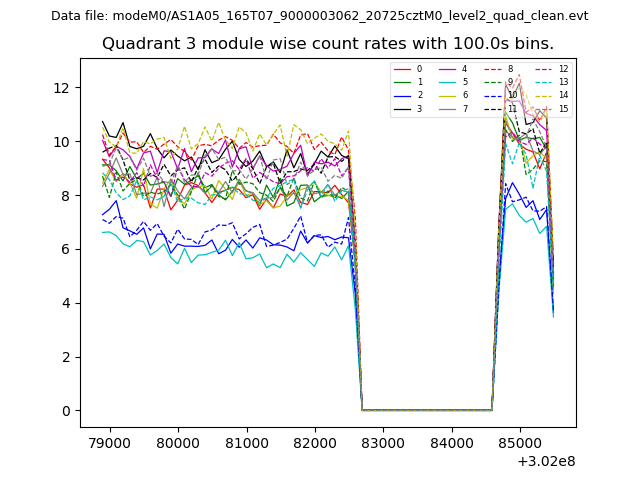
| Module-wise count rates for Quadrant D Data is divided into 100 sec bins |
 |
 |
| Parameter | Plot |
|---|---|
| CZT HV Monitor | 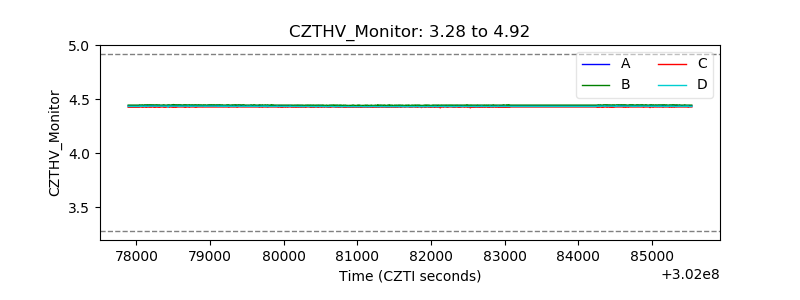 |
| D_VDD | 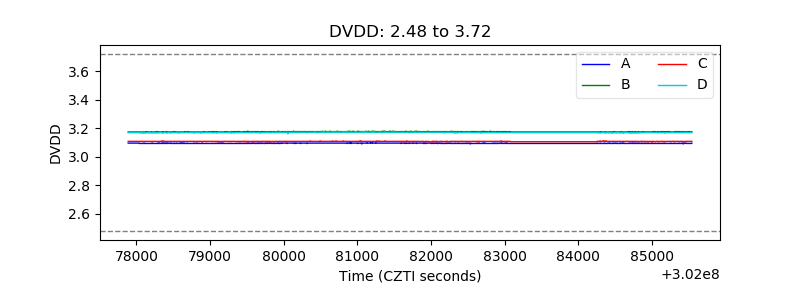 |
| Temperature 1 | 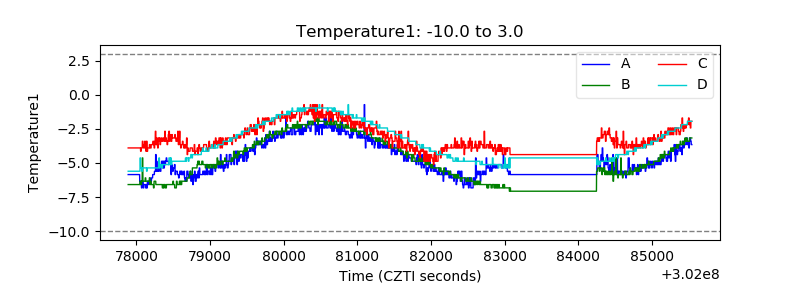 |
| Veto HV Monitor |  |
| Veto LLD | 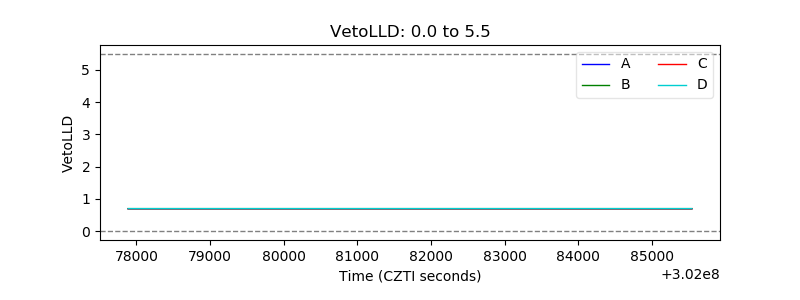 |
| Alpha Counter | 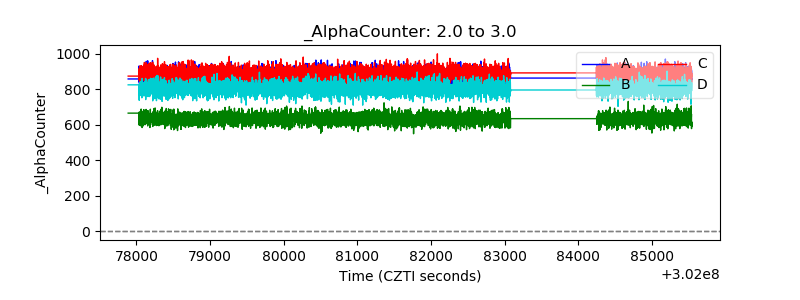 |
| _CPM_Rate | 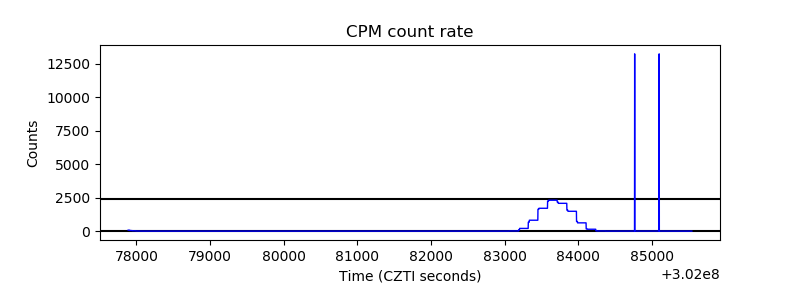 |
| CZT Counter | 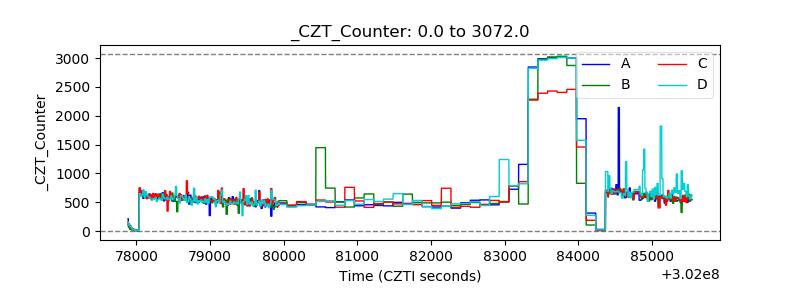 |
| +2.5 Volts monitor |  |
| +5 Volts monitor |  |
| _ROLL_ROT | 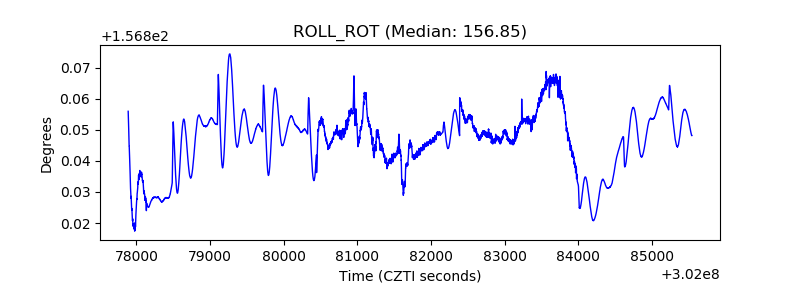 |
| _Roll_DEC | 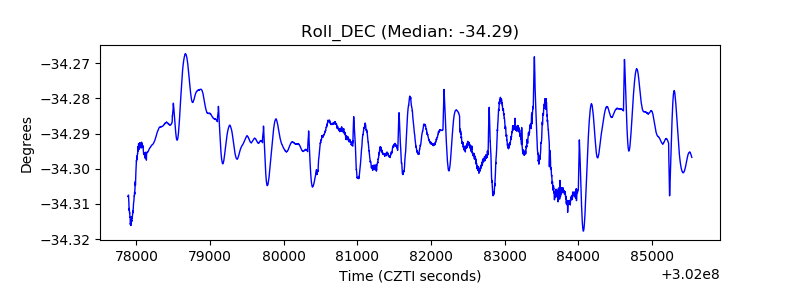 |
| _Roll_RA | 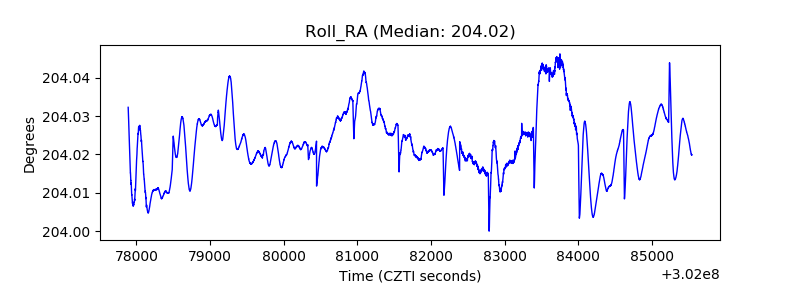 |
| Veto Counter | 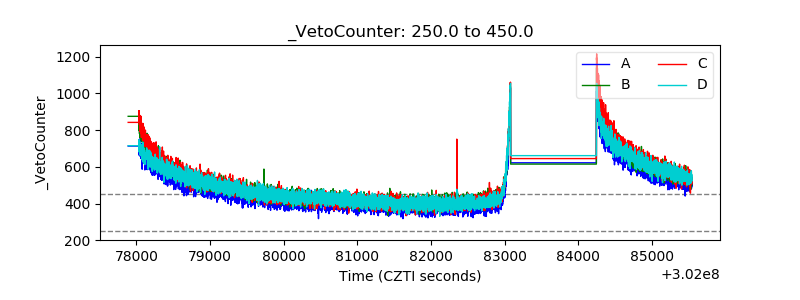 |