| Param | Original file | Final file |
|---|---|---|
| Filename | modeM0/AS1A05_165T07_9000003062_20726cztM0_level2.evt | modeM0/AS1A05_165T07_9000003062_20726cztM0_level2_quad_clean.evt |
| Size (bytes) | 445,078,080 | 111,525,120 |
| Size | 424.5 MB | 106.4 MB |
| Events in quadrant A | 3,082,538 | 768,676 |
| Events in quadrant B | 3,143,437 | 759,650 |
| Events in quadrant C | 3,121,215 | 726,957 |
| Events in quadrant D | 3,741,138 | 720,211 |
| Mode SS | |||
|---|---|---|---|
| Quadrant | BADHDUFLAG | Total packets | Discarded packets |
| A | 0 | 119 | 3 |
| B | 0 | 120 | 4 |
| C | 0 | 120 | 6 |
| D | 0 | 120 | 4 |
| Mode M0 | |||
|---|---|---|---|
| Quadrant | BADHDUFLAG | Total packets | Discarded packets |
| A | 0 | 13614 | 766 |
| B | 0 | 13719 | 754 |
| C | 0 | 13741 | 762 |
| D | 0 | 15973 | 856 |
| Mode M9 | |||
|---|---|---|---|
| Quadrant | BADHDUFLAG | Total packets | Discarded packets |
| A | 0 | 13 | 0 |
| B | 0 | 13 | 0 |
| C | 0 | 13 | 0 |
| D | 0 | 13 | 0 |
| Quadrant | Total seconds | Saturated seconds | Saturation percentage |
|---|---|---|---|
| A | 5763 | 74 | 1.284053% |
| B | 5760 | 88 | 1.527778% |
| C | 5765 | 112 | 1.942758% |
| D | 5759 | 144 | 2.500434% |
Noise dominated data is calculated using 1-second bins in cleaned event files. If a bin has >2000 counts, and if more than 50% of those come from <1% of pixels, then it is considered to be noise-dominated and hence unusable.
| Quadrant | # 1 sec bins | Bins with >0 counts | Bins with >2000 counts | High rate bins dominated by noise | Noise dominated (total time) | Noise dominated (detector-on time) | Marked lightcurve |
|---|---|---|---|---|---|---|---|
| A | 7377 | 5786 | 0 | 0 | 0.00% | 0.00% | 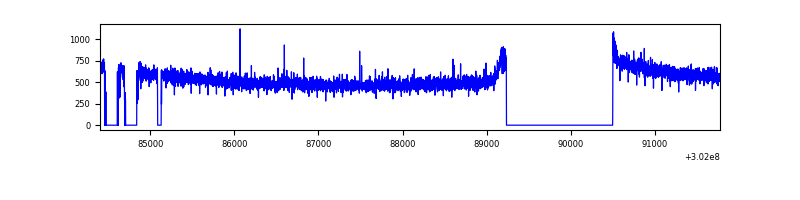 |
| B | 7377 | 5781 | 5 | 5 | 0.07% | 0.09% |  |
| C | 7377 | 5789 | 0 | 0 | 0.00% | 0.00% | 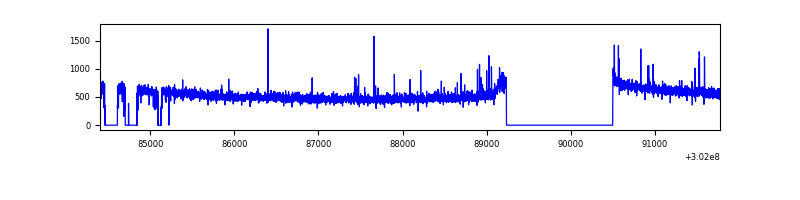 |
| D | 7377 | 5780 | 75 | 75 | 1.02% | 1.30% | 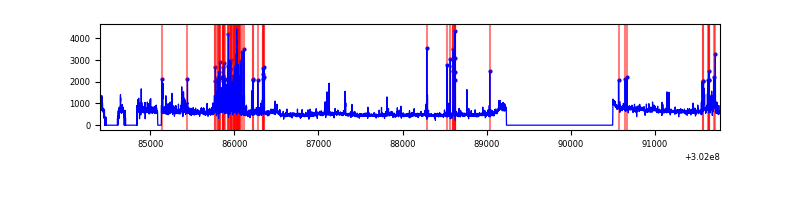 |
Top three noisy pixels from each quadrant. If the there are fewer than three noisy pixels in the level2.evt file, extra rows are filled as -1
| Pixel properties | Quadrant properties | ||||||
|---|---|---|---|---|---|---|---|
| Quadrant | DetID | PixID | Counts | Sigma | Mean | Median | Sigma |
| A | 0 | 226 | 7171 | 40.16 | 801 | 788 | 158.9 |
| A | 3 | 137 | 5905 | 32.2 | 801 | 788 | 158.9 |
| A | 12 | 194 | 5746 | 31.2 | 801 | 788 | 158.9 |
| B | 3 | 64 | 26395 | 177.88 | 776 | 761 | 144.1 |
| B | 0 | 190 | 25607 | 172.41 | 776 | 761 | 144.1 |
| B | 12 | 111 | 16440 | 108.8 | 776 | 761 | 144.1 |
| C | 14 | 238 | 119282 | 686.94 | 751 | 758 | 172.5 |
| C | 8 | 208 | 47654 | 271.8 | 751 | 758 | 172.5 |
| C | 3 | 233 | 22285 | 124.77 | 751 | 758 | 172.5 |
| D | 5 | 222 | 371176 | 2011.15 | 773 | 754 | 184.2 |
| D | 1 | 20 | 143398 | 774.47 | 773 | 754 | 184.2 |
| D | 1 | 52 | 139186 | 751.6 | 773 | 754 | 184.2 |
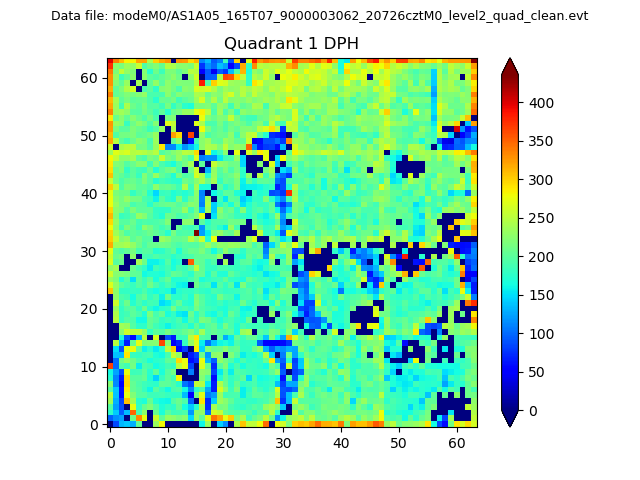
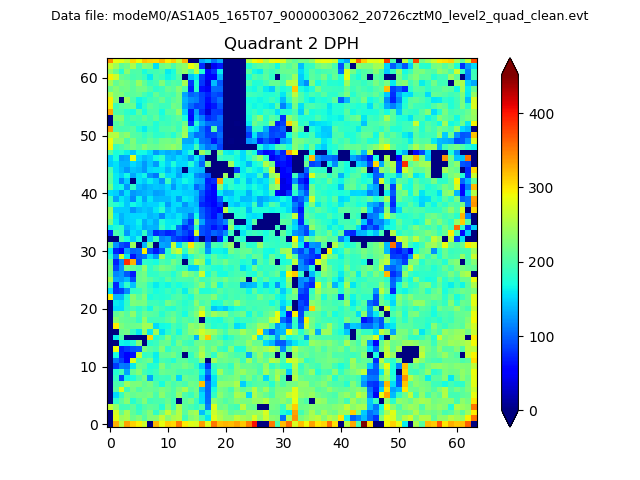
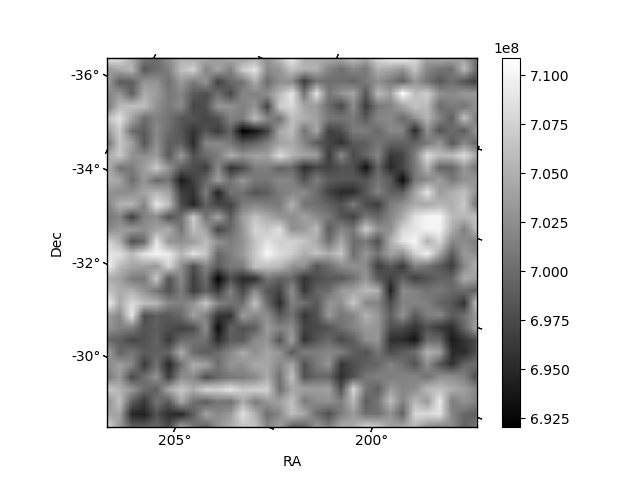
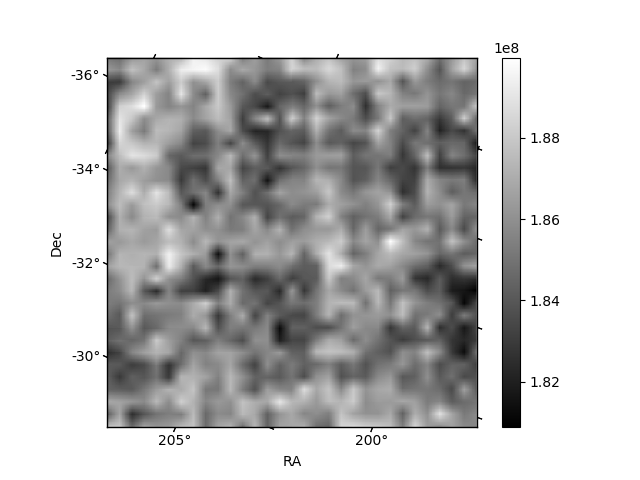
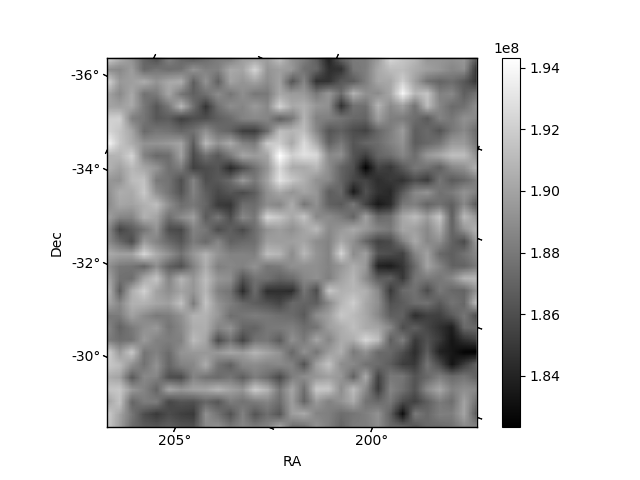
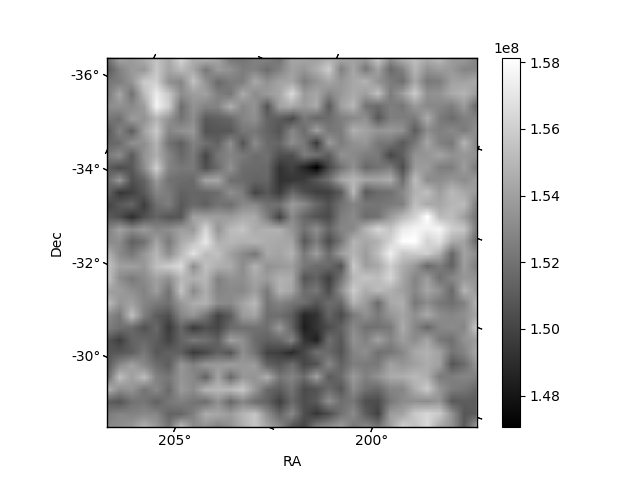
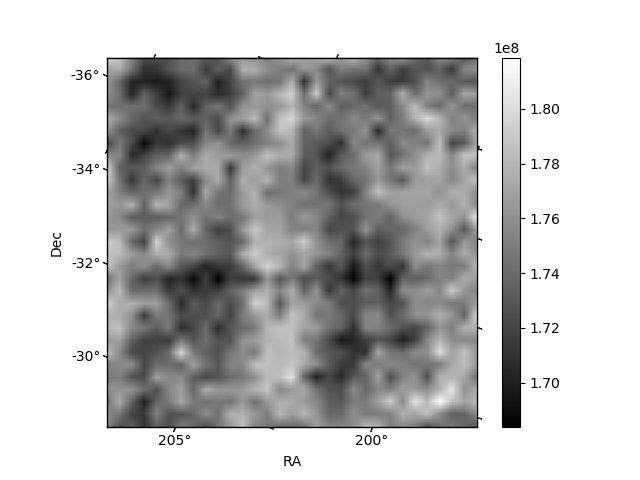
Histogram calculated using DETX and DETY for each event in the final _common_clean file
| Quadrant A | 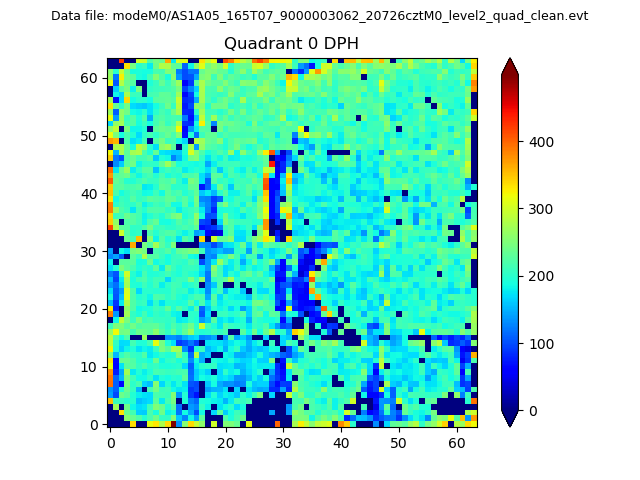 |
 |
Quadrant B |
|---|---|---|---|
| Quadrant D | 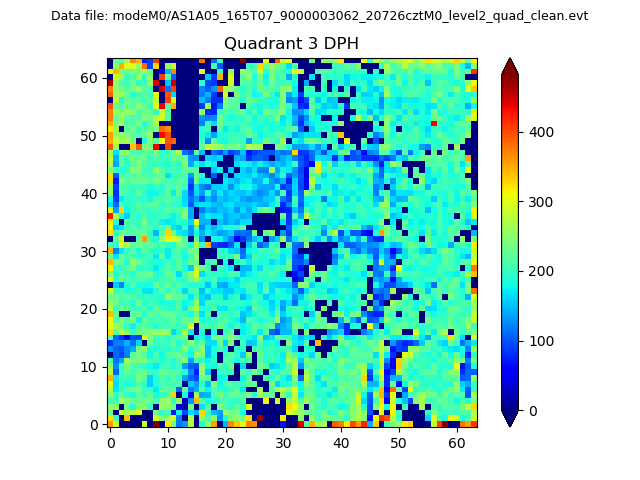 |
 |
Quadrant C |
| Plot type | Count rate plots | Images |
|---|---|---|
| Comparison with Poisson distribution Blue bars denote a histogram of data divided into 1 sec bins. Red curve is a Poisson curve with rate = median count rate of data. |
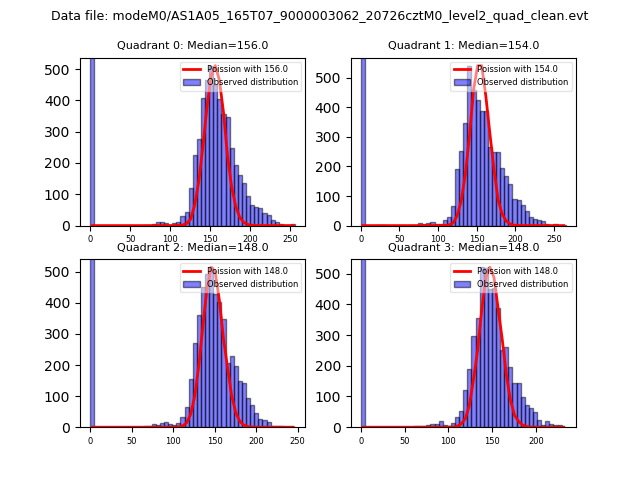 |
 |
| Quadrant-wise count rates Data is divided into 100 sec bins |
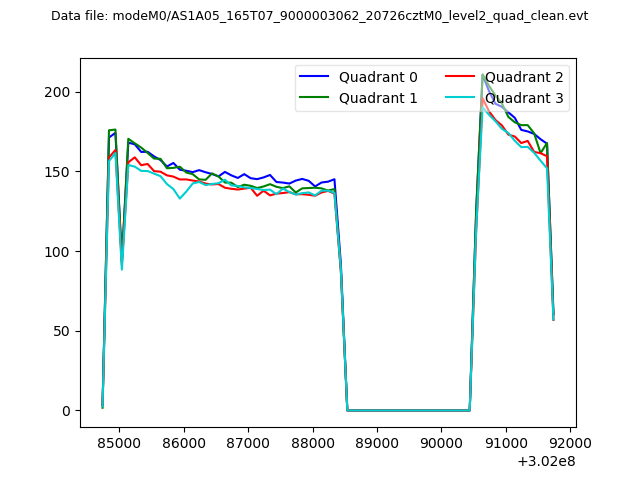 |
|
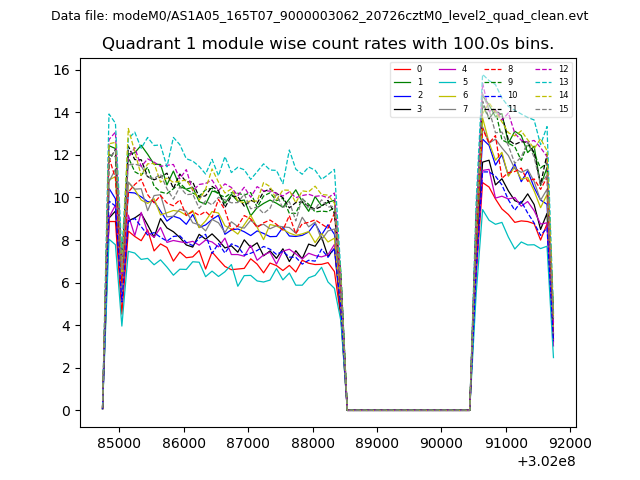
| Module-wise count rates for Quadrant A Data is divided into 100 sec bins |
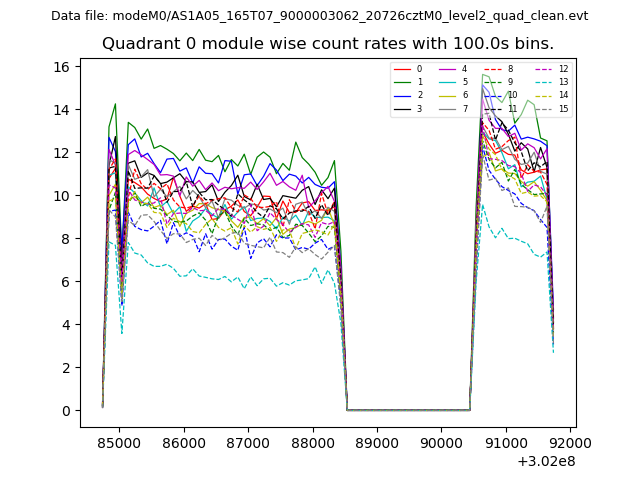 |
 |
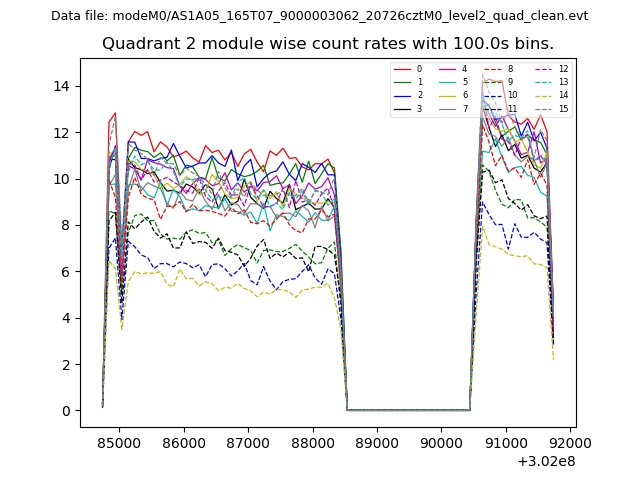
| Module-wise count rates for Quadrant B Data is divided into 100 sec bins |
 |
 |
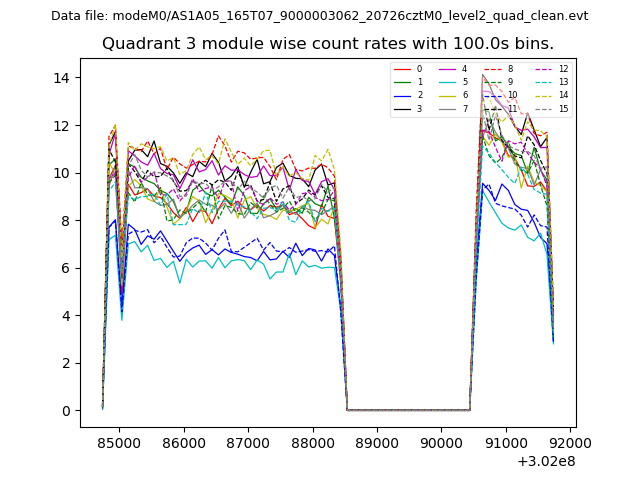
| Module-wise count rates for Quadrant C Data is divided into 100 sec bins |
 |
 |
| Module-wise count rates for Quadrant D Data is divided into 100 sec bins |
 |
 |
| Parameter | Plot |
|---|---|
| CZT HV Monitor | 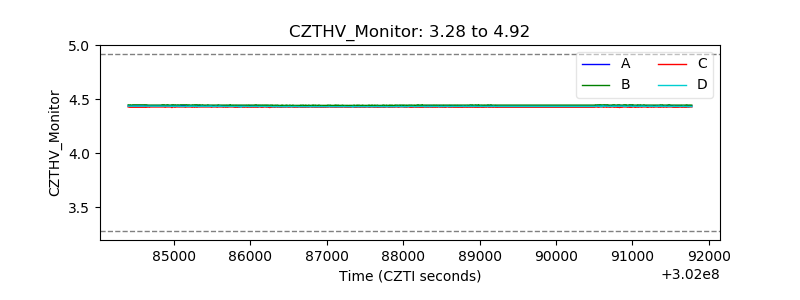 |
| D_VDD | 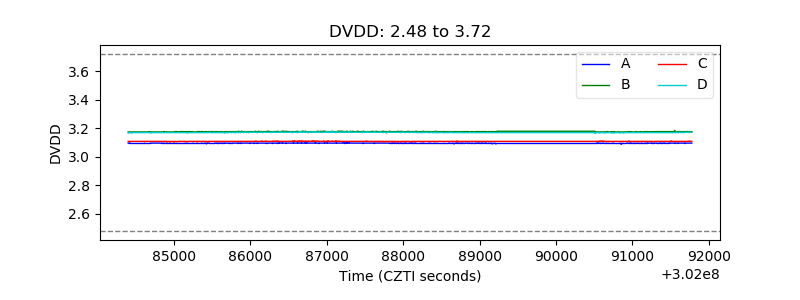 |
| Temperature 1 | 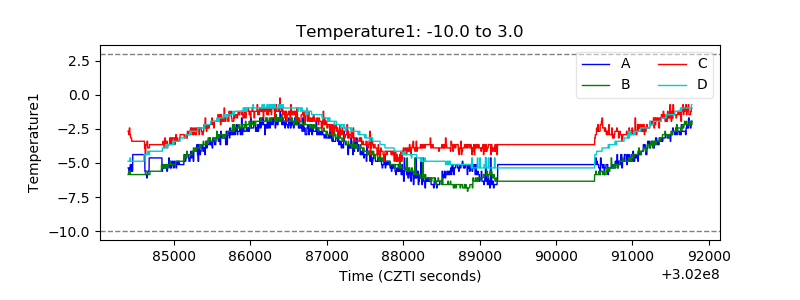 |
| Veto HV Monitor | 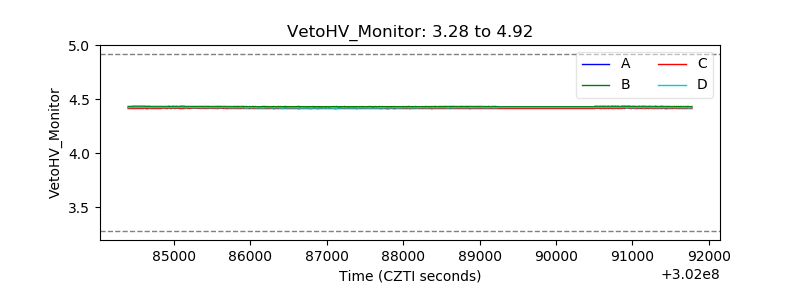 |
| Veto LLD | 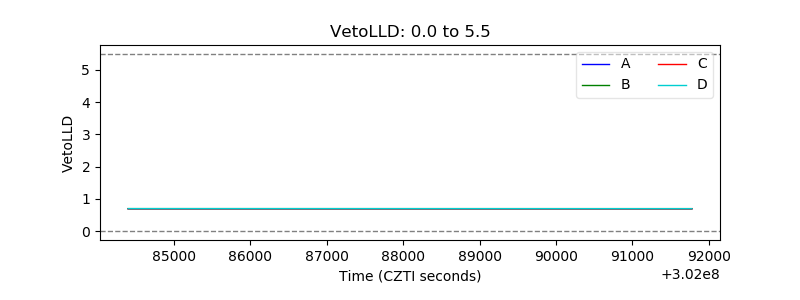 |
| Alpha Counter | 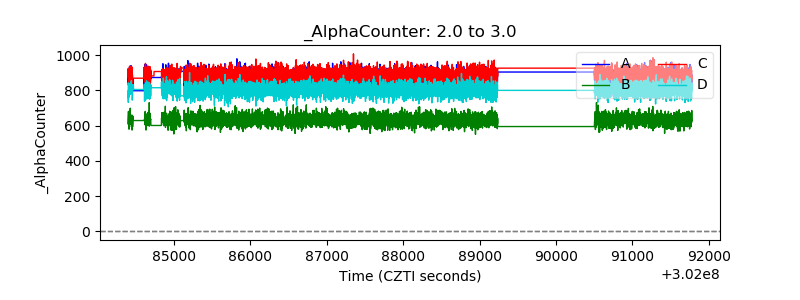 |
| _CPM_Rate | 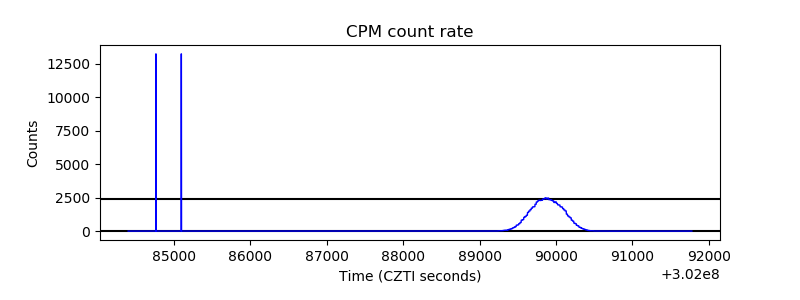 |
| CZT Counter | 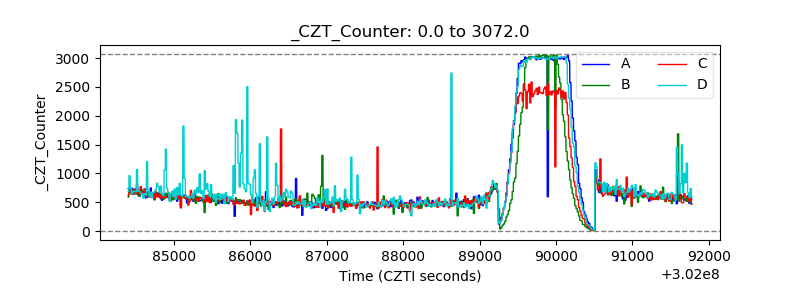 |
| +2.5 Volts monitor |  |
| +5 Volts monitor | 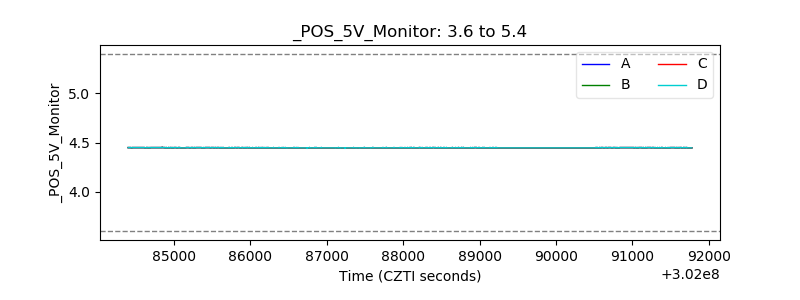 |
| _ROLL_ROT | 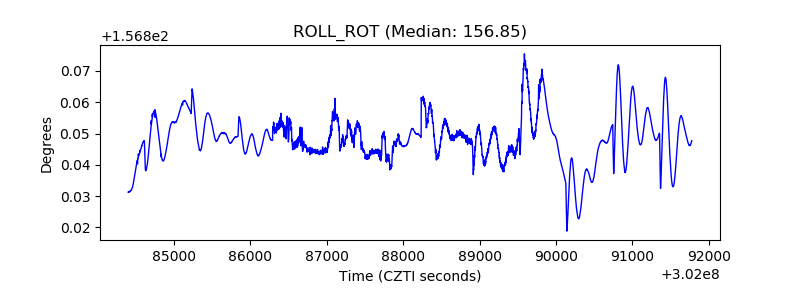 |
| _Roll_DEC | 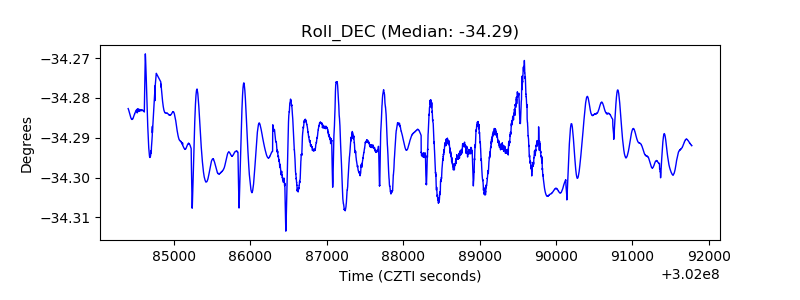 |
| _Roll_RA | 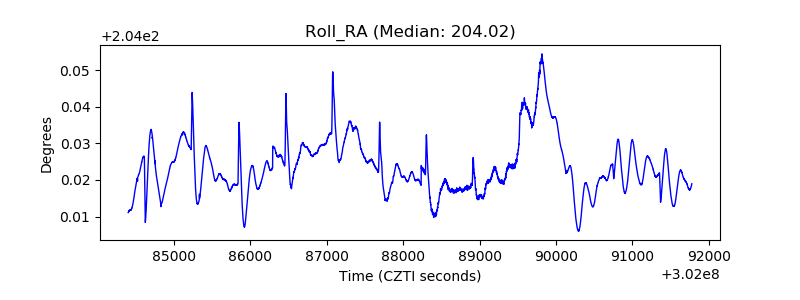 |
| Veto Counter | 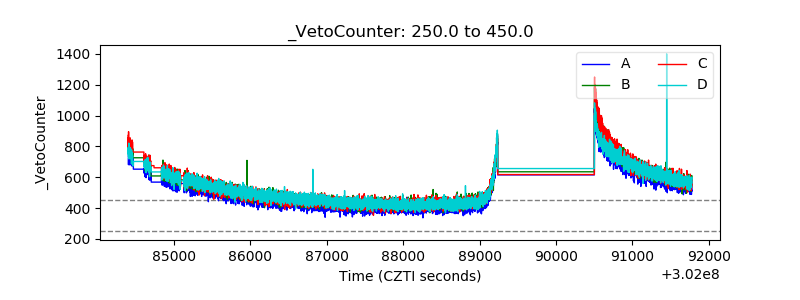 |