| Param | Original file | Final file |
|---|---|---|
| Filename | modeM0/AS1A05_165T07_9000003062_20727cztM0_level2.evt | modeM0/AS1A05_165T07_9000003062_20727cztM0_level2_quad_clean.evt |
| Size (bytes) | 507,939,840 | 117,673,920 |
| Size | 484.4 MB | 112.2 MB |
| Events in quadrant A | 3,256,247 | 820,370 |
| Events in quadrant B | 3,620,163 | 801,846 |
| Events in quadrant C | 3,348,182 | 764,165 |
| Events in quadrant D | 4,745,850 | 752,747 |
| Mode SS | |||
|---|---|---|---|
| Quadrant | BADHDUFLAG | Total packets | Discarded packets |
| A | 0 | 124 | 0 |
| B | 0 | 124 | 0 |
| C | 0 | 124 | 0 |
| D | 0 | 124 | 0 |
| Mode M0 | |||
|---|---|---|---|
| Quadrant | BADHDUFLAG | Total packets | Discarded packets |
| A | 0 | 13481 | 1 |
| B | 0 | 14628 | 1 |
| C | 0 | 13859 | 1 |
| D | 0 | 18434 | 1 |
| Mode M9 | |||
|---|---|---|---|
| Quadrant | BADHDUFLAG | Total packets | Discarded packets |
| A | 0 | 13 | 0 |
| B | 0 | 13 | 0 |
| C | 0 | 13 | 0 |
| D | 0 | 13 | 0 |
| Quadrant | Total seconds | Saturated seconds | Saturation percentage |
|---|---|---|---|
| A | 6083 | 100 | 1.643926% |
| B | 6084 | 162 | 2.662722% |
| C | 6084 | 124 | 2.038133% |
| D | 6084 | 206 | 3.385930% |
Noise dominated data is calculated using 1-second bins in cleaned event files. If a bin has >2000 counts, and if more than 50% of those come from <1% of pixels, then it is considered to be noise-dominated and hence unusable.
| Quadrant | # 1 sec bins | Bins with >0 counts | Bins with >2000 counts | High rate bins dominated by noise | Noise dominated (total time) | Noise dominated (detector-on time) | Marked lightcurve |
|---|---|---|---|---|---|---|---|
| A | 7403 | 6083 | 0 | 0 | 0.00% | 0.00% |  |
| B | 7404 | 6085 | 51 | 51 | 0.69% | 0.84% |  |
| C | 7404 | 6084 | 0 | 0 | 0.00% | 0.00% |  |
| D | 7404 | 6084 | 86 | 86 | 1.16% | 1.41% |  |
Top three noisy pixels from each quadrant. If the there are fewer than three noisy pixels in the level2.evt file, extra rows are filled as -1
| Pixel properties | Quadrant properties | ||||||
|---|---|---|---|---|---|---|---|
| Quadrant | DetID | PixID | Counts | Sigma | Mean | Median | Sigma |
| A | 0 | 226 | 7716 | 41.38 | 844 | 829 | 166.4 |
| A | 8 | 205 | 6606 | 34.71 | 844 | 829 | 166.4 |
| A | 3 | 137 | 6186 | 32.18 | 844 | 829 | 166.4 |
| B | 7 | 220 | 273987 | 1802.58 | 813 | 797 | 151.6 |
| B | 3 | 64 | 62412 | 406.55 | 813 | 797 | 151.6 |
| B | 0 | 229 | 31934 | 205.45 | 813 | 797 | 151.6 |
| C | 8 | 208 | 126992 | 702.48 | 783 | 790 | 179.7 |
| C | 14 | 238 | 125512 | 694.24 | 783 | 790 | 179.7 |
| C | 3 | 233 | 21994 | 118.03 | 783 | 790 | 179.7 |
| D | 1 | 52 | 709515 | 3670.5 | 810 | 788 | 193.1 |
| D | 1 | 20 | 688588 | 3562.12 | 810 | 788 | 193.1 |
| D | 1 | 239 | 80455 | 412.6 | 810 | 788 | 193.1 |
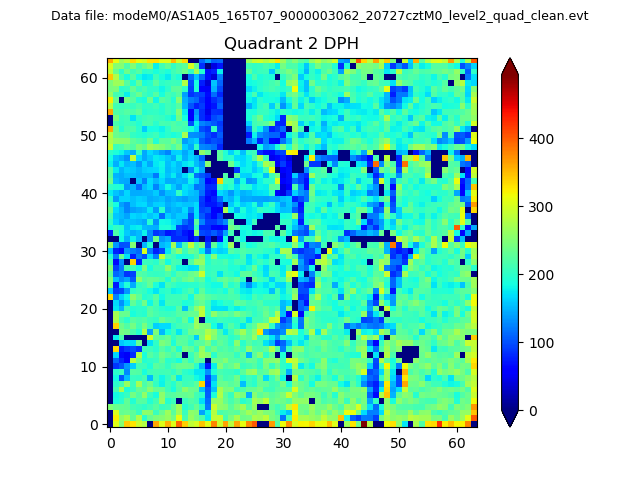
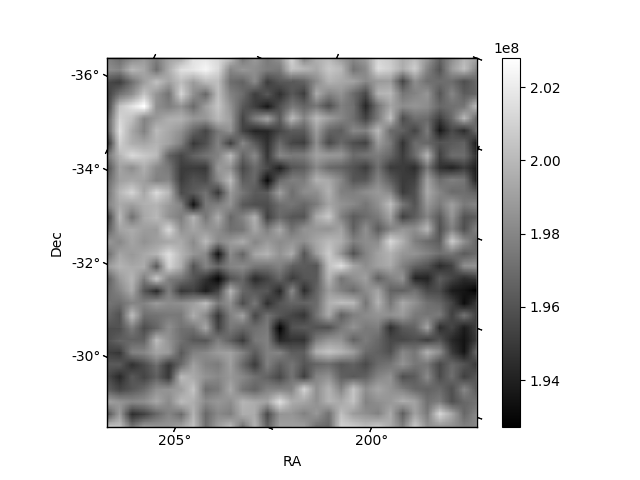
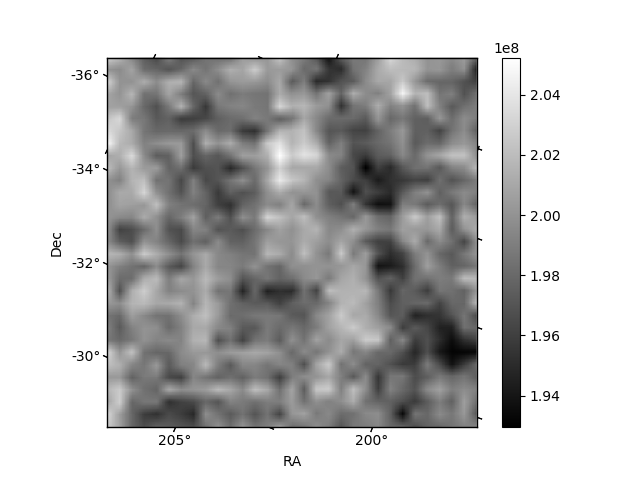
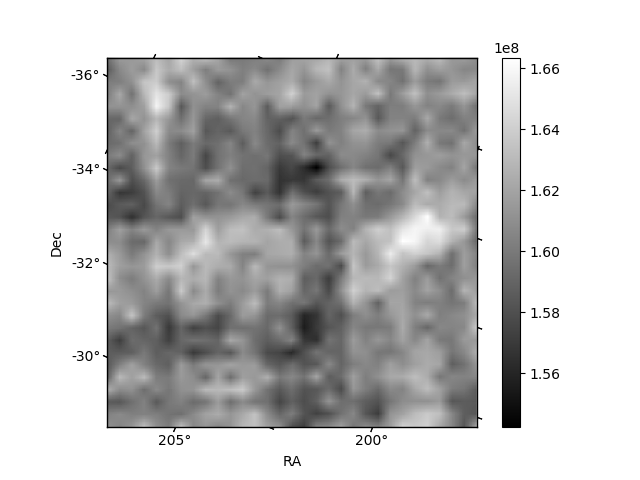
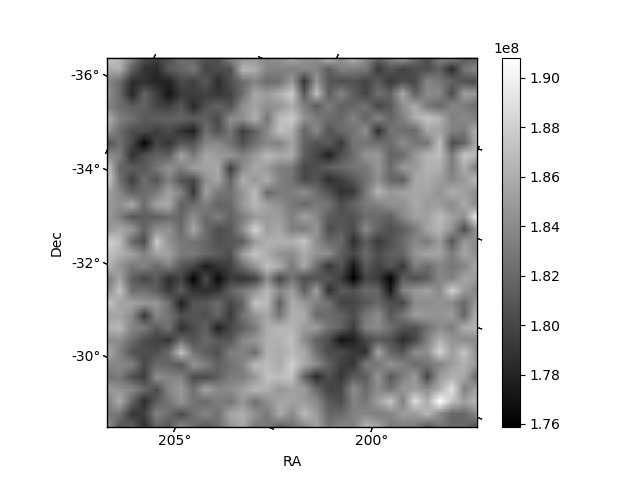
Histogram calculated using DETX and DETY for each event in the final _common_clean file
| Quadrant A | 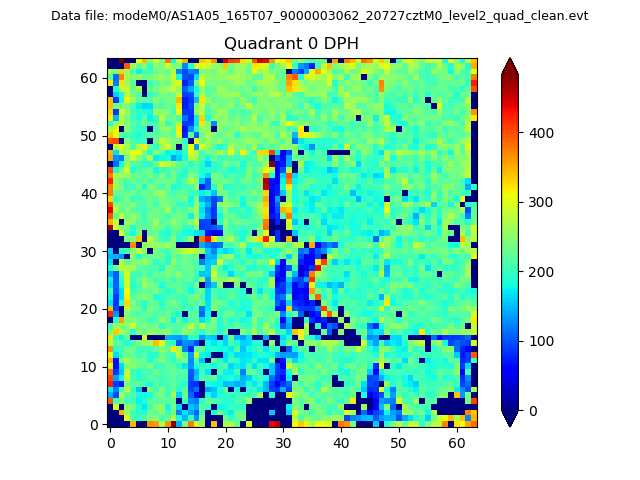 |
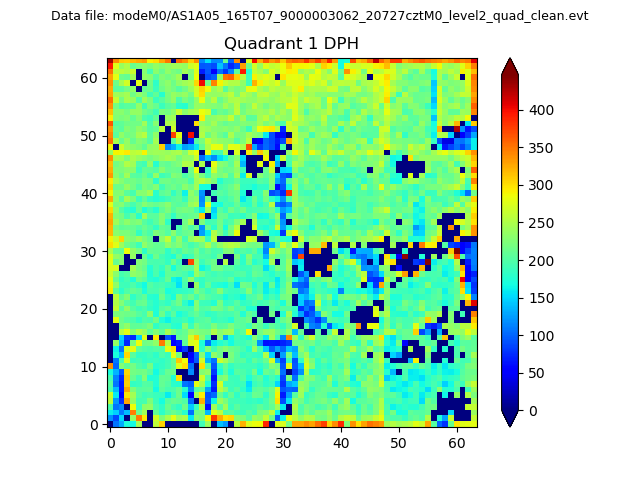 |
Quadrant B |
|---|---|---|---|
| Quadrant D | 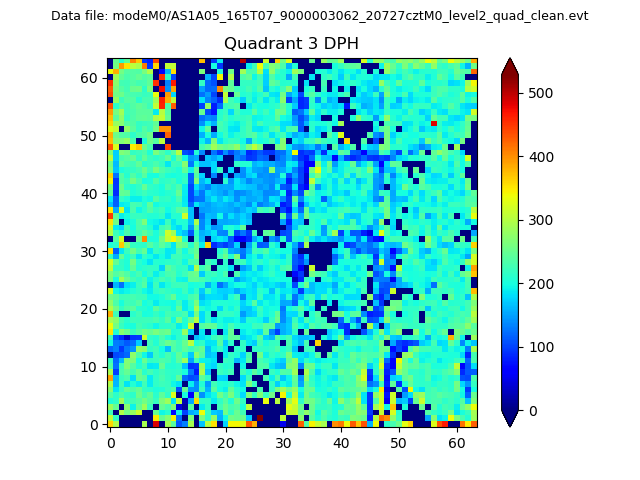 |
 |
Quadrant C |
| Plot type | Count rate plots | Images |
|---|---|---|
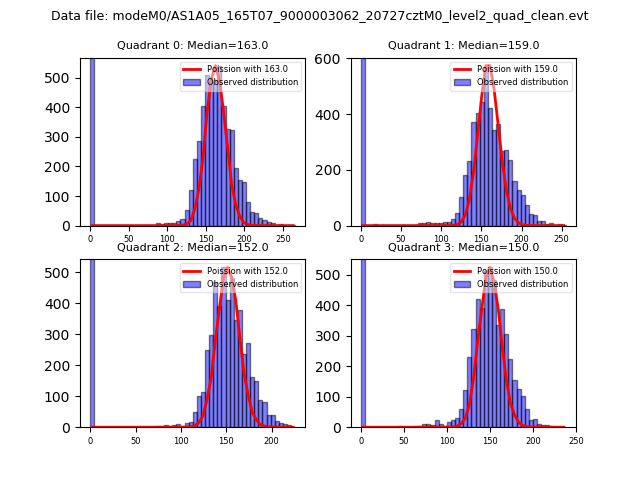
| Comparison with Poisson distribution Blue bars denote a histogram of data divided into 1 sec bins. Red curve is a Poisson curve with rate = median count rate of data. |
 |
 |
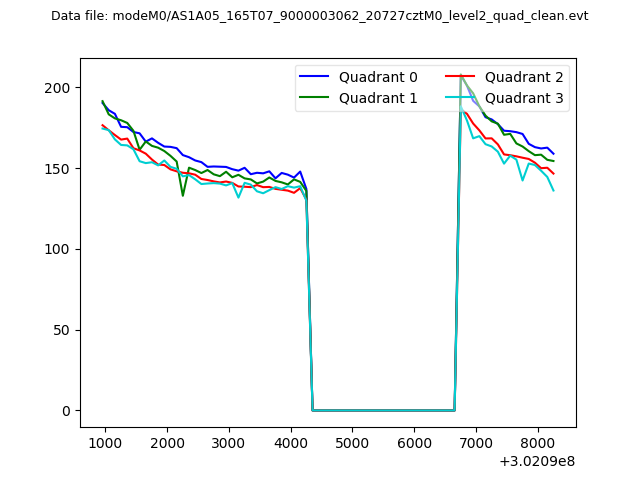
| Quadrant-wise count rates Data is divided into 100 sec bins |
 |
|
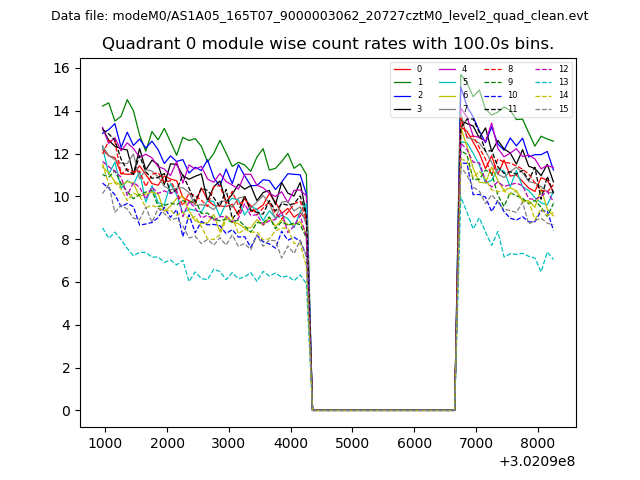
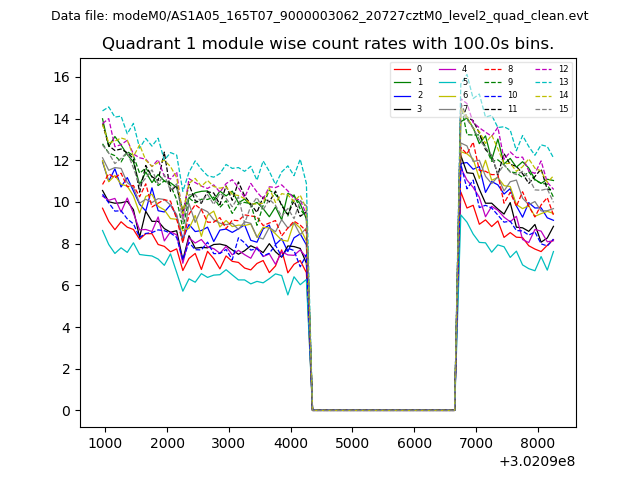
| Module-wise count rates for Quadrant A Data is divided into 100 sec bins |
 |
 |
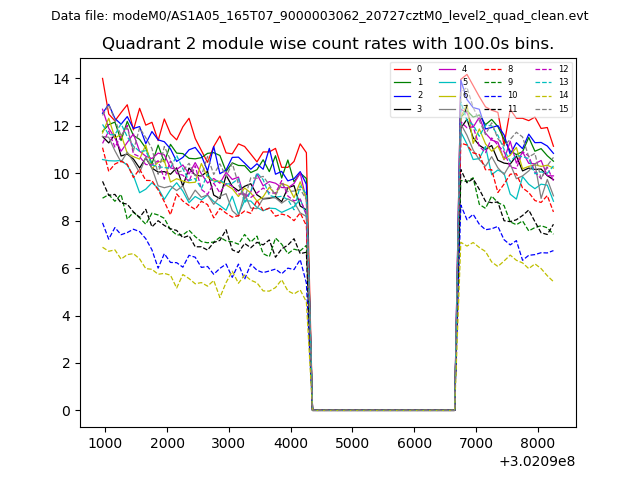
| Module-wise count rates for Quadrant B Data is divided into 100 sec bins |
 |
 |
| Module-wise count rates for Quadrant C Data is divided into 100 sec bins |
 |
 |
| Module-wise count rates for Quadrant D Data is divided into 100 sec bins |
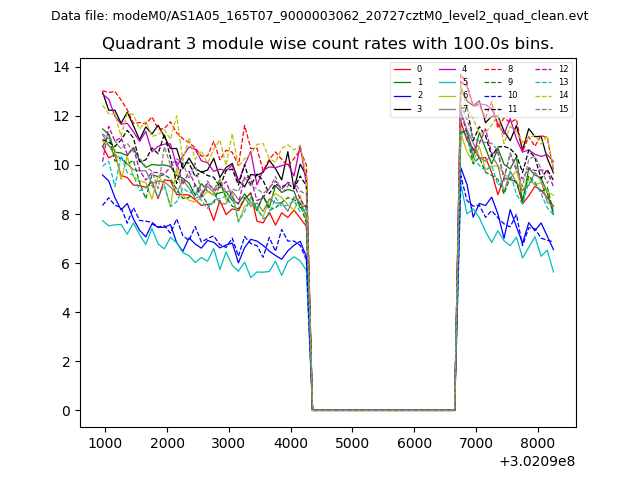 |
 |
| Parameter | Plot |
|---|---|
| CZT HV Monitor | 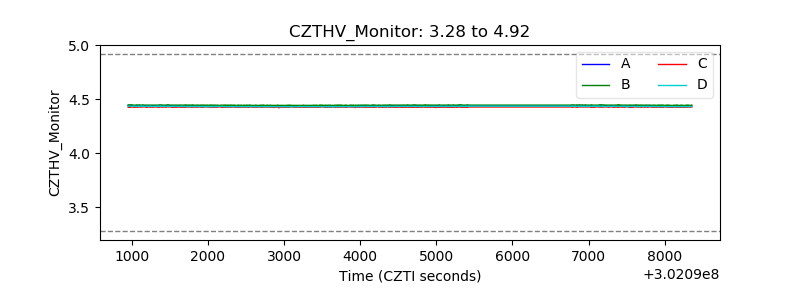 |
| D_VDD | 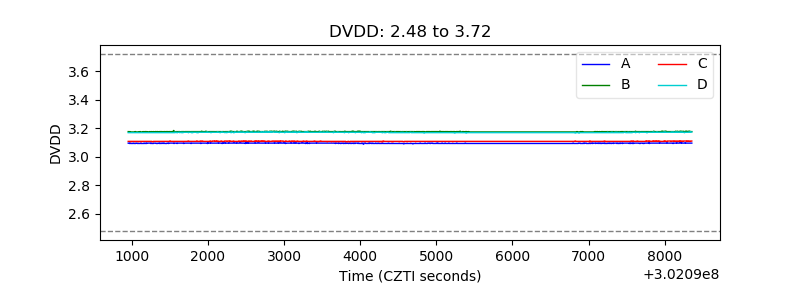 |
| Temperature 1 | 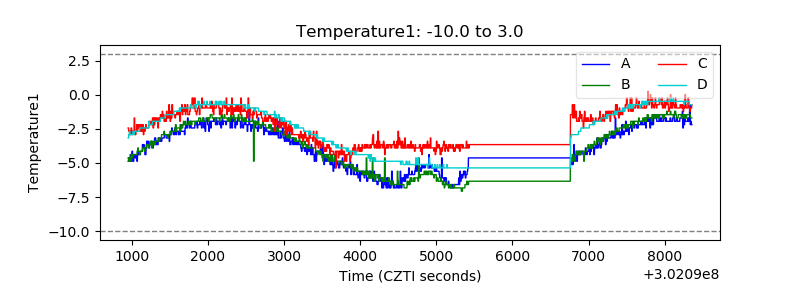 |
| Veto HV Monitor |  |
| Veto LLD | 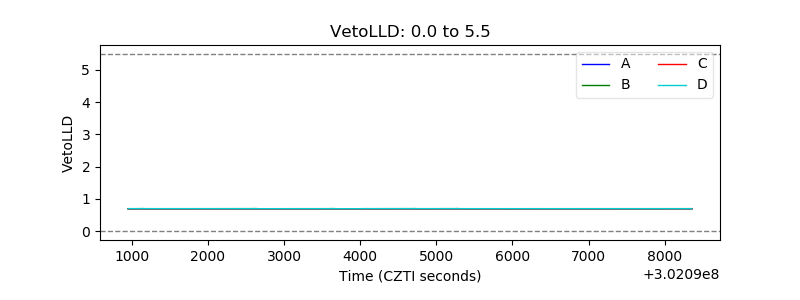 |
| Alpha Counter | 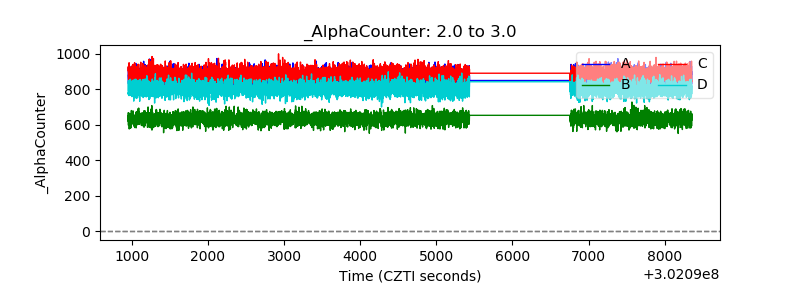 |
| _CPM_Rate | 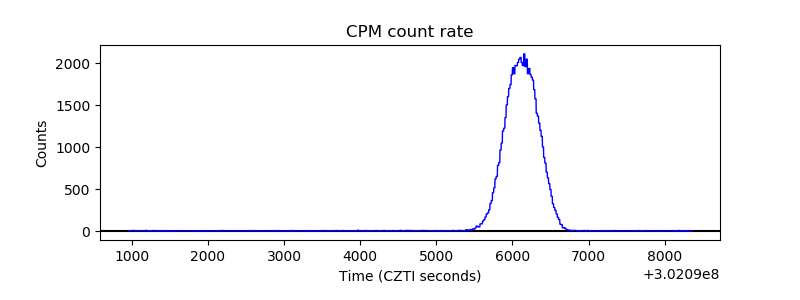 |
| CZT Counter | 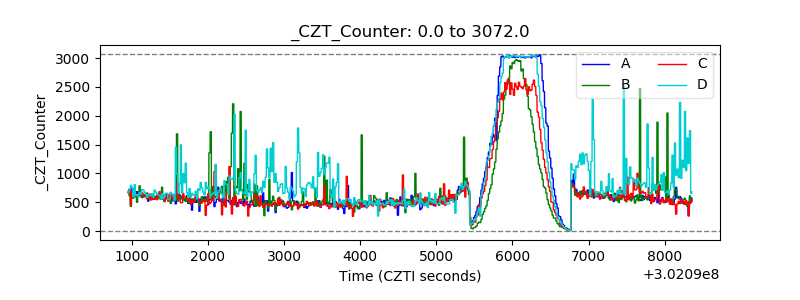 |
| +2.5 Volts monitor |  |
| +5 Volts monitor |  |
| _ROLL_ROT | 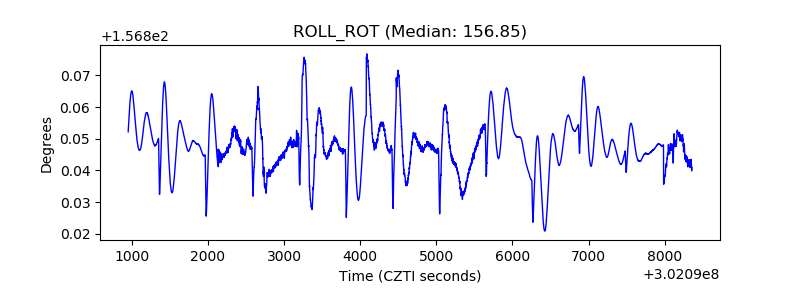 |
| _Roll_DEC | 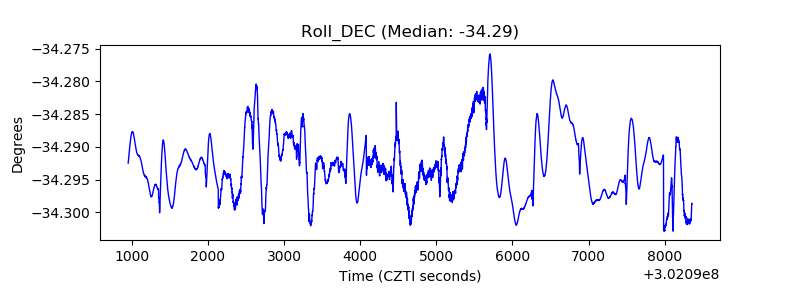 |
| _Roll_RA | 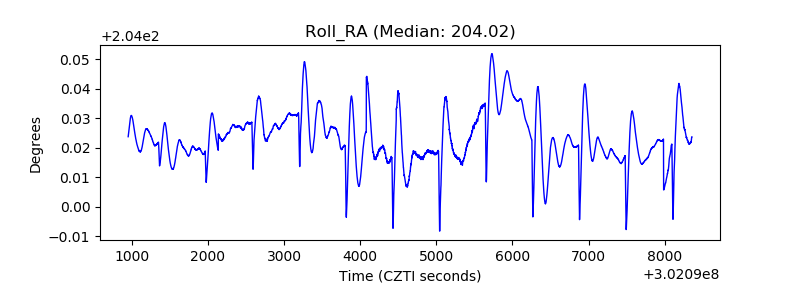 |
| Veto Counter | 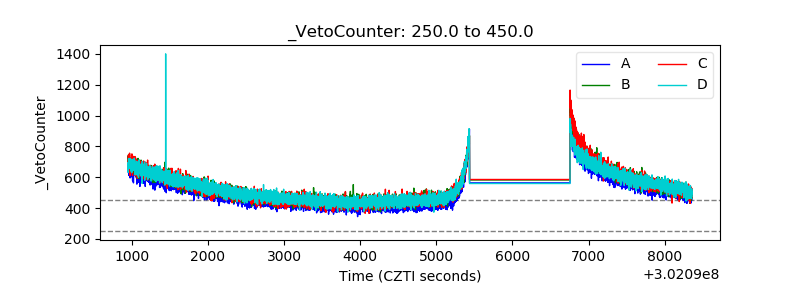 |