| Param | Original file | Final file |
|---|---|---|
| Filename | modeM0/AS1A05_165T07_9000003062_20728cztM0_level2.evt | modeM0/AS1A05_165T07_9000003062_20728cztM0_level2_quad_clean.evt |
| Size (bytes) | 512,441,280 | 99,679,680 |
| Size | 488.7 MB | 95.1 MB |
| Events in quadrant A | 3,039,304 | 690,316 |
| Events in quadrant B | 3,292,935 | 671,601 |
| Events in quadrant C | 3,044,716 | 640,556 |
| Events in quadrant D | 5,744,664 | 606,267 |
| Mode SS | |||
|---|---|---|---|
| Quadrant | BADHDUFLAG | Total packets | Discarded packets |
| A | 0 | 120 | 0 |
| B | 0 | 120 | 0 |
| C | 0 | 120 | 0 |
| D | 0 | 120 | 0 |
| Mode M0 | |||
|---|---|---|---|
| Quadrant | BADHDUFLAG | Total packets | Discarded packets |
| A | 0 | 12569 | 2 |
| B | 0 | 13475 | 2 |
| C | 0 | 12644 | 2 |
| D | 0 | 21188 | 2 |
| Mode M9 | |||
|---|---|---|---|
| Quadrant | BADHDUFLAG | Total packets | Discarded packets |
| A | 0 | 13 | 0 |
| B | 0 | 13 | 0 |
| C | 0 | 13 | 0 |
| D | 0 | 13 | 0 |
| Quadrant | Total seconds | Saturated seconds | Saturation percentage |
|---|---|---|---|
| A | 5863 | 80 | 1.364489% |
| B | 5864 | 110 | 1.875853% |
| C | 5864 | 99 | 1.688267% |
| D | 5864 | 588 | 10.027285% |
Noise dominated data is calculated using 1-second bins in cleaned event files. If a bin has >2000 counts, and if more than 50% of those come from <1% of pixels, then it is considered to be noise-dominated and hence unusable.
| Quadrant | # 1 sec bins | Bins with >0 counts | Bins with >2000 counts | High rate bins dominated by noise | Noise dominated (total time) | Noise dominated (detector-on time) | Marked lightcurve |
|---|---|---|---|---|---|---|---|
| A | 7203 | 5865 | 2 | 2 | 0.03% | 0.03% | 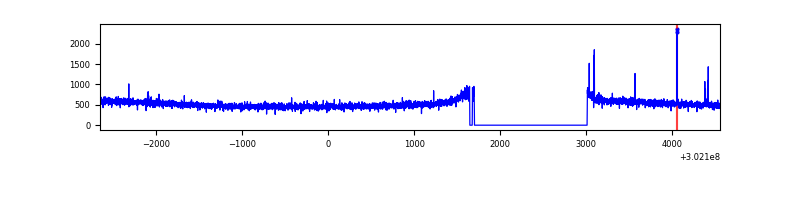 |
| B | 7204 | 5866 | 19 | 19 | 0.26% | 0.32% | 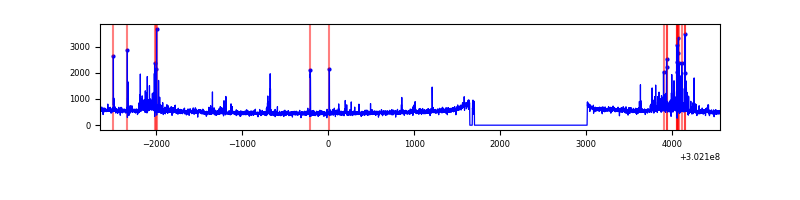 |
| C | 7204 | 5866 | 0 | 0 | 0.00% | 0.00% | 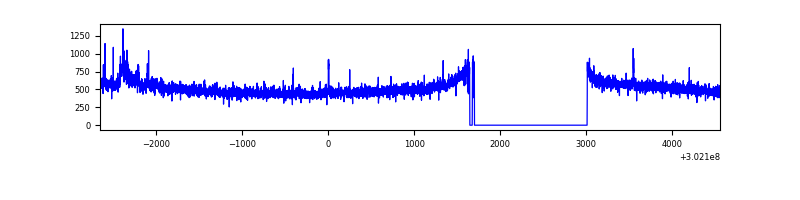 |
| D | 7204 | 5866 | 484 | 484 | 6.72% | 8.25% | 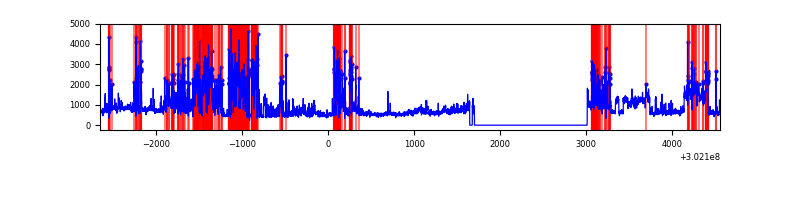 |
Top three noisy pixels from each quadrant. If the there are fewer than three noisy pixels in the level2.evt file, extra rows are filled as -1
| Pixel properties | Quadrant properties | ||||||
|---|---|---|---|---|---|---|---|
| Quadrant | DetID | PixID | Counts | Sigma | Mean | Median | Sigma |
| A | 6 | 240 | 20129 | 124.08 | 783 | 771 | 156.0 |
| A | 0 | 226 | 7001 | 39.93 | 783 | 771 | 156.0 |
| A | 3 | 137 | 5861 | 32.63 | 783 | 771 | 156.0 |
| B | 7 | 220 | 187797 | 1308.45 | 760 | 744 | 143.0 |
| B | 0 | 190 | 32021 | 218.78 | 760 | 744 | 143.0 |
| B | 3 | 64 | 25484 | 173.06 | 760 | 744 | 143.0 |
| C | 14 | 238 | 115994 | 690.91 | 725 | 732 | 166.8 |
| C | 8 | 208 | 63573 | 376.68 | 725 | 732 | 166.8 |
| C | 3 | 233 | 34800 | 204.21 | 725 | 732 | 166.8 |
| D | 1 | 52 | 1491650 | 8537.62 | 732 | 713 | 174.6 |
| D | 1 | 20 | 1081662 | 6189.89 | 732 | 713 | 174.6 |
| D | 7 | 38 | 237098 | 1353.62 | 732 | 713 | 174.6 |
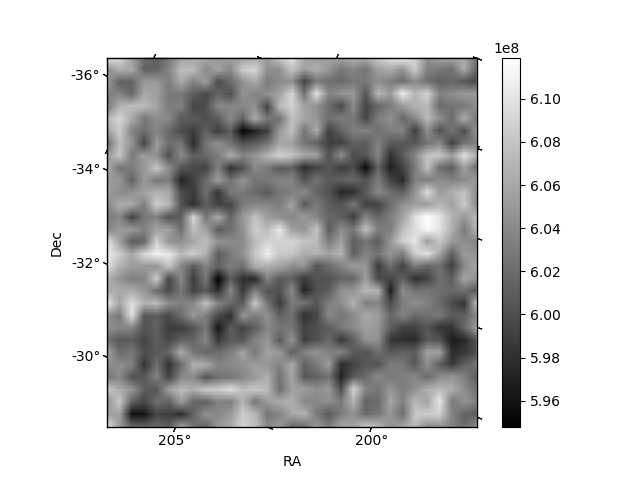
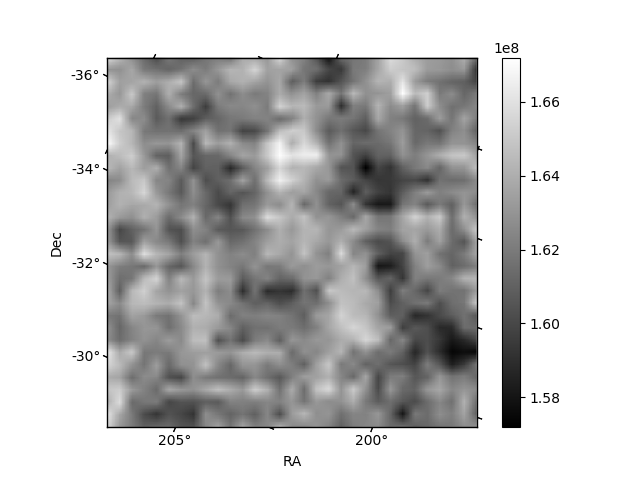
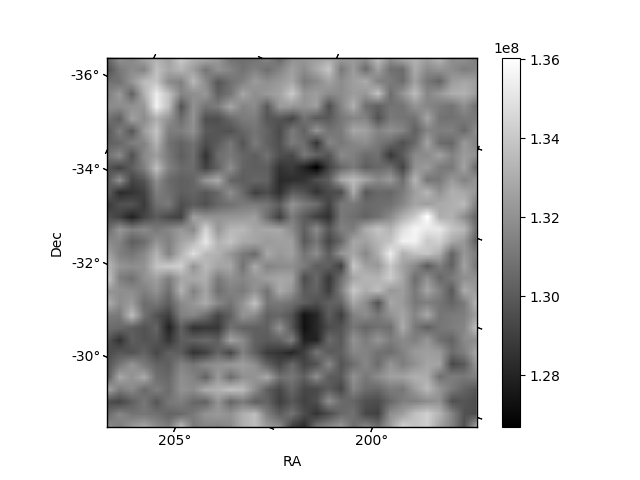
Histogram calculated using DETX and DETY for each event in the final _common_clean file
| Quadrant A | 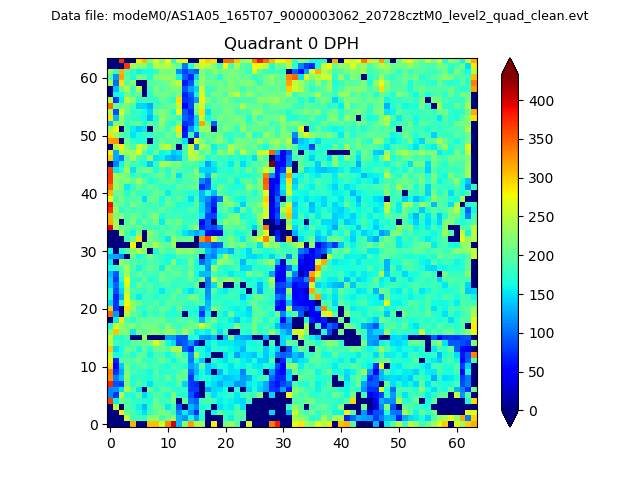 |
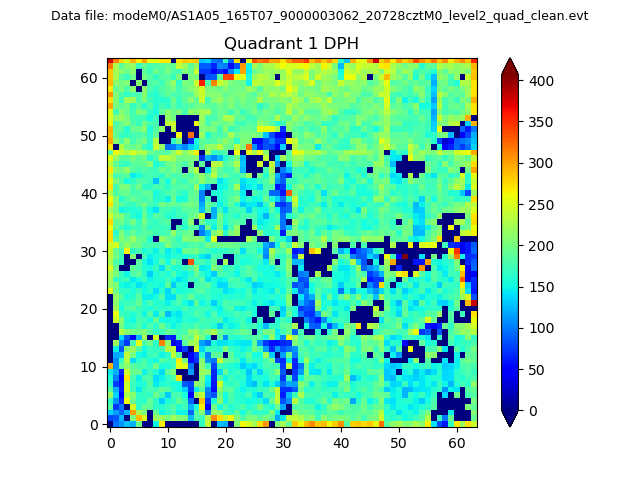 |
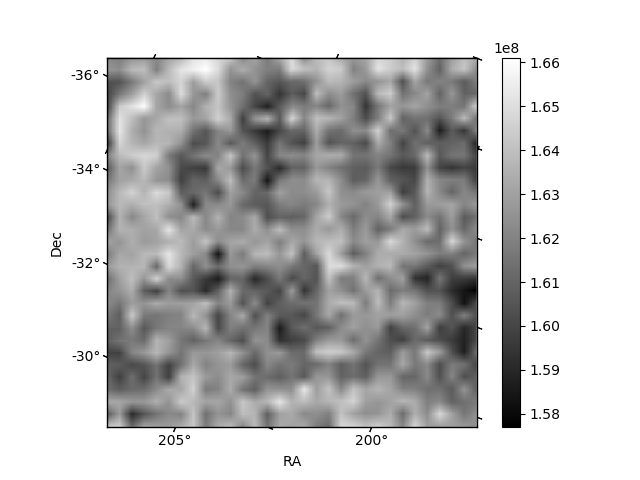
Quadrant B |
|---|---|---|---|
| Quadrant D |  |
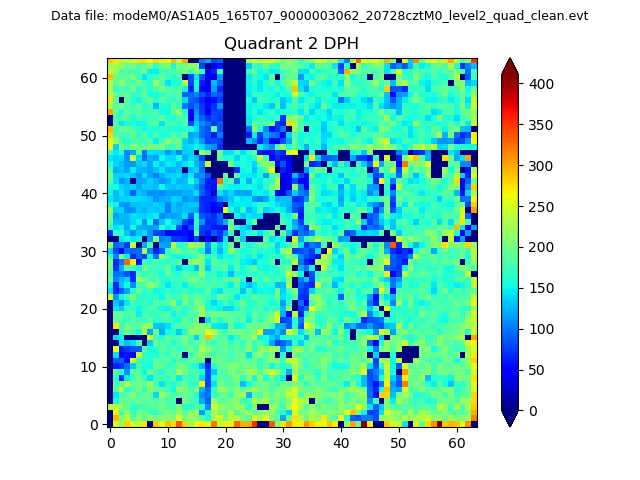 |
Quadrant C |
| Plot type | Count rate plots | Images |
|---|---|---|
| Comparison with Poisson distribution Blue bars denote a histogram of data divided into 1 sec bins. Red curve is a Poisson curve with rate = median count rate of data. |
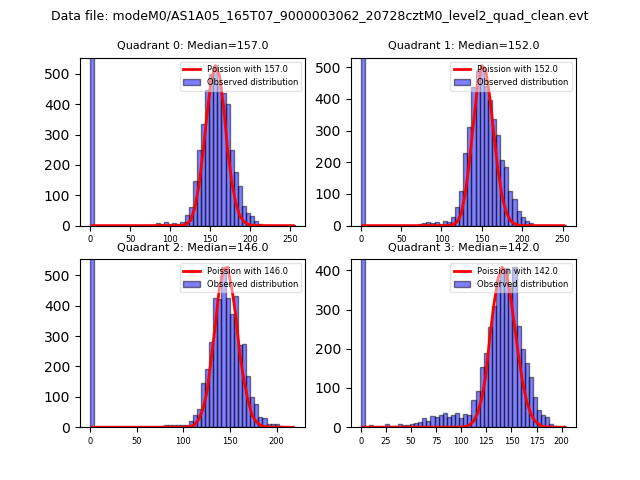 |
 |
| Quadrant-wise count rates Data is divided into 100 sec bins |
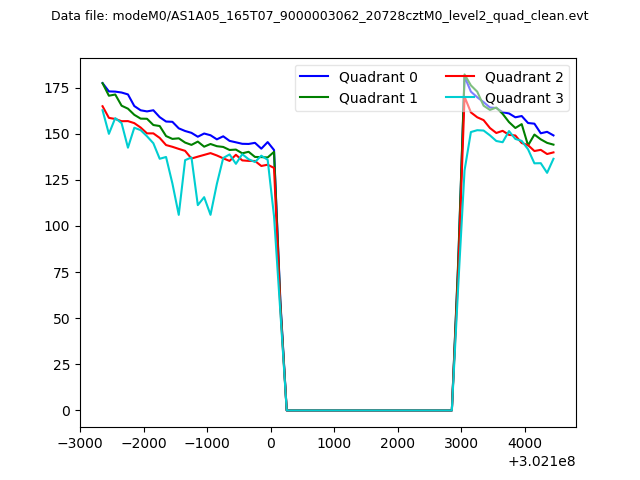 |
|
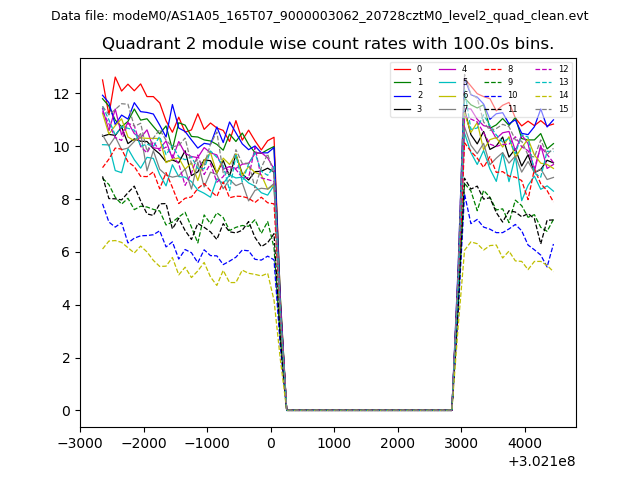
| Module-wise count rates for Quadrant A Data is divided into 100 sec bins |
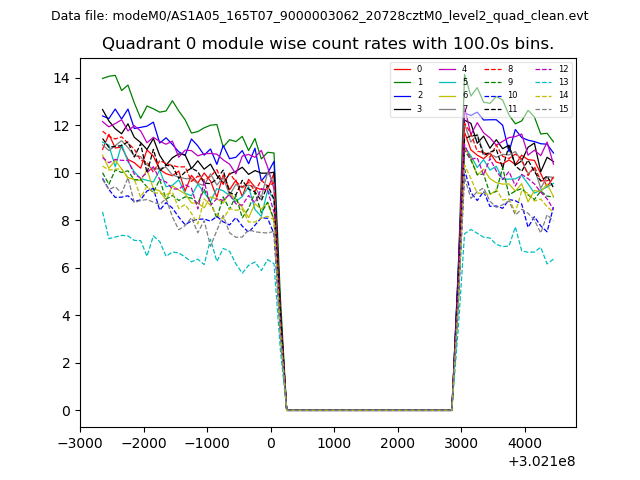 |
 |
| Module-wise count rates for Quadrant B Data is divided into 100 sec bins |
 |
 |
| Module-wise count rates for Quadrant C Data is divided into 100 sec bins |
 |
 |
| Module-wise count rates for Quadrant D Data is divided into 100 sec bins |
 |
 |
| Parameter | Plot |
|---|---|
| CZT HV Monitor | 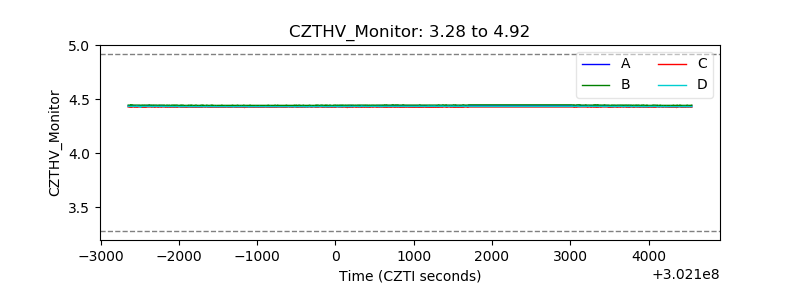 |
| D_VDD | 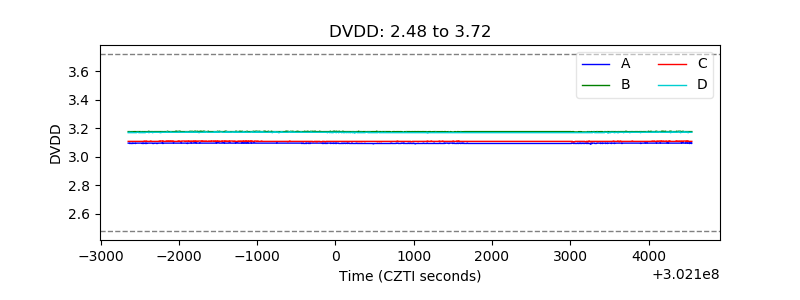 |
| Temperature 1 | 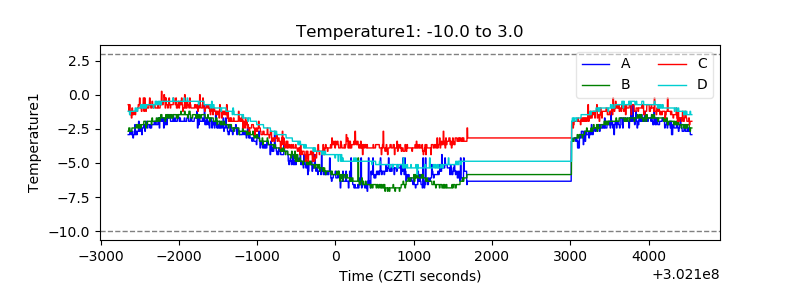 |
| Veto HV Monitor | 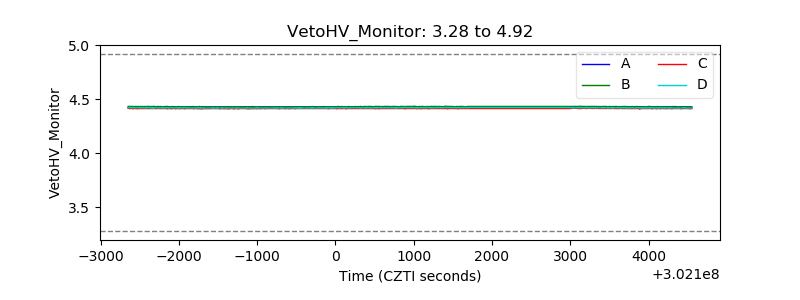 |
| Veto LLD | 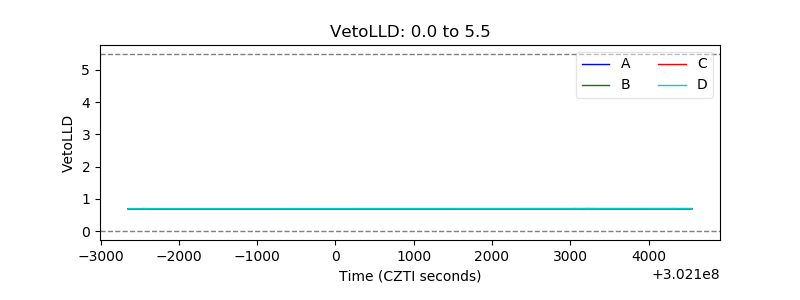 |
| Alpha Counter | 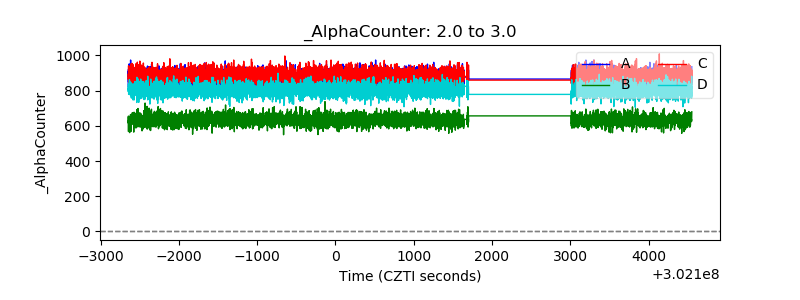 |
| _CPM_Rate | 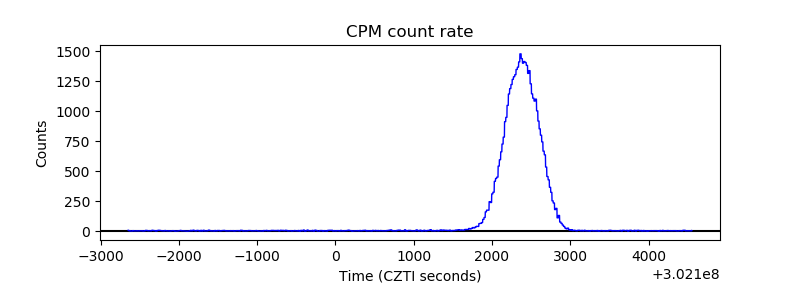 |
| CZT Counter | 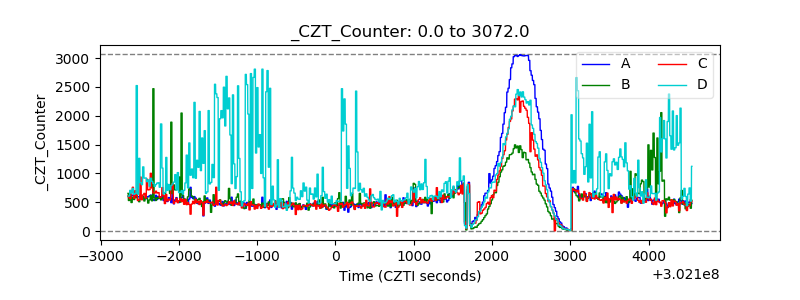 |
| +2.5 Volts monitor | 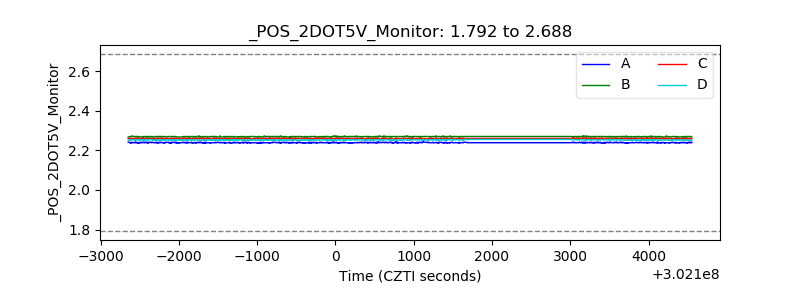 |
| +5 Volts monitor | 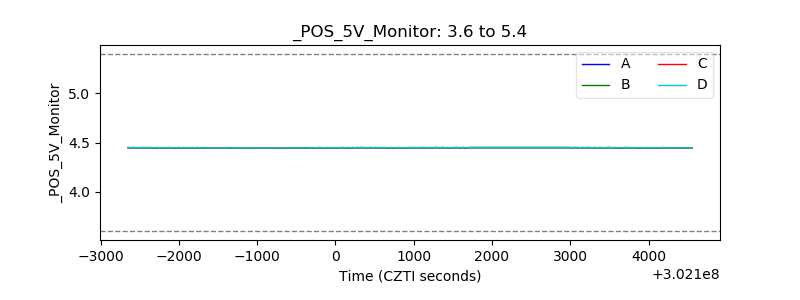 |
| _ROLL_ROT | 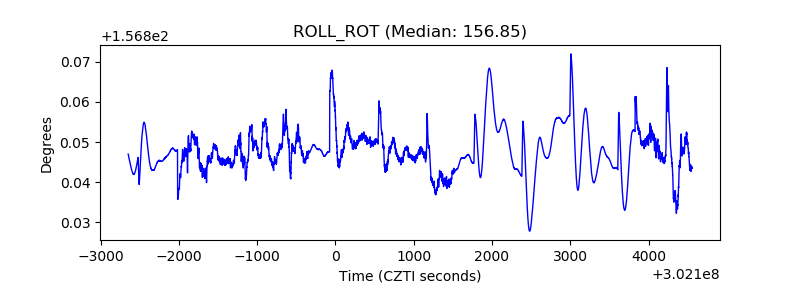 |
| _Roll_DEC | 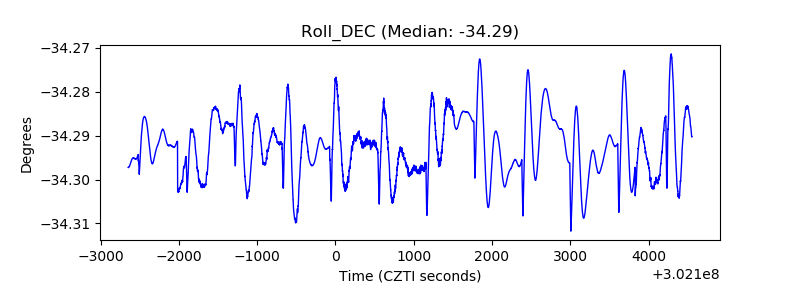 |
| _Roll_RA | 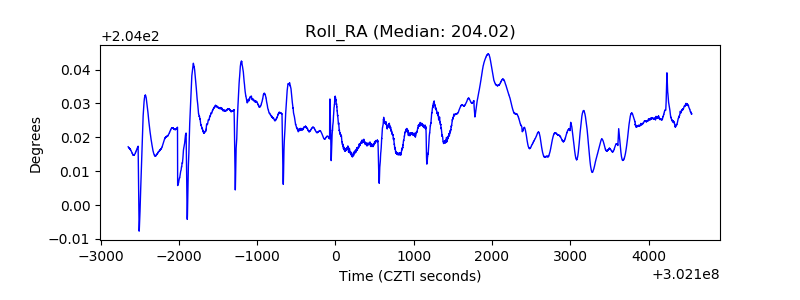 |
| Veto Counter | 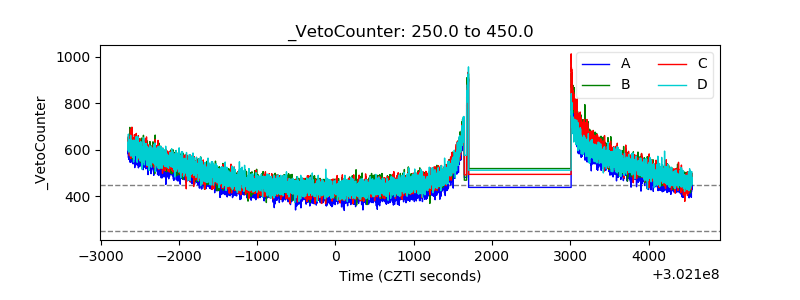 |