| Param | Original file | Final file |
|---|---|---|
| Filename | modeM0/AS1A05_165T07_9000003062_20730cztM0_level2.evt | modeM0/AS1A05_165T07_9000003062_20730cztM0_level2_quad_clean.evt |
| Size (bytes) | 75,692,160 | 18,264,960 |
| Size | 72.2 MB | 17.4 MB |
| Events in quadrant A | 454,680 | 132,526 |
| Events in quadrant B | 509,370 | 123,711 |
| Events in quadrant C | 429,550 | 122,735 |
| Events in quadrant D | 834,878 | 103,909 |
| Mode SS | |||
|---|---|---|---|
| Quadrant | BADHDUFLAG | Total packets | Discarded packets |
| A | 0 | 28 | 8 |
| B | 0 | 28 | 12 |
| C | 0 | 28 | 14 |
| D | 0 | 28 | 8 |
| Mode M0 | |||
|---|---|---|---|
| Quadrant | BADHDUFLAG | Total packets | Discarded packets |
| A | 0 | 2886 | 977 |
| B | 0 | 3372 | 1293 |
| C | 0 | 2829 | 979 |
| D | 0 | 6032 | 2951 |
| Quadrant | Total seconds | Saturated seconds | Saturation percentage |
|---|---|---|---|
| A | 935 | 0 | 0.000000% |
| B | 899 | 8 | 0.889878% |
| C | 922 | 3 | 0.325380% |
| D | 824 | 121 | 14.684466% |
Noise dominated data is calculated using 1-second bins in cleaned event files. If a bin has >2000 counts, and if more than 50% of those come from <1% of pixels, then it is considered to be noise-dominated and hence unusable.
| Quadrant | # 1 sec bins | Bins with >0 counts | Bins with >2000 counts | High rate bins dominated by noise | Noise dominated (total time) | Noise dominated (detector-on time) | Marked lightcurve |
|---|---|---|---|---|---|---|---|
| A | 1304 | 1067 | 0 | 0 | 0.00% | 0.00% | 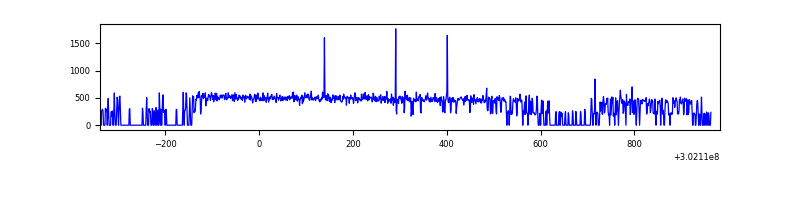 |
| B | 1289 | 1005 | 7 | 7 | 0.54% | 0.70% | 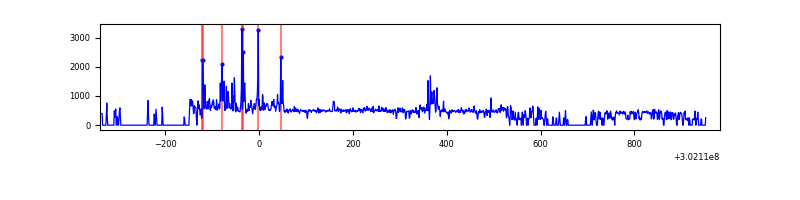 |
| C | 1320 | 1045 | 0 | 0 | 0.00% | 0.00% | 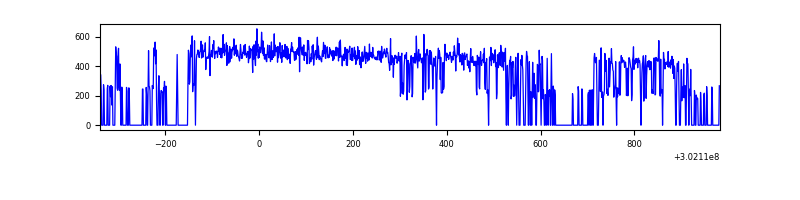 |
| D | 1287 | 921 | 109 | 109 | 8.47% | 11.83% | 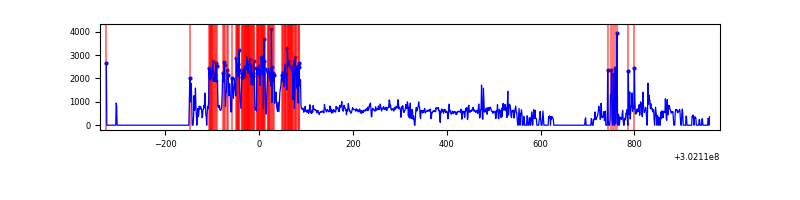 |
Top three noisy pixels from each quadrant. If the there are fewer than three noisy pixels in the level2.evt file, extra rows are filled as -1
| Pixel properties | Quadrant properties | ||||||
|---|---|---|---|---|---|---|---|
| Quadrant | DetID | PixID | Counts | Sigma | Mean | Median | Sigma |
| A | 6 | 240 | 7220 | 282.89 | 116 | 113 | 25.1 |
| A | 8 | 205 | 1265 | 45.86 | 116 | 113 | 25.1 |
| A | 0 | 226 | 1071 | 38.13 | 116 | 113 | 25.1 |
| B | 7 | 220 | 60157 | 2733.71 | 107 | 105 | 22.0 |
| B | 0 | 189 | 15633 | 706.87 | 107 | 105 | 22.0 |
| B | 0 | 197 | 9084 | 408.75 | 107 | 105 | 22.0 |
| C | 14 | 238 | 15894 | 611.53 | 104 | 105 | 25.8 |
| C | 3 | 233 | 4831 | 183.04 | 104 | 105 | 25.8 |
| C | 13 | 61 | 741 | 24.63 | 104 | 105 | 25.8 |
| D | 1 | 52 | 366231 | 15016.17 | 93 | 90 | 24.4 |
| D | 1 | 20 | 83813 | 3433.65 | 93 | 90 | 24.4 |
| D | 12 | 227 | 16132 | 657.91 | 93 | 90 | 24.4 |
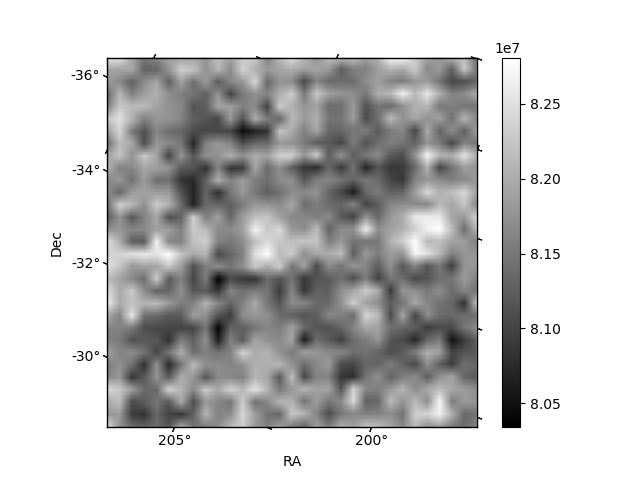
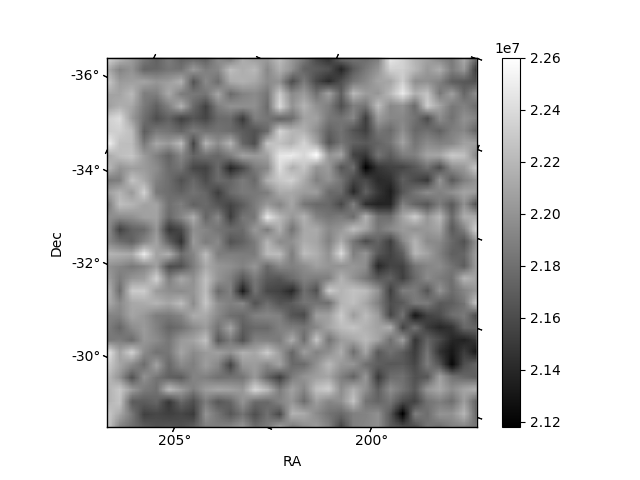
Histogram calculated using DETX and DETY for each event in the final _common_clean file
| Quadrant A | 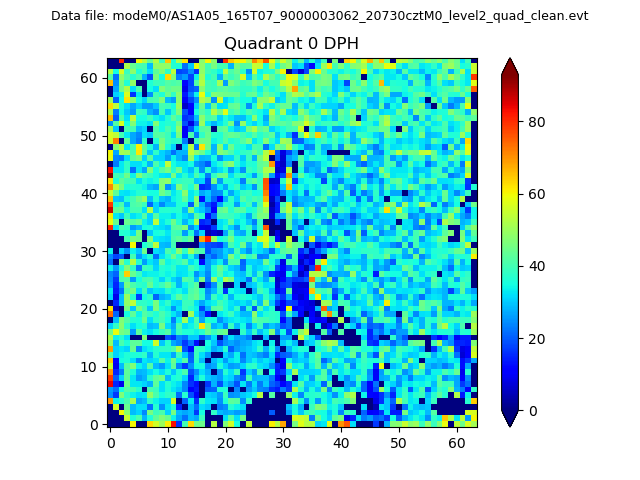 |
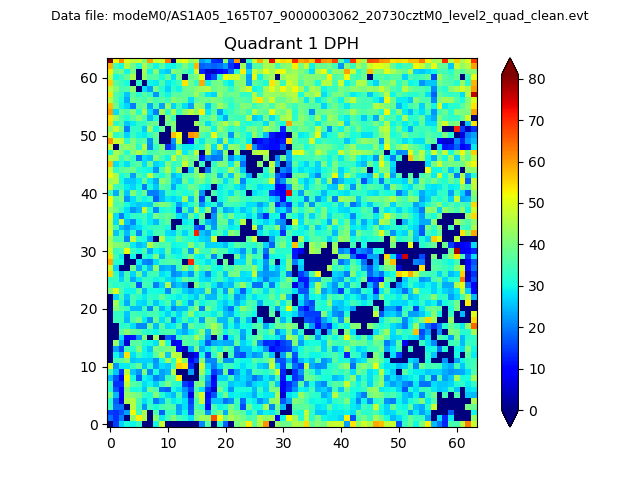 |
Quadrant B |
|---|---|---|---|
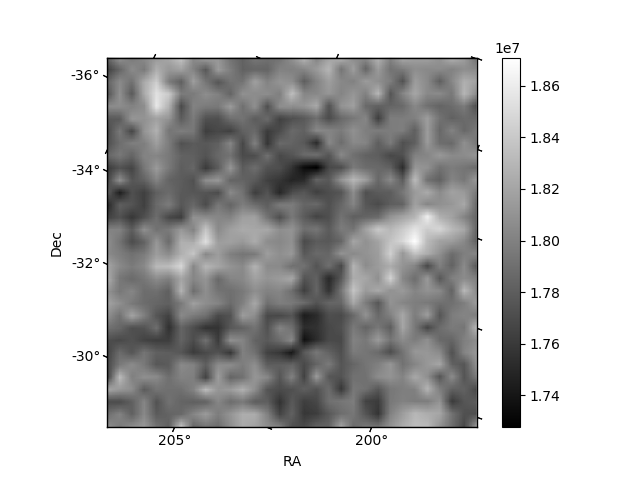
| Quadrant D |  |
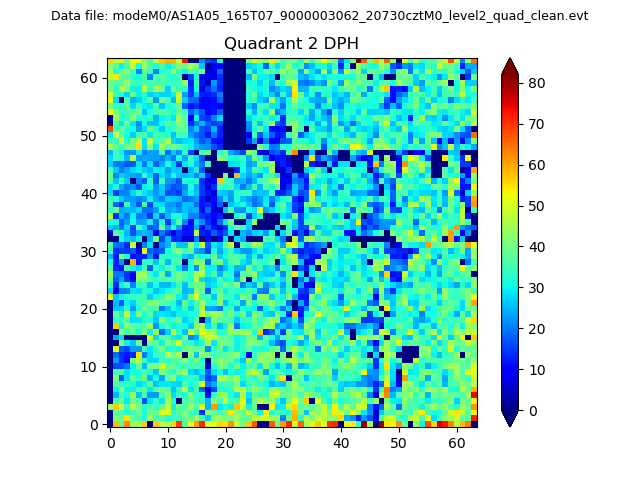 |
Quadrant C |
| Plot type | Count rate plots | Images |
|---|---|---|
| Comparison with Poisson distribution Blue bars denote a histogram of data divided into 1 sec bins. Red curve is a Poisson curve with rate = median count rate of data. |
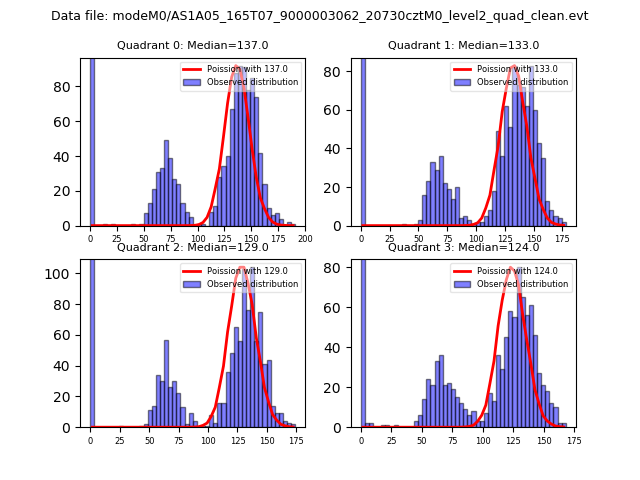 |
 |
| Quadrant-wise count rates Data is divided into 100 sec bins |
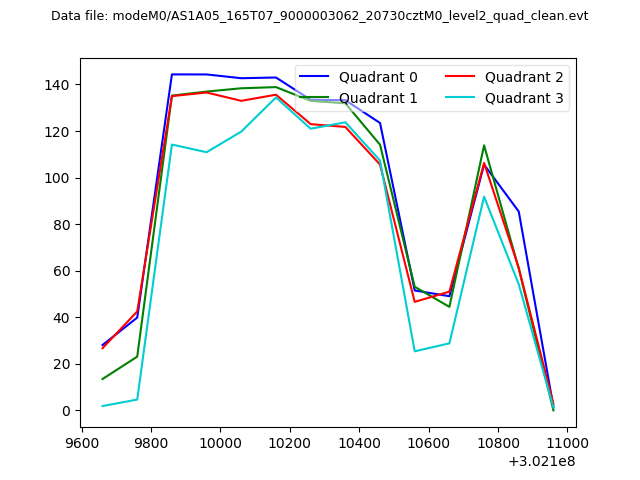 |
|
| Module-wise count rates for Quadrant A Data is divided into 100 sec bins |
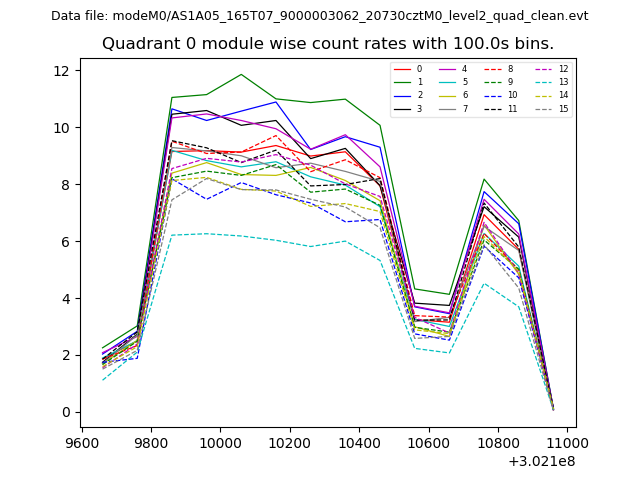 |
 |
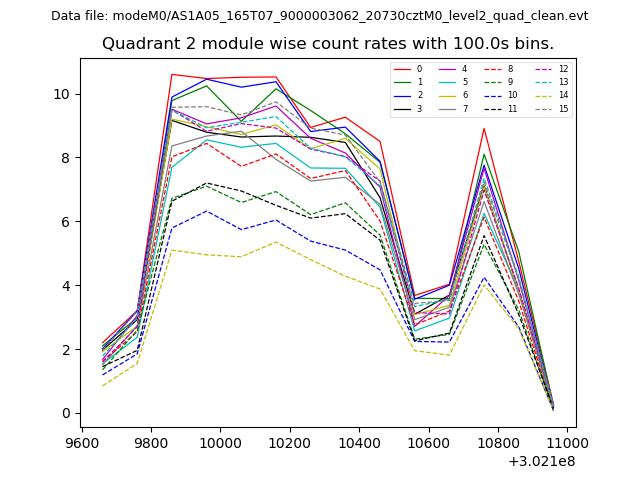
| Module-wise count rates for Quadrant B Data is divided into 100 sec bins |
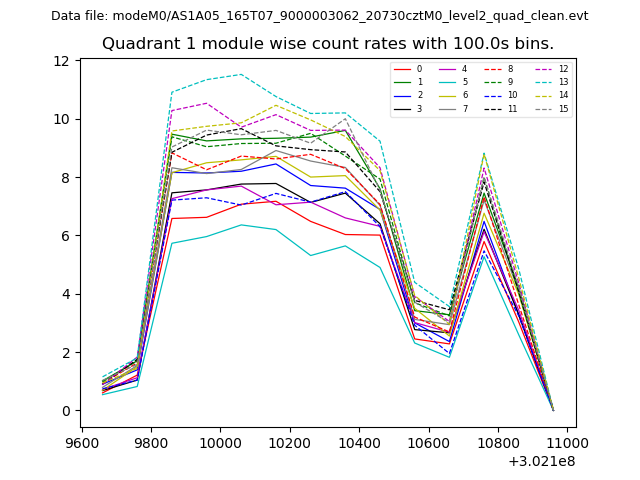 |
 |
| Module-wise count rates for Quadrant C Data is divided into 100 sec bins |
 |
 |
| Module-wise count rates for Quadrant D Data is divided into 100 sec bins |
 |
 |
| Parameter | Plot |
|---|---|
| CZT HV Monitor | 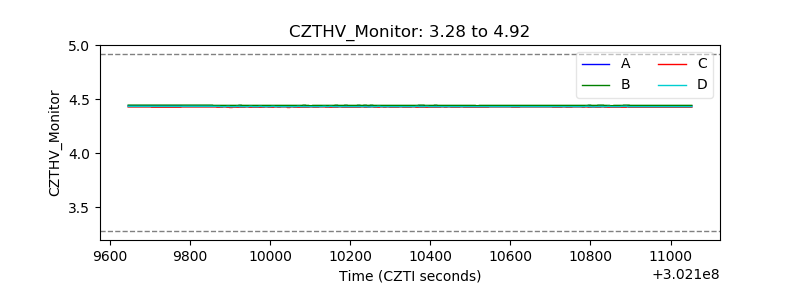 |
| D_VDD | 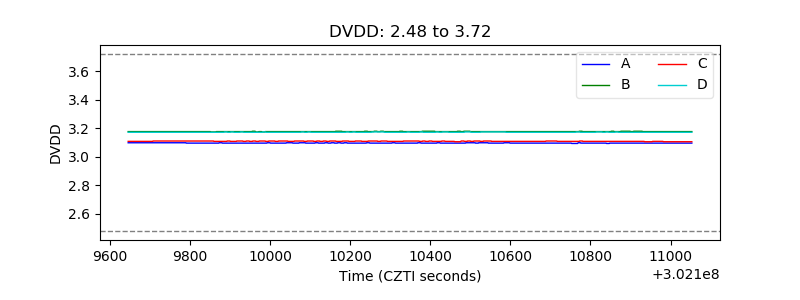 |
| Temperature 1 | 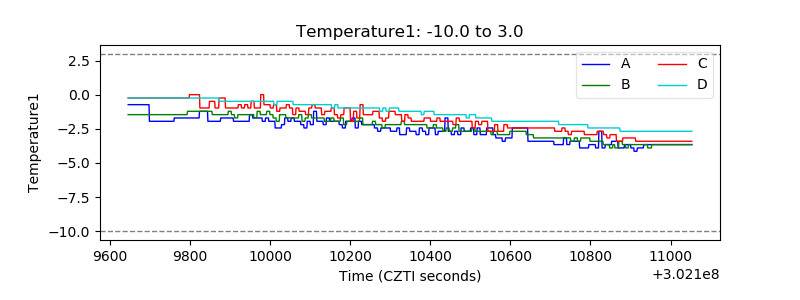 |
| Veto HV Monitor | 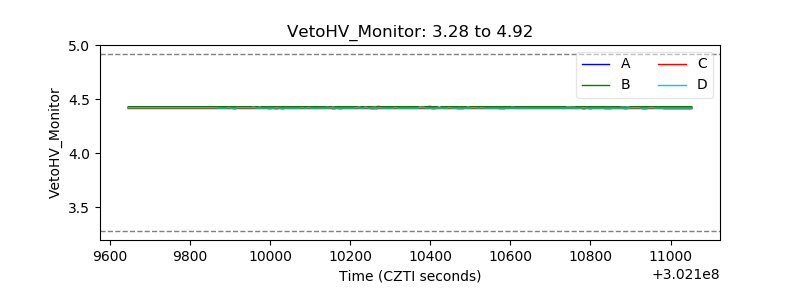 |
| Veto LLD | 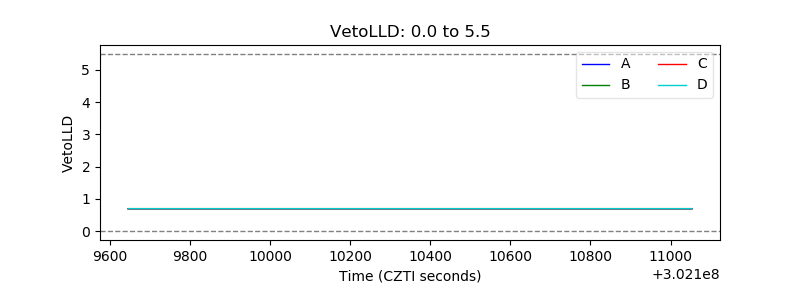 |
| Alpha Counter | 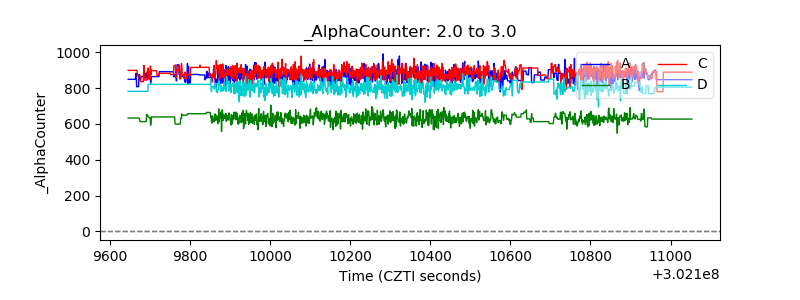 |
| _CPM_Rate | 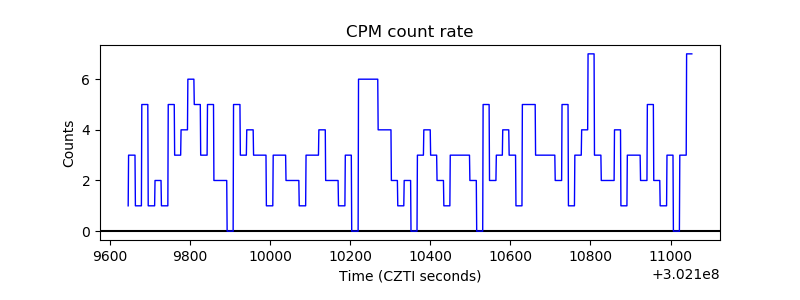 |
| CZT Counter | 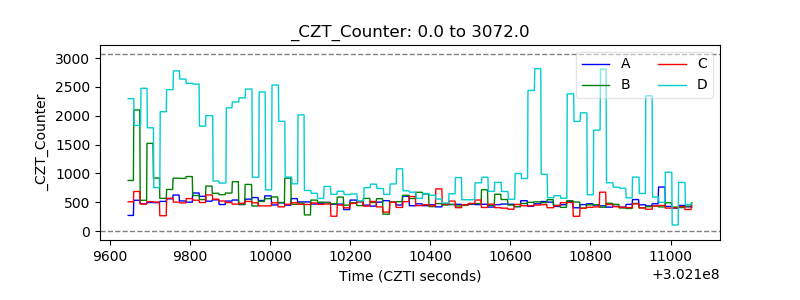 |
| +2.5 Volts monitor | 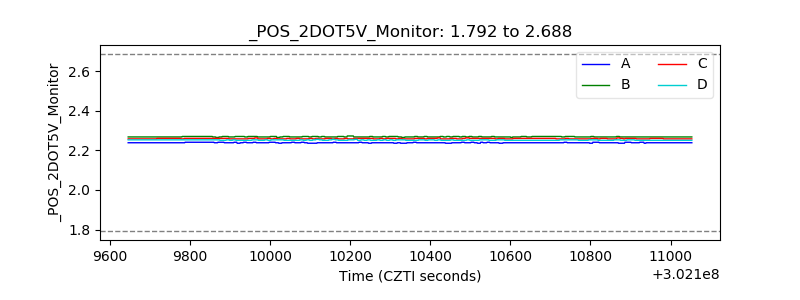 |
| +5 Volts monitor | 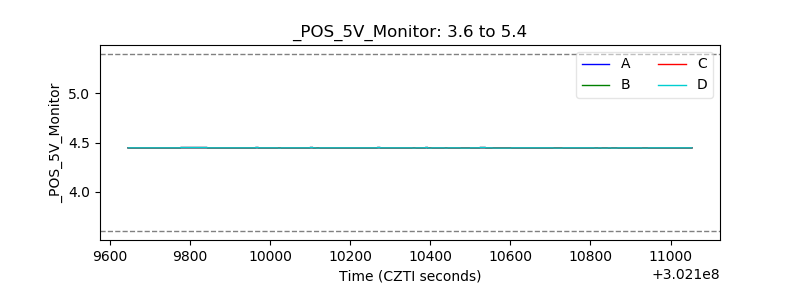 |
| _ROLL_ROT | 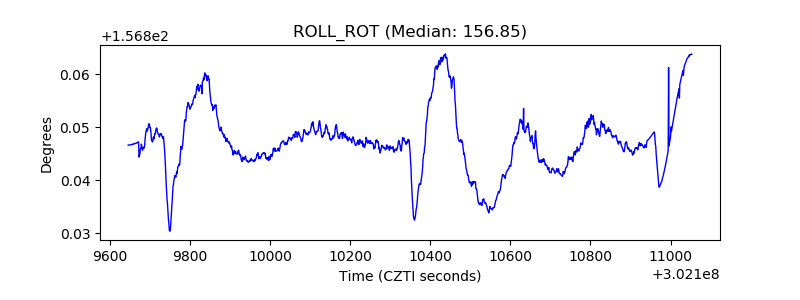 |
| _Roll_DEC | 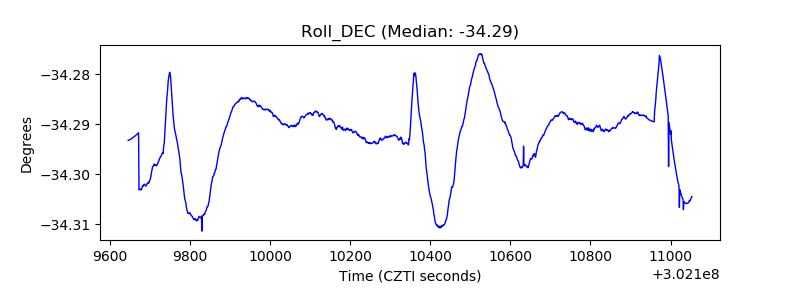 |
| _Roll_RA | 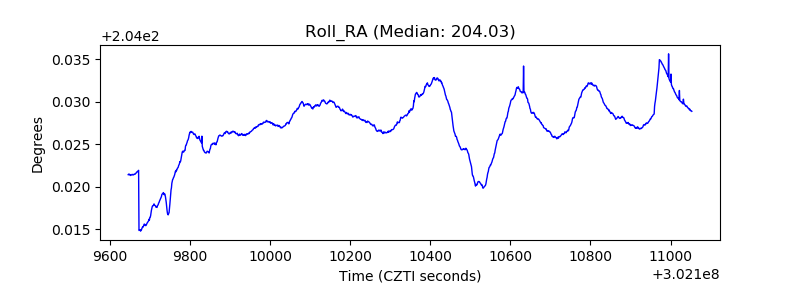 |
| Veto Counter | 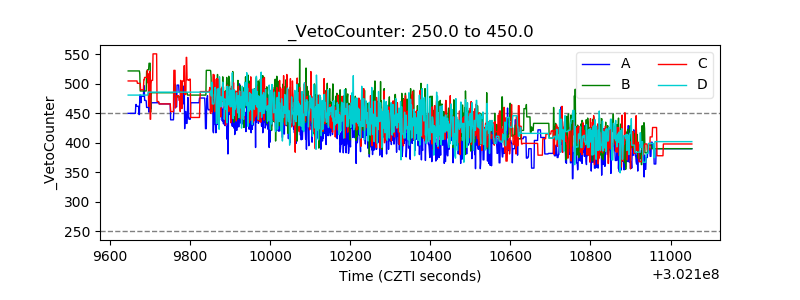 |