| Param | Original file | Final file |
|---|---|---|
| Filename | modeM0/AS1A05_165T07_9000003062_20737cztM0_level2.evt | modeM0/AS1A05_165T07_9000003062_20737cztM0_level2_quad_clean.evt |
| Size (bytes) | 86,454,720 | 21,156,480 |
| Size | 82.4 MB | 20.2 MB |
| Events in quadrant A | 507,090 | 146,899 |
| Events in quadrant B | 532,158 | 143,381 |
| Events in quadrant C | 480,523 | 137,785 |
| Events in quadrant D | 1,023,669 | 131,193 |
| Mode SS | |||
|---|---|---|---|
| Quadrant | BADHDUFLAG | Total packets | Discarded packets |
| A | 0 | 20 | 0 |
| B | 0 | 20 | 0 |
| C | 0 | 20 | 0 |
| D | 0 | 20 | 0 |
| Mode M0 | |||
|---|---|---|---|
| Quadrant | BADHDUFLAG | Total packets | Discarded packets |
| A | 0 | 2179 | 0 |
| B | 0 | 2256 | 0 |
| C | 0 | 2128 | 0 |
| D | 0 | 3802 | 0 |
| Quadrant | Total seconds | Saturated seconds | Saturation percentage |
|---|---|---|---|
| A | 1060 | 1 | 0.094340% |
| B | 1061 | 1 | 0.094251% |
| C | 1061 | 3 | 0.282752% |
| D | 1061 | 113 | 10.650330% |
Noise dominated data is calculated using 1-second bins in cleaned event files. If a bin has >2000 counts, and if more than 50% of those come from <1% of pixels, then it is considered to be noise-dominated and hence unusable.
| Quadrant | # 1 sec bins | Bins with >0 counts | Bins with >2000 counts | High rate bins dominated by noise | Noise dominated (total time) | Noise dominated (detector-on time) | Marked lightcurve |
|---|---|---|---|---|---|---|---|
| A | 1060 | 1060 | 0 | 0 | 0.00% | 0.00% | 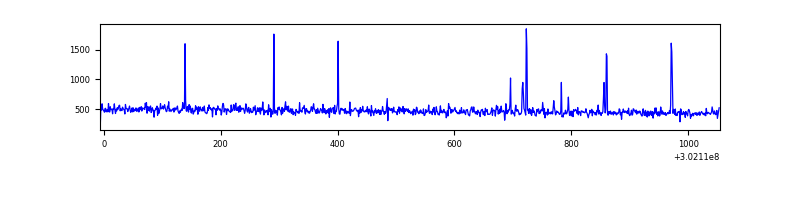 |
| B | 1061 | 1061 | 2 | 2 | 0.19% | 0.19% | 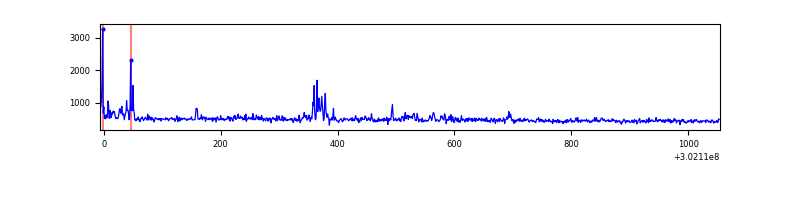 |
| C | 1061 | 1061 | 0 | 0 | 0.00% | 0.00% | 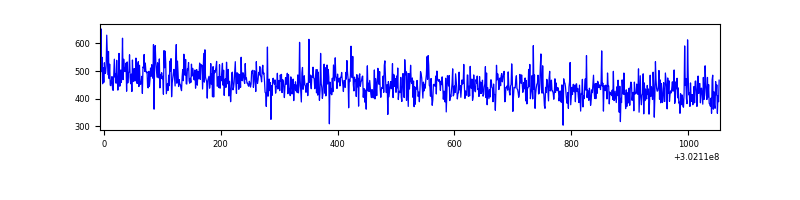 |
| D | 1061 | 1061 | 111 | 111 | 10.46% | 10.46% | 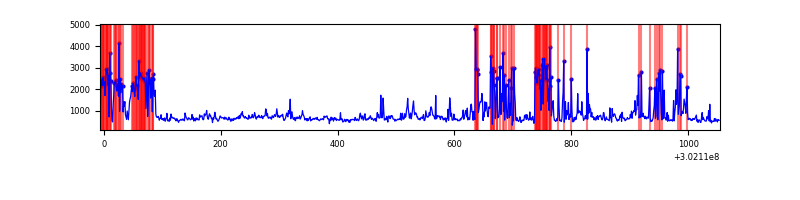 |
Top three noisy pixels from each quadrant. If the there are fewer than three noisy pixels in the level2.evt file, extra rows are filled as -1
| Pixel properties | Quadrant properties | ||||||
|---|---|---|---|---|---|---|---|
| Quadrant | DetID | PixID | Counts | Sigma | Mean | Median | Sigma |
| A | 6 | 240 | 15927 | 572.98 | 127 | 124 | 27.6 |
| A | 8 | 205 | 1552 | 51.78 | 127 | 124 | 27.6 |
| A | 0 | 226 | 1176 | 38.14 | 127 | 124 | 27.6 |
| B | 7 | 220 | 18828 | 747.65 | 123 | 120 | 25.0 |
| B | 0 | 189 | 15586 | 618.08 | 123 | 120 | 25.0 |
| B | 0 | 190 | 10398 | 410.75 | 123 | 120 | 25.0 |
| C | 14 | 238 | 18131 | 622.68 | 117 | 117 | 28.9 |
| C | 3 | 233 | 5470 | 185.04 | 117 | 117 | 28.9 |
| C | 13 | 61 | 830 | 24.65 | 117 | 117 | 28.9 |
| D | 1 | 52 | 424487 | 14137.36 | 116 | 112 | 30.0 |
| D | 1 | 20 | 93859 | 3123.01 | 116 | 112 | 30.0 |
| D | 2 | 165 | 29793 | 988.76 | 116 | 112 | 30.0 |
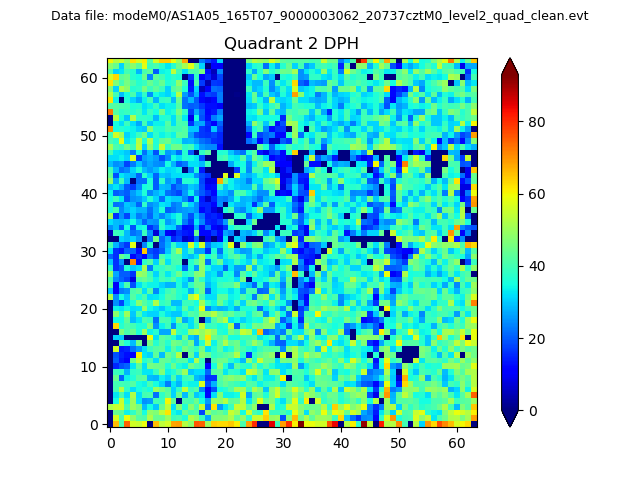
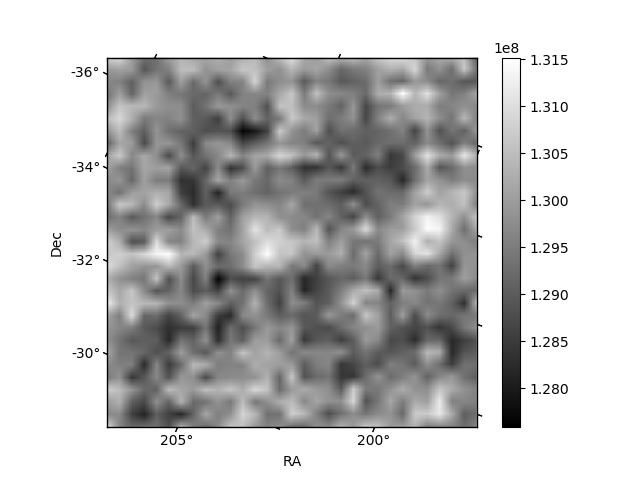
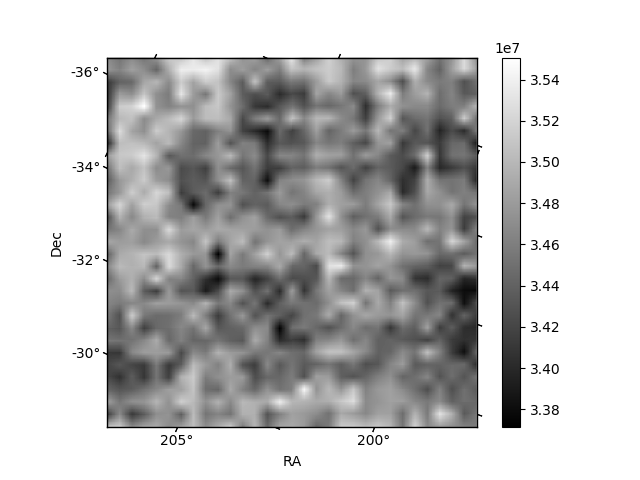
Histogram calculated using DETX and DETY for each event in the final _common_clean file
| Quadrant A | 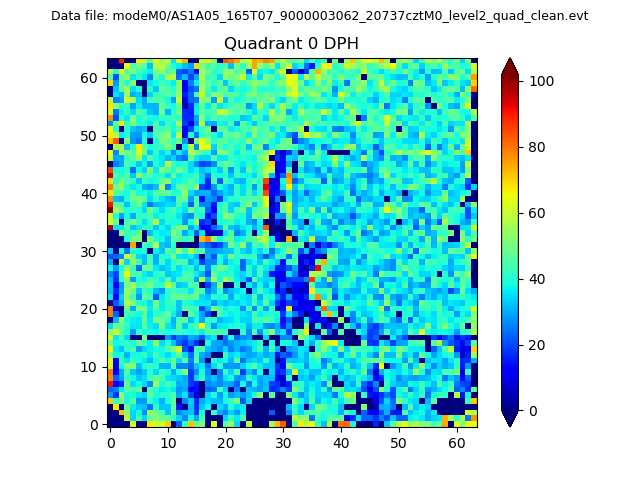 |
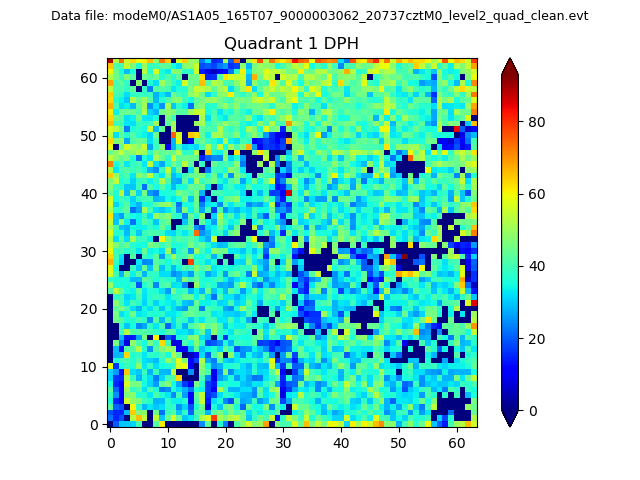 |
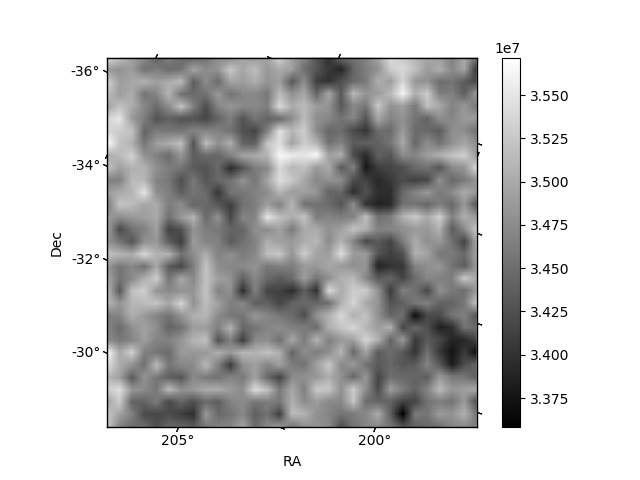
Quadrant B |
|---|---|---|---|
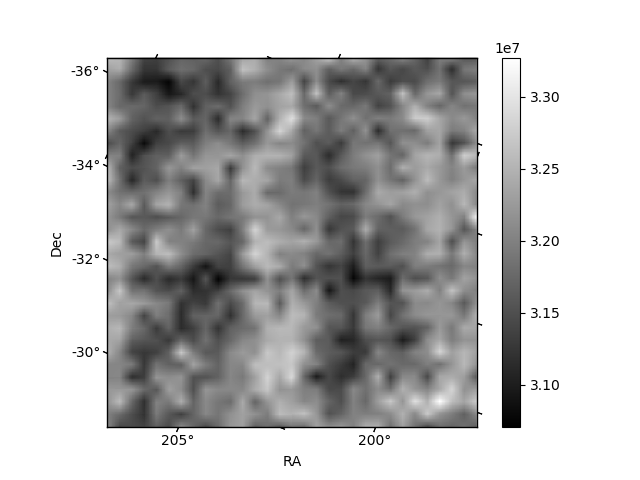
| Quadrant D | 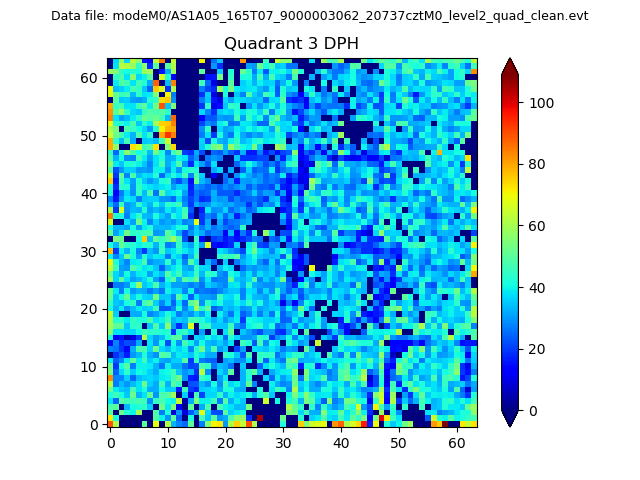 |
 |
Quadrant C |
| Plot type | Count rate plots | Images |
|---|---|---|
| Comparison with Poisson distribution Blue bars denote a histogram of data divided into 1 sec bins. Red curve is a Poisson curve with rate = median count rate of data. |
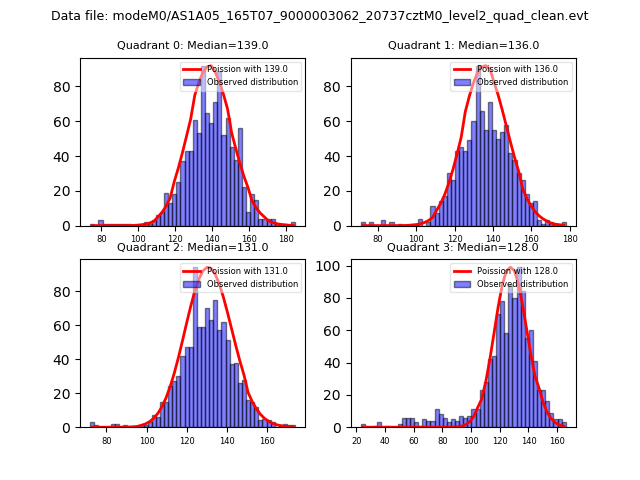 |
 |
| Quadrant-wise count rates Data is divided into 100 sec bins |
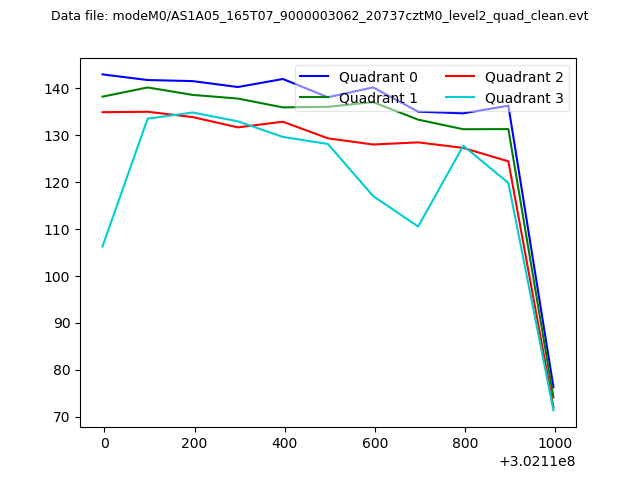 |
|
| Module-wise count rates for Quadrant A Data is divided into 100 sec bins |
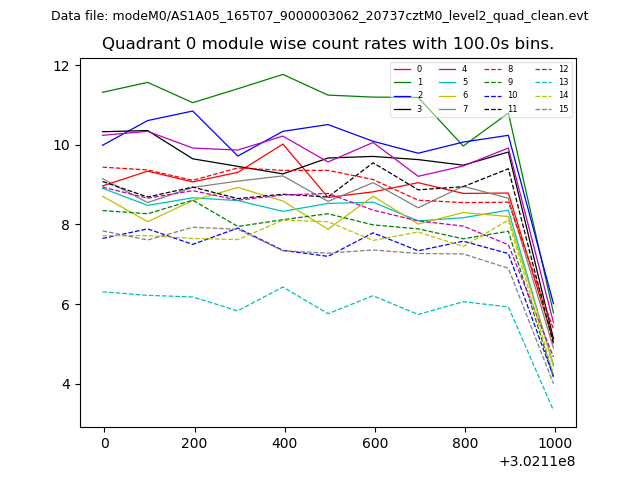 |
 |
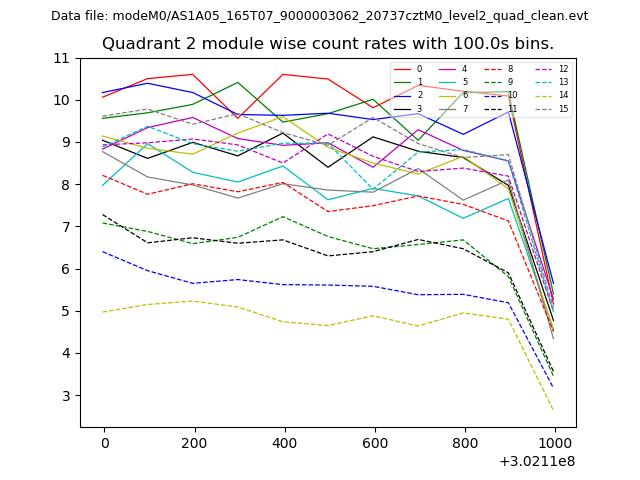
| Module-wise count rates for Quadrant B Data is divided into 100 sec bins |
 |
 |
| Module-wise count rates for Quadrant C Data is divided into 100 sec bins |
 |
 |
| Module-wise count rates for Quadrant D Data is divided into 100 sec bins |
 |
 |
| Parameter | Plot |
|---|---|
| CZT HV Monitor |  |
| D_VDD | 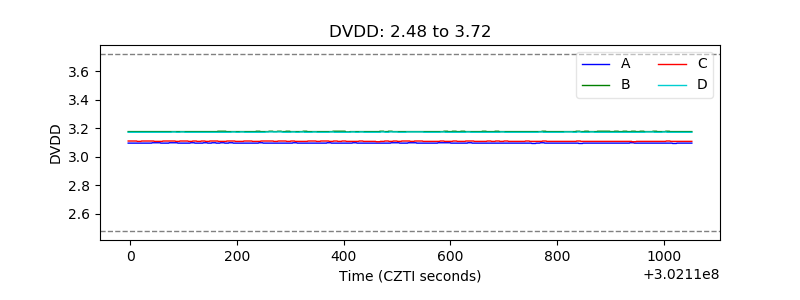 |
| Temperature 1 | 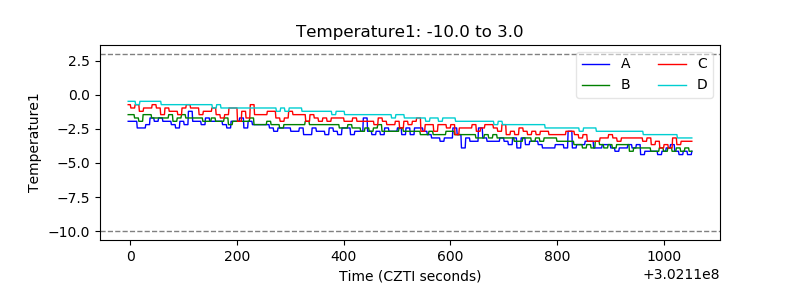 |
| Veto HV Monitor | 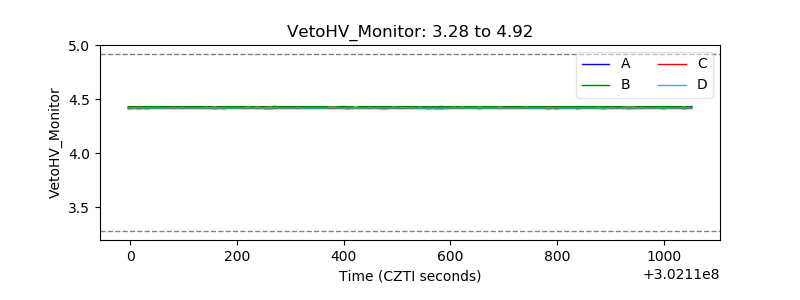 |
| Veto LLD |  |
| Alpha Counter | 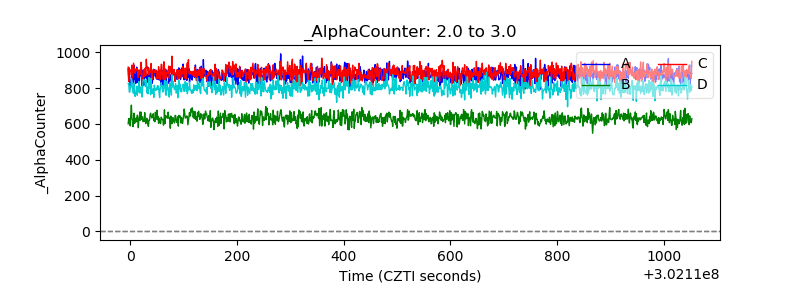 |
| _CPM_Rate | 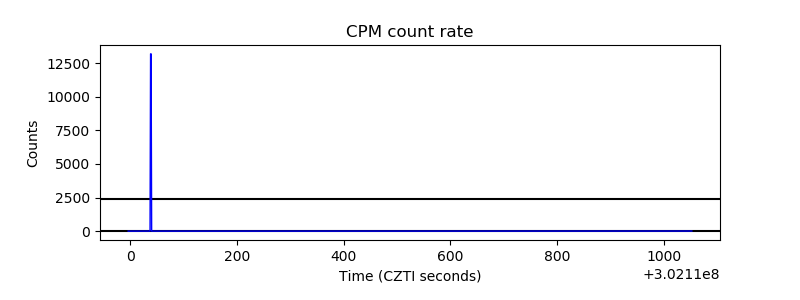 |
| CZT Counter | 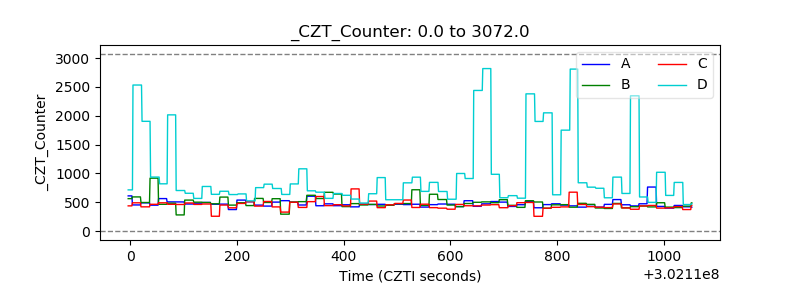 |
| +2.5 Volts monitor |  |
| +5 Volts monitor |  |
| _ROLL_ROT |  |
| _Roll_DEC | 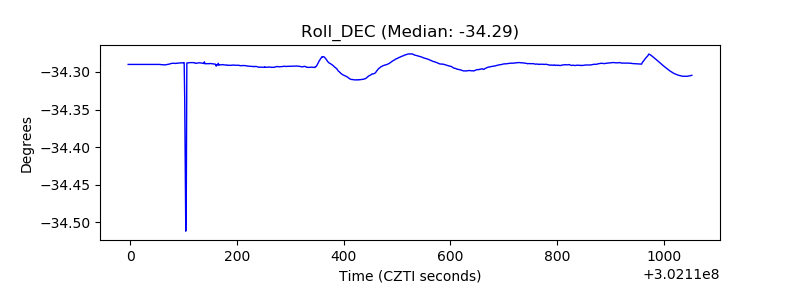 |
| _Roll_RA | 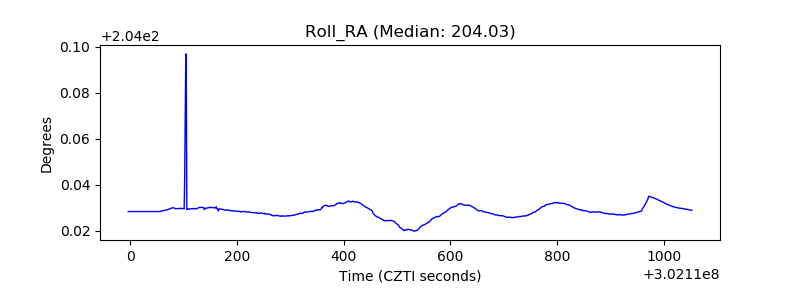 |
| Veto Counter |  |