| Param | Original file | Final file |
|---|---|---|
| Filename | modeM0/AS1A06_002T02_9000003064cztM0_level2.fits | modeM0/AS1A06_002T02_9000003064cztM0_level2_quad_clean.evt |
| Size (bytes) | 178,015,680 | 163,252,800 |
| Size | 169.8 MB | 155.7 MB |
| Events in quadrant A | 1,086,828 | 966,243 |
| Events in quadrant B | 1,041,274 | 961,522 |
| Events in quadrant C | 1,052,952 | 888,757 |
| Events in quadrant D | 912,042 | 828,797 |
| Mode M9 | |||
|---|---|---|---|
| Quadrant | BADHDUFLAG | Total packets | Discarded packets |
| A | 0 | 21 | 0 |
| B | 0 | 22 | 0 |
| C | 0 | 22 | 0 |
| D | 0 | 22 | 0 |
| Mode M0 | |||
|---|---|---|---|
| Quadrant | BADHDUFLAG | Total packets | Discarded packets |
| A | 0 | 38704 | 0 |
| B | 0 | 39318 | 0 |
| C | 0 | 38868 | 0 |
| D | 0 | 47169 | 0 |
| Mode SS | |||
|---|---|---|---|
| Quadrant | BADHDUFLAG | Total packets | Discarded packets |
| A | 0 | 384 | 0 |
| B | 0 | 384 | 0 |
| C | 0 | 384 | 0 |
| D | 0 | 384 | 0 |
| Quadrant | Total seconds | Saturated seconds | Saturation percentage |
|---|---|---|---|
| A | 18838 | 123 | 0.652936% |
| B | 18835 | 208 | 1.104327% |
| C | 18836 | 245 | 1.300701% |
| D | 18835 | 463 | 2.458190% |
Noise dominated data is calculated using 1-second bins in cleaned event files. If a bin has >2000 counts, and if more than 50% of those come from <1% of pixels, then it is considered to be noise-dominated and hence unusable.
| Quadrant | # 1 sec bins | Bins with >0 counts | Bins with >2000 counts | High rate bins dominated by noise | Noise dominated (total time) | Noise dominated (detector-on time) | Marked lightcurve |
|---|---|---|---|---|---|---|---|
| A | 29878 | 18840 | 0 | 0 | 0.00% | 0.00% |  |
| B | 29878 | 18839 | 0 | 0 | 0.00% | 0.00% | 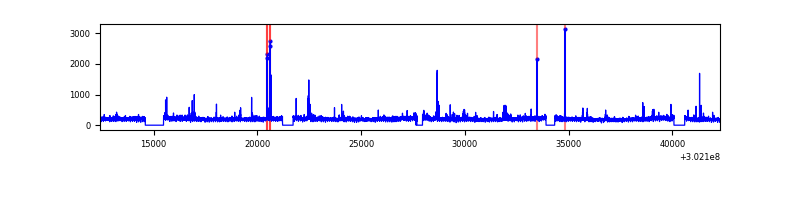 |
| C | 29878 | 18841 | 0 | 0 | 0.00% | 0.00% |  |
| D | 29878 | 18837 | 0 | 0 | 0.00% | 0.00% |  |
Top three noisy pixels from each quadrant. If the there are fewer than three noisy pixels in the level2.evt file, extra rows are filled as -1
| Pixel properties | Quadrant properties | ||||||
|---|---|---|---|---|---|---|---|
| Quadrant | DetID | PixID | Counts | Sigma | Mean | Median | Sigma |
| A | 0 | 29 | 1085 | 11.37 | 282 | 266 | 72.1 |
| A | 9 | 19 | 854 | 8.16 | 282 | 266 | 72.1 |
| A | 0 | 30 | 852 | 8.13 | 282 | 266 | 72.1 |
| B | 2 | 9 | 813 | 9.69 | 274 | 261 | 57.0 |
| B | 3 | 17 | 705 | 7.8 | 274 | 261 | 57.0 |
| B | 14 | 254 | 690 | 7.53 | 274 | 261 | 57.0 |
| C | 1 | 81 | 824 | 7.83 | 276 | 258 | 72.3 |
| C | 1 | 80 | 796 | 7.44 | 276 | 258 | 72.3 |
| C | 12 | 241 | 766 | 7.03 | 276 | 258 | 72.3 |
| D | 7 | 3 | 669 | 6.12 | 259 | 236 | 70.8 |
| D | 15 | 46 | 665 | 6.06 | 259 | 236 | 70.8 |
| D | 6 | 38 | 660 | 5.99 | 259 | 236 | 70.8 |
Histogram calculated using DETX and DETY for each event in the final _common_clean file
| Quadrant A | 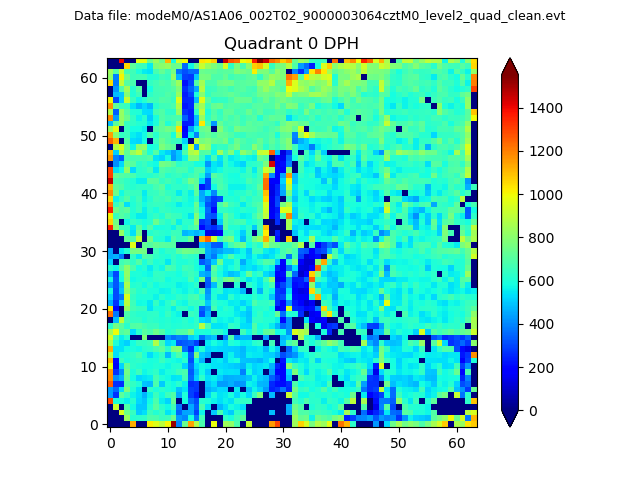 |
 |
Quadrant B |
|---|---|---|---|
| Quadrant D |  |
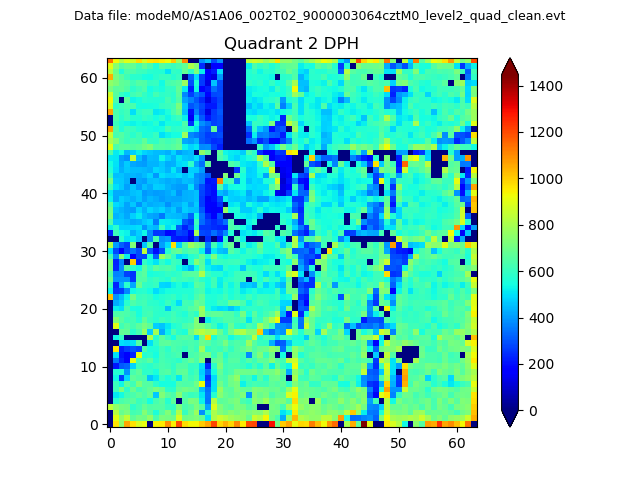 |
Quadrant C |
| Plot type | Count rate plots | Images |
|---|---|---|
| Comparison with Poisson distribution Blue bars denote a histogram of data divided into 1 sec bins. Red curve is a Poisson curve with rate = median count rate of data. |
 |
 |
| Quadrant-wise count rates Data is divided into 100 sec bins |
 |
|
| Module-wise count rates for Quadrant A Data is divided into 100 sec bins |
 |
 |
| Module-wise count rates for Quadrant B Data is divided into 100 sec bins |
 |
 |
| Module-wise count rates for Quadrant C Data is divided into 100 sec bins |
 |
 |
| Module-wise count rates for Quadrant D Data is divided into 100 sec bins |
 |
 |
| Parameter | Plot |
|---|---|
| CZT HV Monitor |  |
| D_VDD | 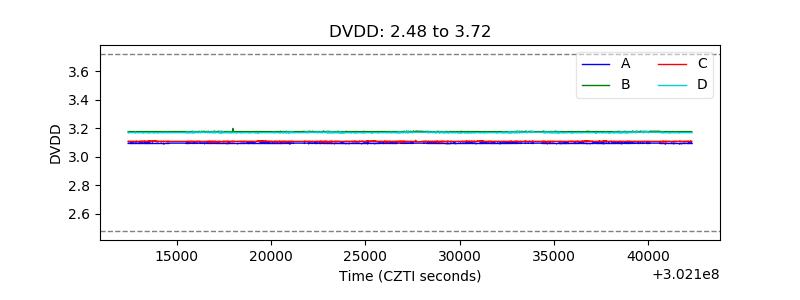 |
| Temperature 1 |  |
| Veto HV Monitor |  |
| Veto LLD |  |
| Alpha Counter |  |
| _CPM_Rate |  |
| CZT Counter |  |
| +2.5 Volts monitor |  |
| +5 Volts monitor |  |
| _ROLL_ROT |  |
| _Roll_DEC |  |
| _Roll_RA |  |
| Veto Counter |  |