| Param | Original file | Final file |
|---|---|---|
| Filename | modeM0/AS1A06_002T02_9000003064_20730cztM0_level2.evt | modeM0/AS1A06_002T02_9000003064_20730cztM0_level2_quad_clean.evt |
| Size (bytes) | 272,502,720 | 50,025,600 |
| Size | 259.9 MB | 47.7 MB |
| Events in quadrant A | 1,791,277 | 325,881 |
| Events in quadrant B | 1,803,934 | 327,330 |
| Events in quadrant C | 1,819,465 | 304,390 |
| Events in quadrant D | 2,590,572 | 300,808 |
| Mode M9 | |||
|---|---|---|---|
| Quadrant | BADHDUFLAG | Total packets | Discarded packets |
| A | 0 | 8 | 0 |
| B | 0 | 8 | 0 |
| C | 0 | 8 | 0 |
| D | 0 | 8 | 0 |
| Mode M0 | |||
|---|---|---|---|
| Quadrant | BADHDUFLAG | Total packets | Discarded packets |
| A | 0 | 7574 | 5 |
| B | 0 | 7570 | 1 |
| C | 0 | 7552 | 1 |
| D | 0 | 10109 | 8 |
| Mode SS | |||
|---|---|---|---|
| Quadrant | BADHDUFLAG | Total packets | Discarded packets |
| A | 0 | 76 | 0 |
| B | 0 | 76 | 0 |
| C | 0 | 76 | 0 |
| D | 0 | 76 | 0 |
| Quadrant | Total seconds | Saturated seconds | Saturation percentage |
|---|---|---|---|
| A | 3611 | 68 | 1.883135% |
| B | 3613 | 81 | 2.241904% |
| C | 3613 | 91 | 2.518683% |
| D | 3612 | 153 | 4.235880% |
Noise dominated data is calculated using 1-second bins in cleaned event files. If a bin has >2000 counts, and if more than 50% of those come from <1% of pixels, then it is considered to be noise-dominated and hence unusable.
| Quadrant | # 1 sec bins | Bins with >0 counts | Bins with >2000 counts | High rate bins dominated by noise | Noise dominated (total time) | Noise dominated (detector-on time) | Marked lightcurve |
|---|---|---|---|---|---|---|---|
| A | 4493 | 3614 | 4 | 4 | 0.09% | 0.11% | 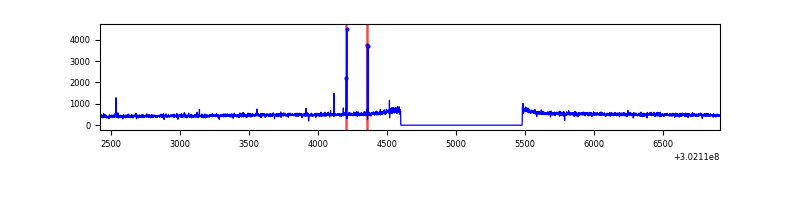 |
| B | 4493 | 3614 | 0 | 0 | 0.00% | 0.00% | 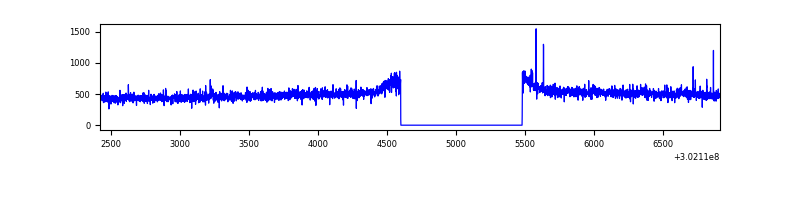 |
| C | 4493 | 3614 | 0 | 0 | 0.00% | 0.00% | 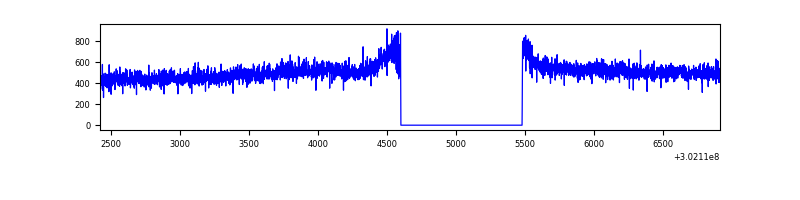 |
| D | 4493 | 3614 | 94 | 94 | 2.09% | 2.60% | 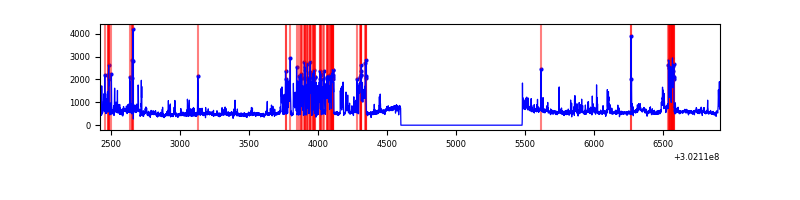 |
Top three noisy pixels from each quadrant. If the there are fewer than three noisy pixels in the level2.evt file, extra rows are filled as -1
| Pixel properties | Quadrant properties | ||||||
|---|---|---|---|---|---|---|---|
| Quadrant | DetID | PixID | Counts | Sigma | Mean | Median | Sigma |
| A | 6 | 240 | 22501 | 235.86 | 459 | 450 | 93.5 |
| A | 0 | 226 | 3963 | 37.58 | 459 | 450 | 93.5 |
| A | 3 | 137 | 3816 | 36.0 | 459 | 450 | 93.5 |
| B | 12 | 111 | 10723 | 115.82 | 455 | 444 | 88.8 |
| B | 11 | 111 | 9335 | 100.18 | 455 | 444 | 88.8 |
| B | 14 | 111 | 8222 | 87.64 | 455 | 444 | 88.8 |
| C | 14 | 238 | 67526 | 658.75 | 432 | 435 | 101.8 |
| C | 7 | 247 | 54212 | 528.02 | 432 | 435 | 101.8 |
| C | 3 | 233 | 10011 | 94.02 | 432 | 435 | 101.8 |
| D | 1 | 52 | 564319 | 5297.48 | 439 | 427 | 106.4 |
| D | 1 | 20 | 162466 | 1522.27 | 439 | 427 | 106.4 |
| D | 2 | 165 | 96359 | 901.23 | 439 | 427 | 106.4 |
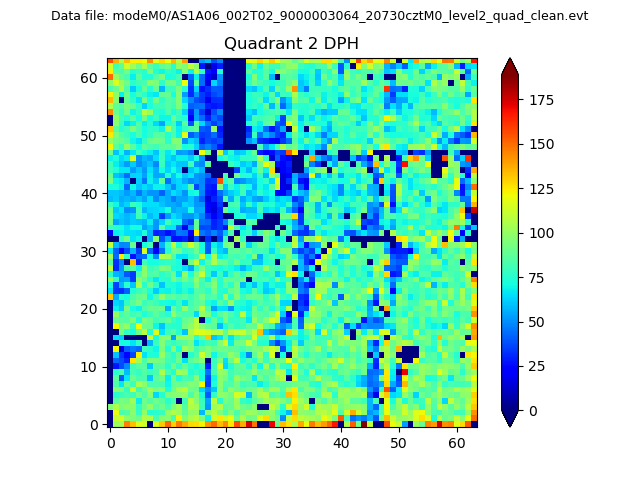
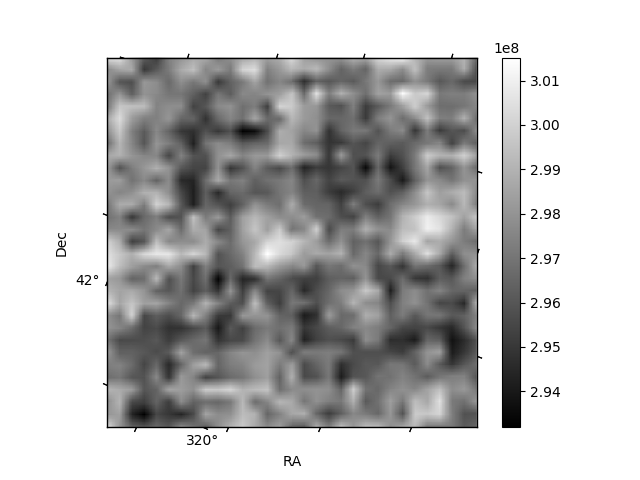
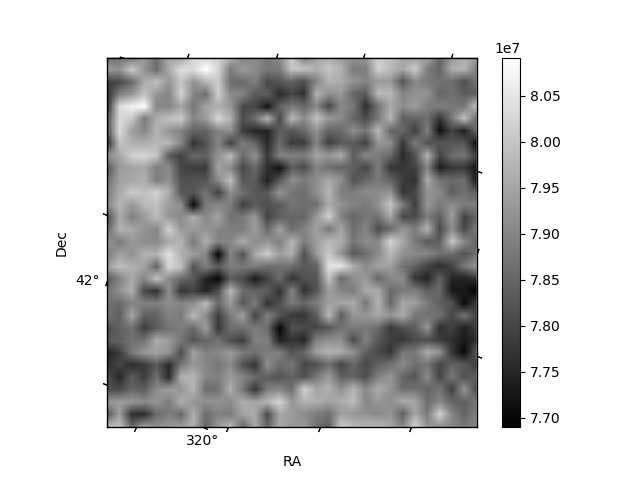
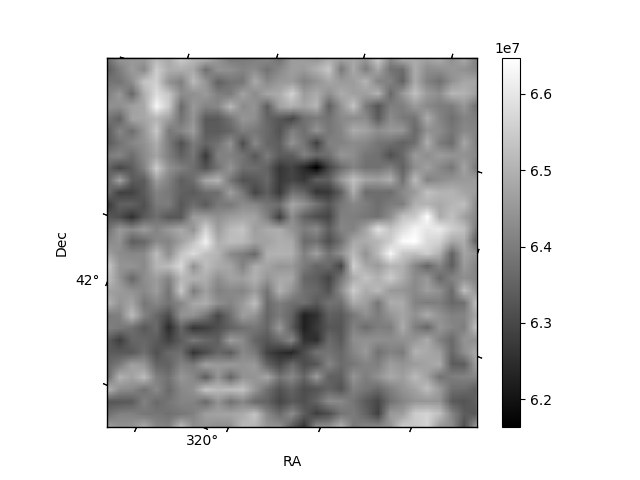
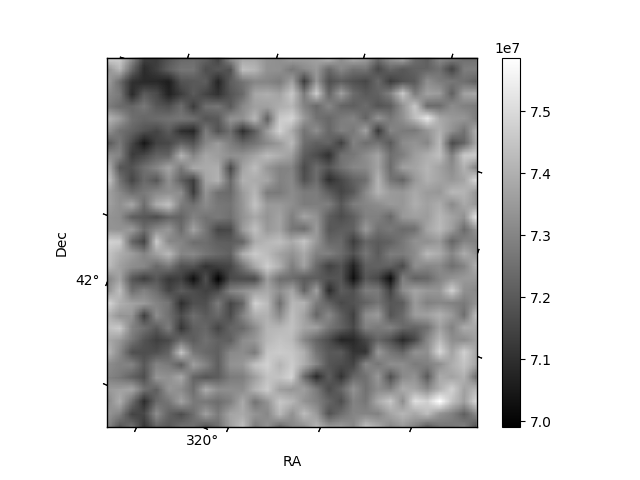
Histogram calculated using DETX and DETY for each event in the final _common_clean file
| Quadrant A | 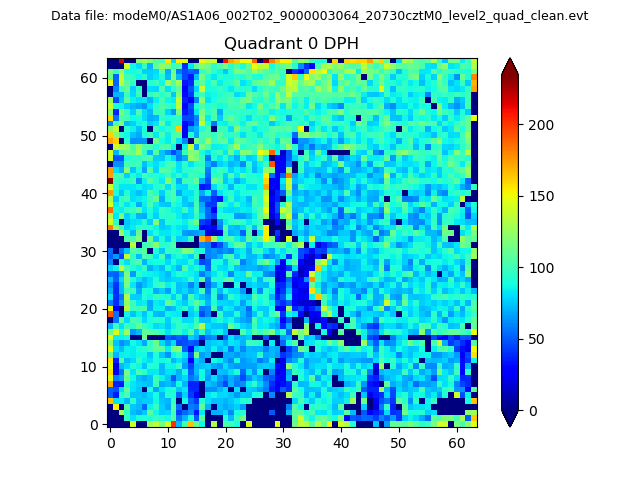 |
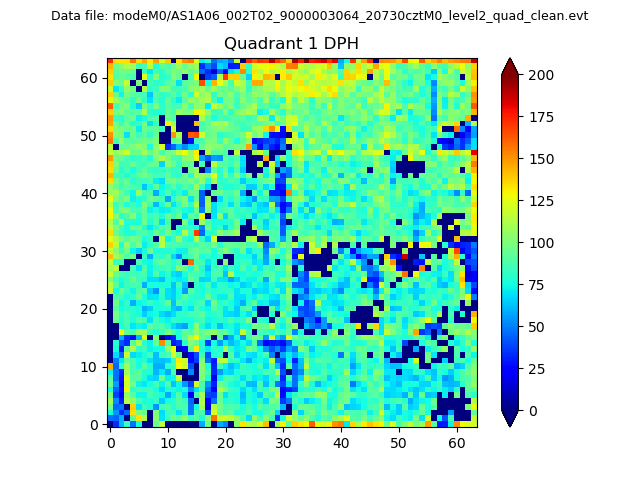 |
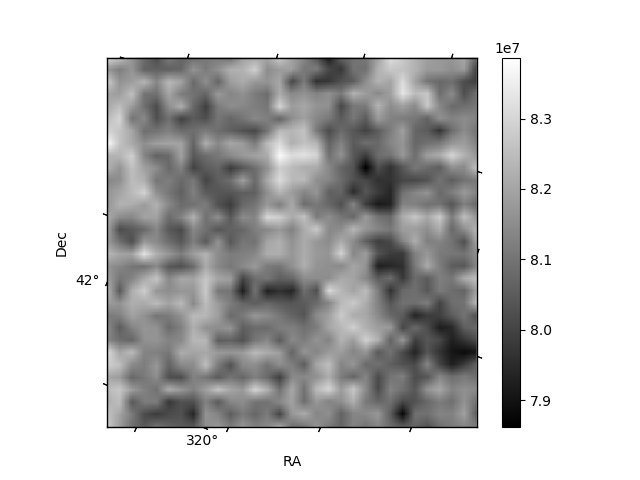
Quadrant B |
|---|---|---|---|
| Quadrant D | 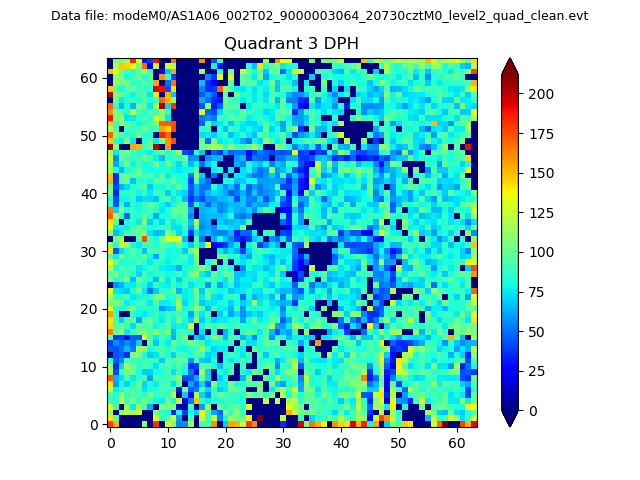 |
 |
Quadrant C |
| Plot type | Count rate plots | Images |
|---|---|---|
| Comparison with Poisson distribution Blue bars denote a histogram of data divided into 1 sec bins. Red curve is a Poisson curve with rate = median count rate of data. |
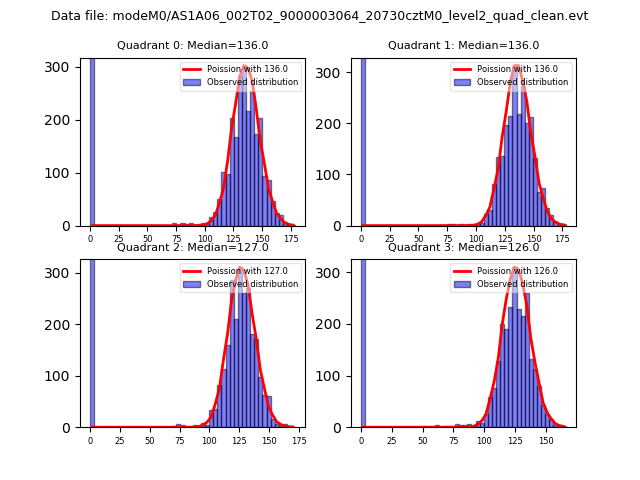 |
 |
| Quadrant-wise count rates Data is divided into 100 sec bins |
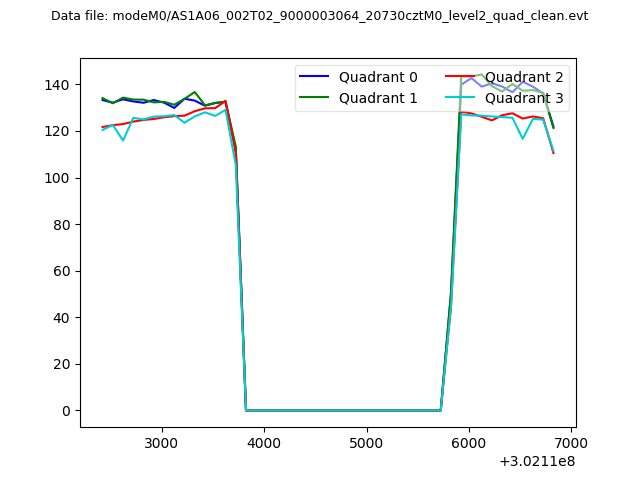 |
|
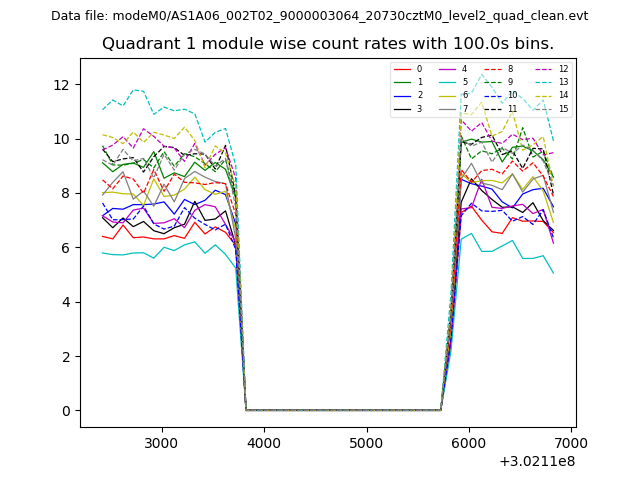
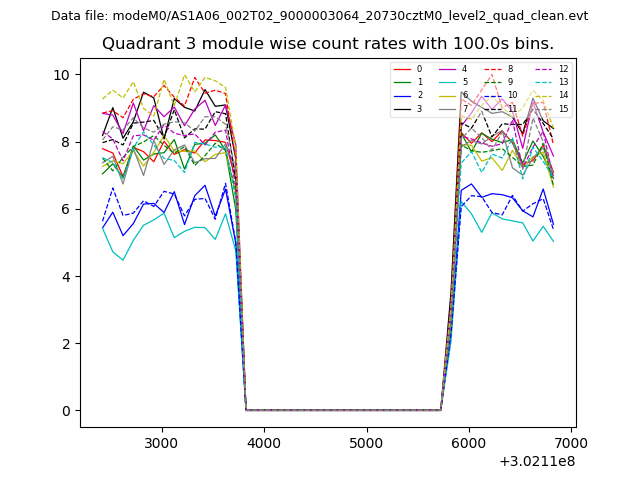
| Module-wise count rates for Quadrant A Data is divided into 100 sec bins |
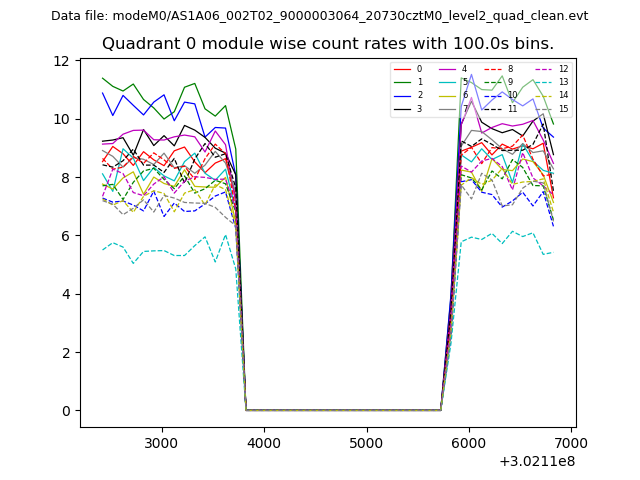 |
 |
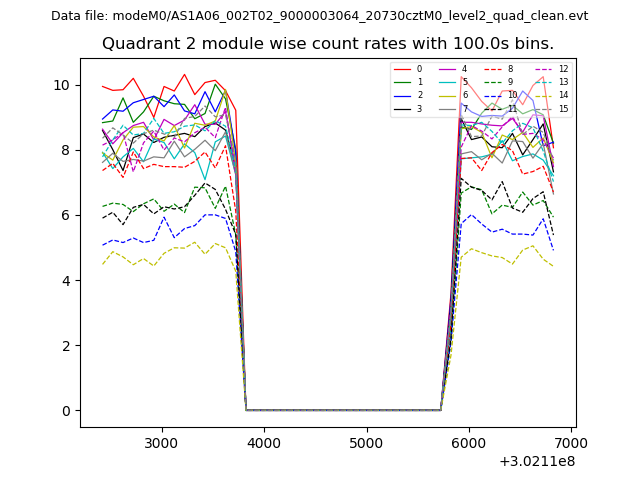
| Module-wise count rates for Quadrant B Data is divided into 100 sec bins |
 |
 |
| Module-wise count rates for Quadrant C Data is divided into 100 sec bins |
 |
 |
| Module-wise count rates for Quadrant D Data is divided into 100 sec bins |
 |
 |
| Parameter | Plot |
|---|---|
| CZT HV Monitor | 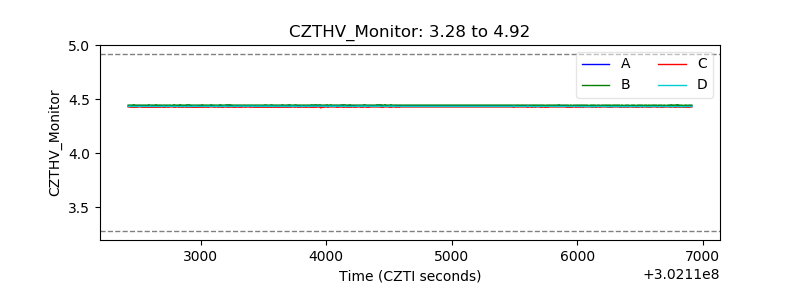 |
| D_VDD | 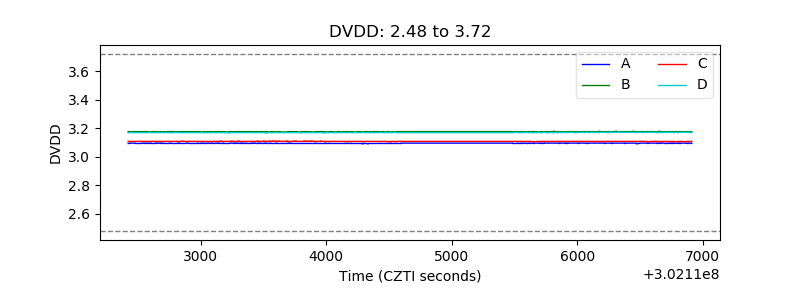 |
| Temperature 1 | 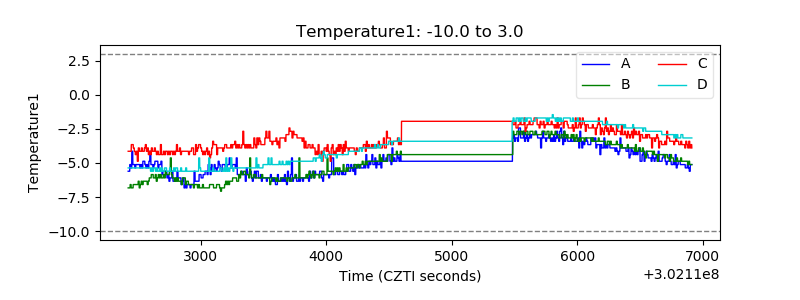 |
| Veto HV Monitor | 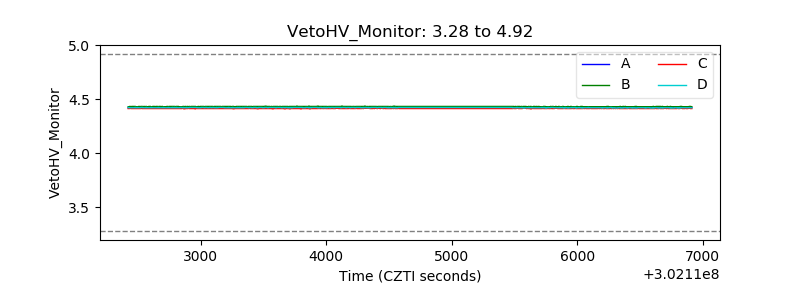 |
| Veto LLD | 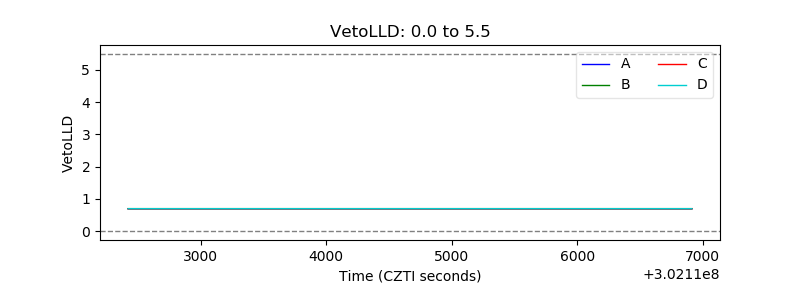 |
| Alpha Counter | 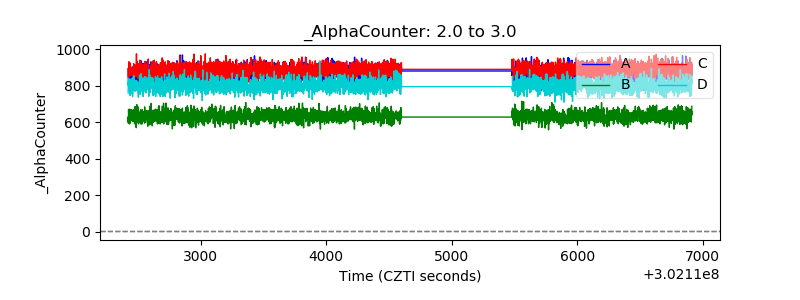 |
| _CPM_Rate | 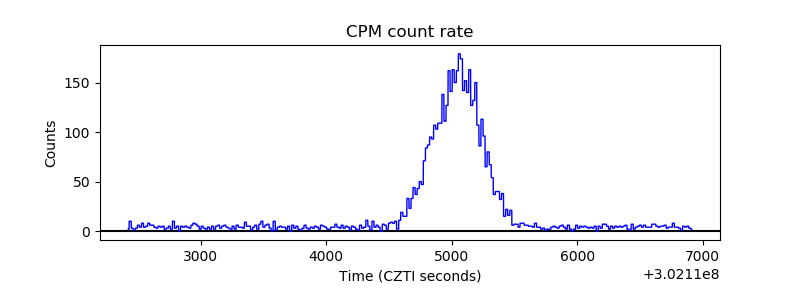 |
| CZT Counter | 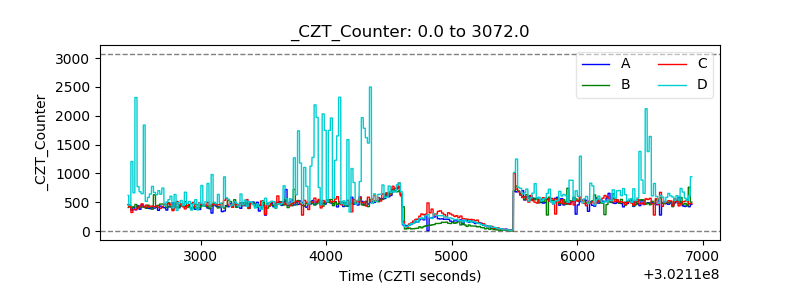 |
| +2.5 Volts monitor |  |
| +5 Volts monitor |  |
| _ROLL_ROT | 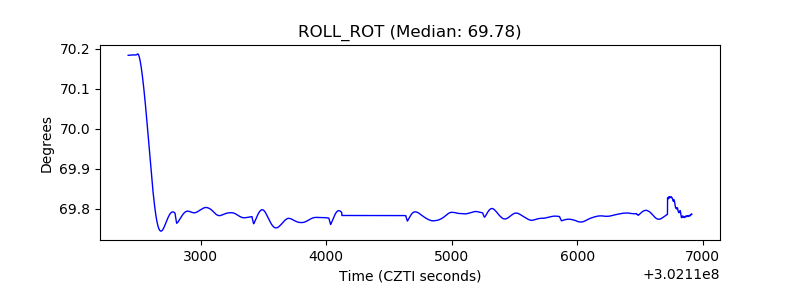 |
| _Roll_DEC | 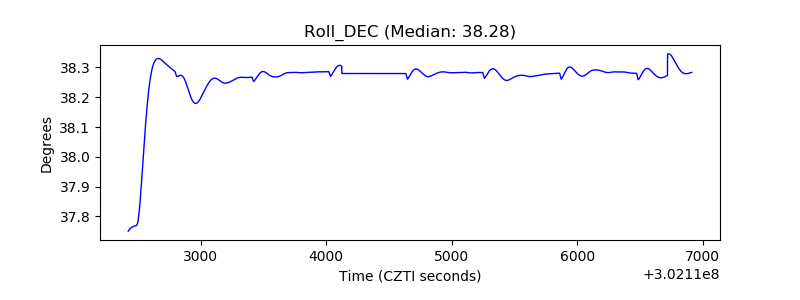 |
| _Roll_RA | 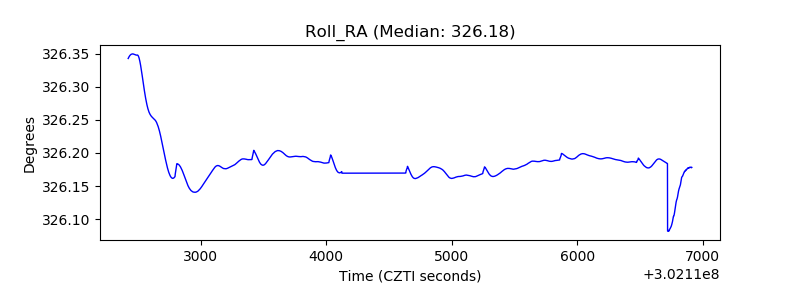 |
| Veto Counter | 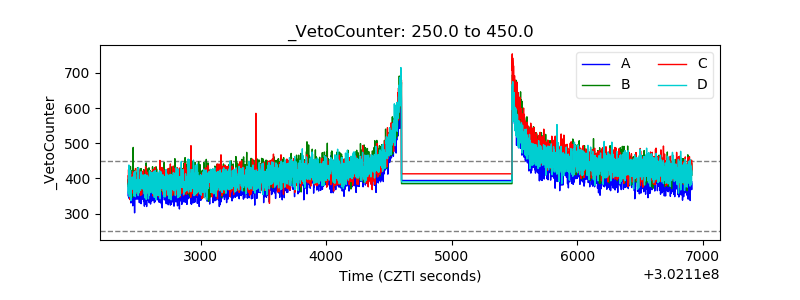 |