| Param | Original file | Final file |
|---|---|---|
| Filename | modeM0/AS1A06_002T02_9000003064_20731cztM0_level2.evt | modeM0/AS1A06_002T02_9000003064_20731cztM0_level2_quad_clean.evt |
| Size (bytes) | 445,841,280 | 100,465,920 |
| Size | 425.2 MB | 95.8 MB |
| Events in quadrant A | 3,004,782 | 674,557 |
| Events in quadrant B | 3,131,943 | 677,765 |
| Events in quadrant C | 3,155,244 | 626,458 |
| Events in quadrant D | 3,778,881 | 621,039 |
| Mode M9 | |||
|---|---|---|---|
| Quadrant | BADHDUFLAG | Total packets | Discarded packets |
| A | 0 | 12 | 0 |
| B | 0 | 13 | 0 |
| C | 0 | 13 | 0 |
| D | 0 | 13 | 0 |
| Mode M0 | |||
|---|---|---|---|
| Quadrant | BADHDUFLAG | Total packets | Discarded packets |
| A | 0 | 14435 | 1328 |
| B | 0 | 14935 | 1511 |
| C | 0 | 14539 | 1389 |
| D | 0 | 16998 | 1680 |
| Mode SS | |||
|---|---|---|---|
| Quadrant | BADHDUFLAG | Total packets | Discarded packets |
| A | 0 | 143 | 11 |
| B | 0 | 145 | 11 |
| C | 0 | 145 | 9 |
| D | 0 | 143 | 11 |
| Quadrant | Total seconds | Saturated seconds | Saturation percentage |
|---|---|---|---|
| A | 6345 | 29 | 0.457053% |
| B | 6348 | 65 | 1.023945% |
| C | 6335 | 98 | 1.546961% |
| D | 6317 | 124 | 1.962957% |
Noise dominated data is calculated using 1-second bins in cleaned event files. If a bin has >2000 counts, and if more than 50% of those come from <1% of pixels, then it is considered to be noise-dominated and hence unusable.
| Quadrant | # 1 sec bins | Bins with >0 counts | Bins with >2000 counts | High rate bins dominated by noise | Noise dominated (total time) | Noise dominated (detector-on time) | Marked lightcurve |
|---|---|---|---|---|---|---|---|
| A | 7577 | 6457 | 0 | 0 | 0.00% | 0.00% | 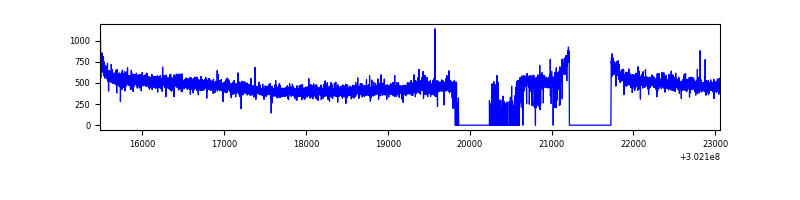 |
| B | 7577 | 6452 | 6 | 6 | 0.08% | 0.09% | 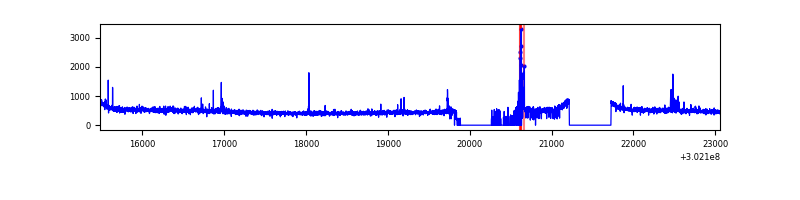 |
| C | 7577 | 6454 | 0 | 0 | 0.00% | 0.00% | 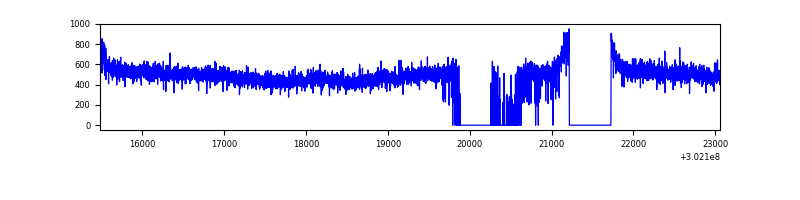 |
| D | 7577 | 6415 | 68 | 68 | 0.90% | 1.06% |  |
Top three noisy pixels from each quadrant. If the there are fewer than three noisy pixels in the level2.evt file, extra rows are filled as -1
| Pixel properties | Quadrant properties | ||||||
|---|---|---|---|---|---|---|---|
| Quadrant | DetID | PixID | Counts | Sigma | Mean | Median | Sigma |
| A | 10 | 253 | 8378 | 48.08 | 779 | 765 | 158.4 |
| A | 0 | 226 | 6671 | 37.3 | 779 | 765 | 158.4 |
| A | 3 | 137 | 6458 | 35.95 | 779 | 765 | 158.4 |
| B | 3 | 64 | 69469 | 463.45 | 775 | 755 | 148.3 |
| B | 12 | 111 | 17963 | 116.06 | 775 | 755 | 148.3 |
| B | 11 | 111 | 15635 | 100.36 | 775 | 755 | 148.3 |
| C | 7 | 247 | 136167 | 776.54 | 741 | 744 | 174.4 |
| C | 14 | 238 | 115040 | 655.4 | 741 | 744 | 174.4 |
| C | 3 | 233 | 13912 | 75.51 | 741 | 744 | 174.4 |
| D | 1 | 20 | 367797 | 2034.54 | 750 | 728 | 180.4 |
| D | 7 | 38 | 178209 | 983.72 | 750 | 728 | 180.4 |
| D | 2 | 165 | 143332 | 790.4 | 750 | 728 | 180.4 |
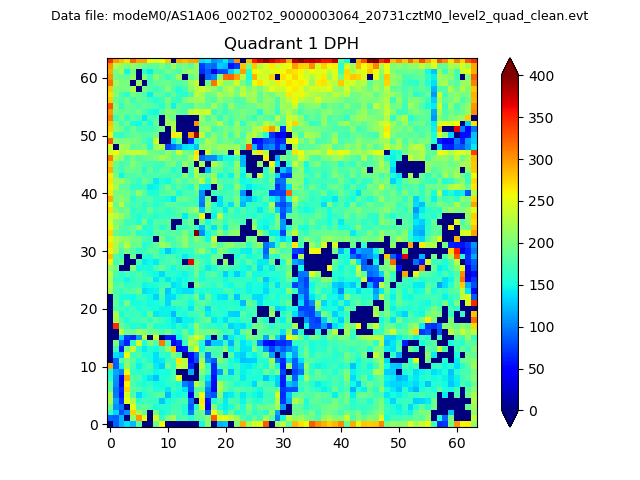
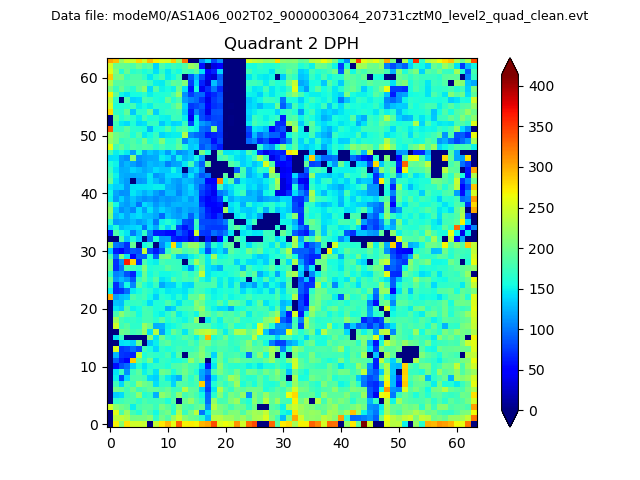
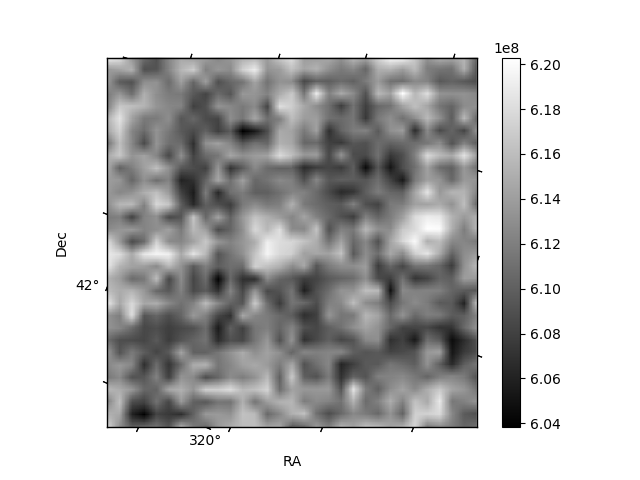
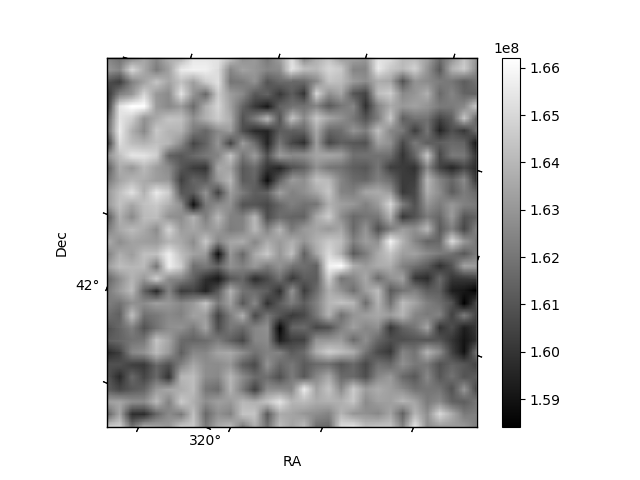
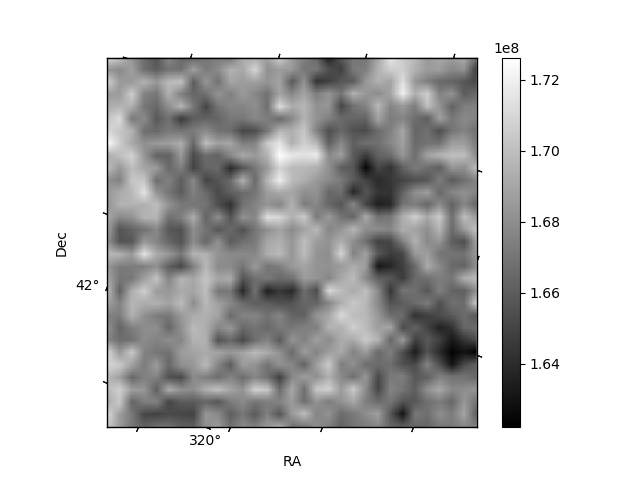
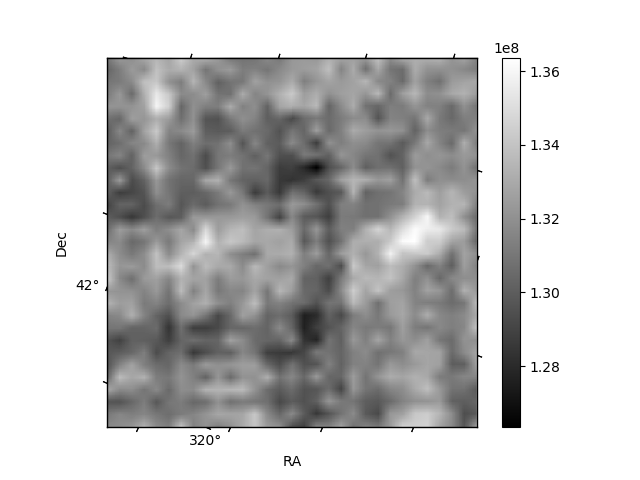
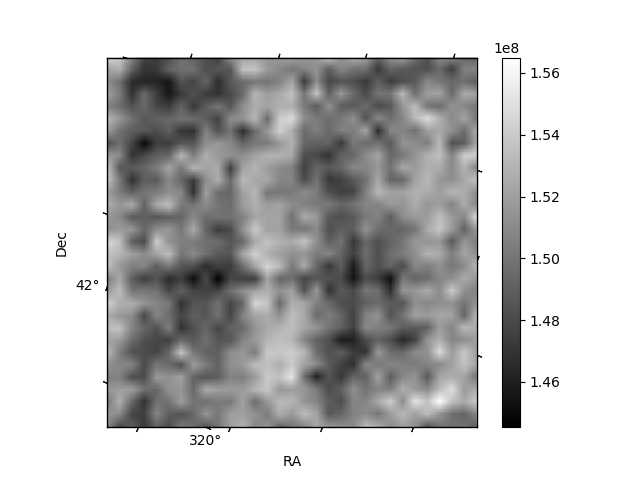
Histogram calculated using DETX and DETY for each event in the final _common_clean file
| Quadrant A | 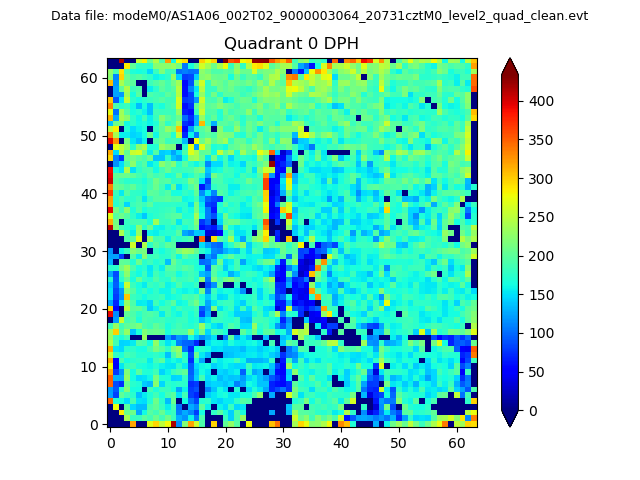 |
 |
Quadrant B |
|---|---|---|---|
| Quadrant D | 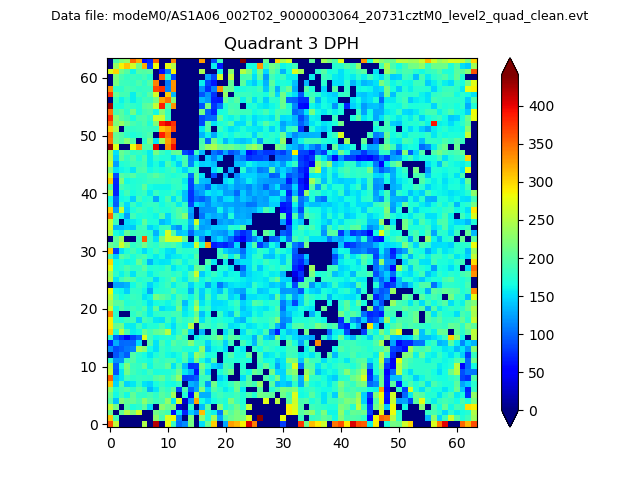 |
 |
Quadrant C |
| Plot type | Count rate plots | Images |
|---|---|---|
| Comparison with Poisson distribution Blue bars denote a histogram of data divided into 1 sec bins. Red curve is a Poisson curve with rate = median count rate of data. |
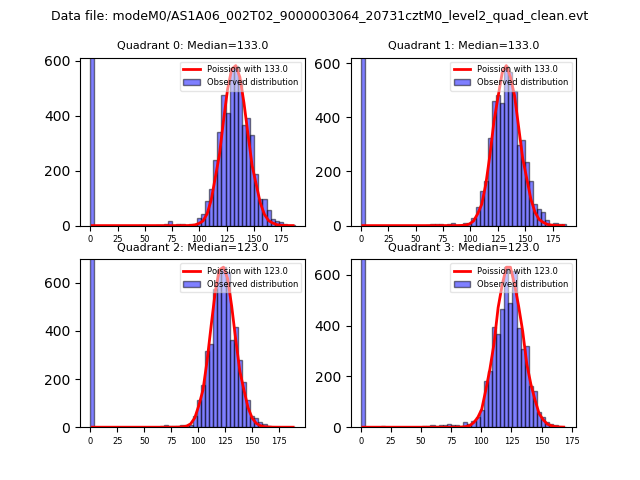 |
 |
| Quadrant-wise count rates Data is divided into 100 sec bins |
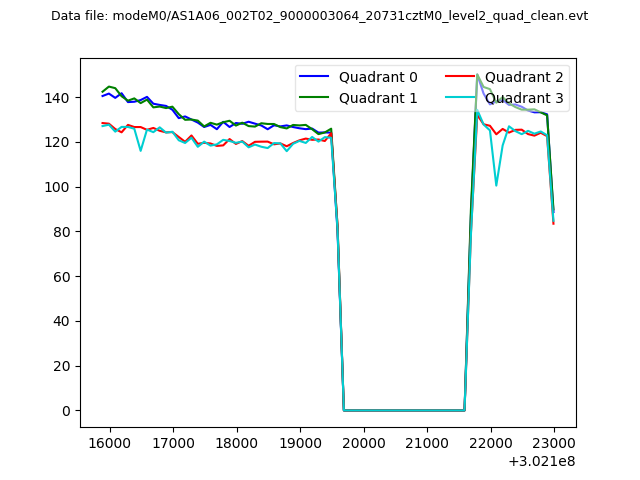 |
|
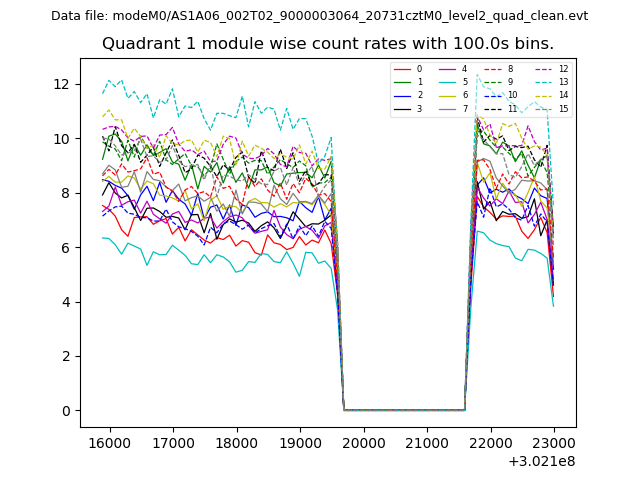
| Module-wise count rates for Quadrant A Data is divided into 100 sec bins |
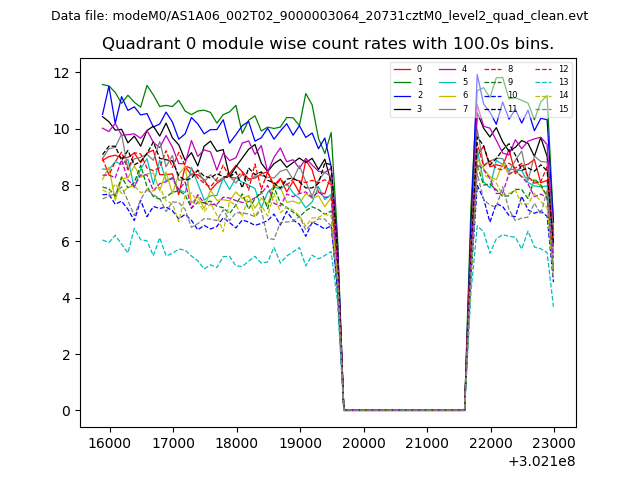 |
 |
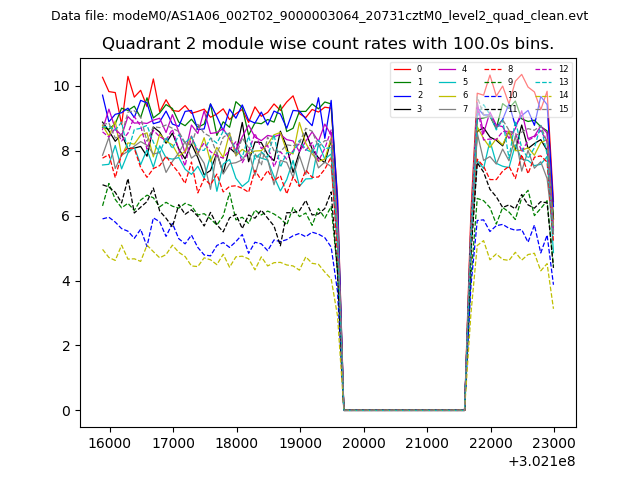
| Module-wise count rates for Quadrant B Data is divided into 100 sec bins |
 |
 |
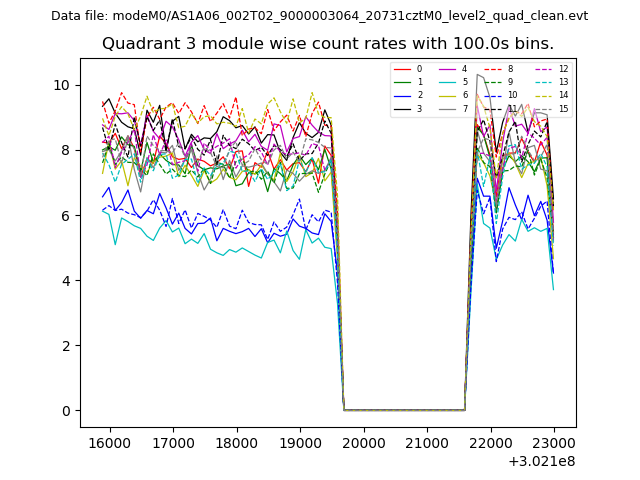
| Module-wise count rates for Quadrant C Data is divided into 100 sec bins |
 |
 |
| Module-wise count rates for Quadrant D Data is divided into 100 sec bins |
 |
 |
| Parameter | Plot |
|---|---|
| CZT HV Monitor | 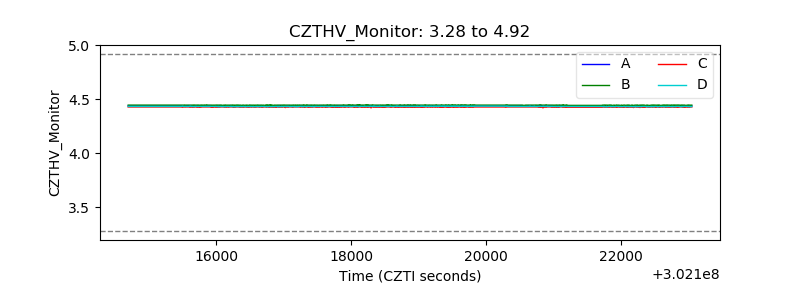 |
| D_VDD | 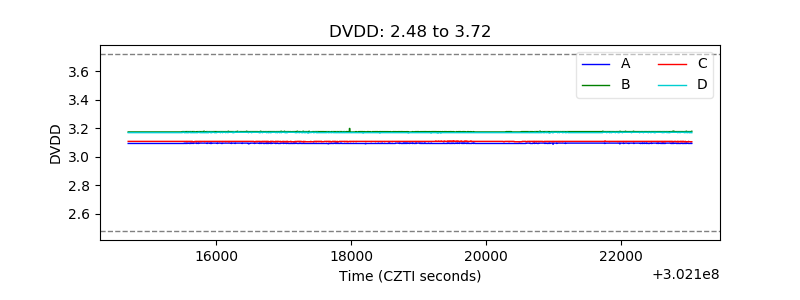 |
| Temperature 1 | 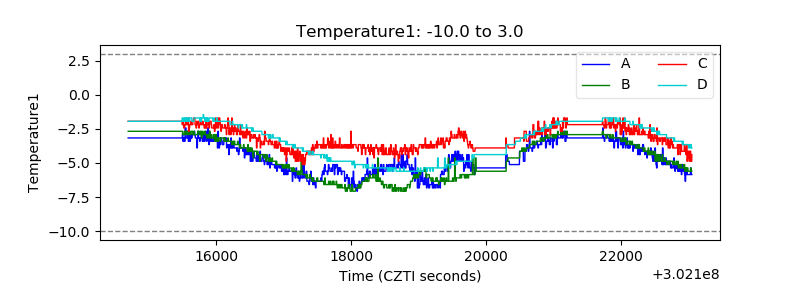 |
| Veto HV Monitor | 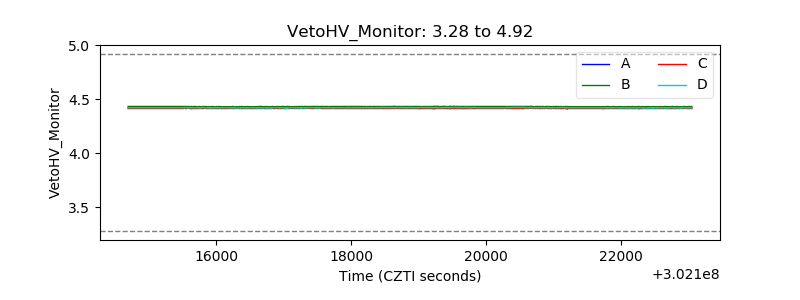 |
| Veto LLD | 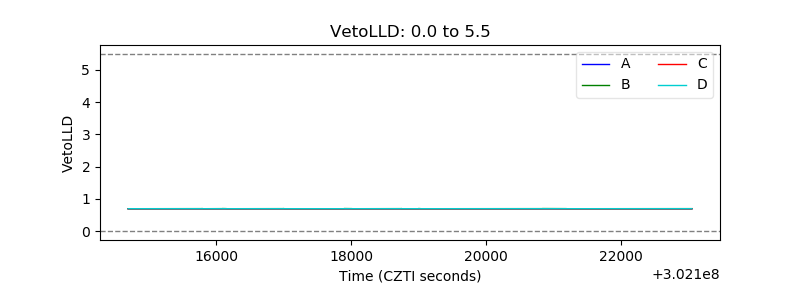 |
| Alpha Counter | 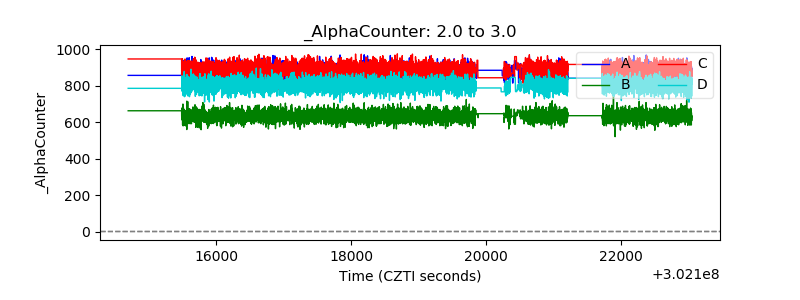 |
| _CPM_Rate | 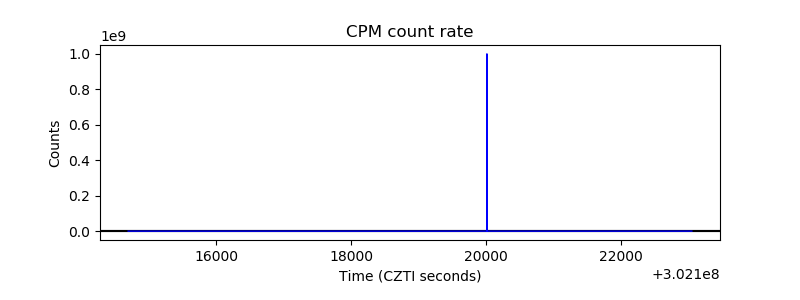 |
| CZT Counter | 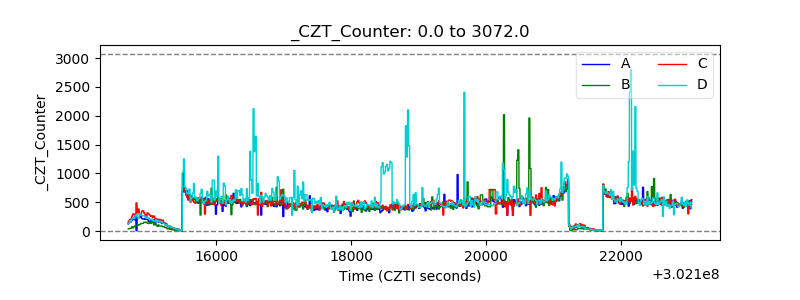 |
| +2.5 Volts monitor |  |
| +5 Volts monitor |  |
| _ROLL_ROT | 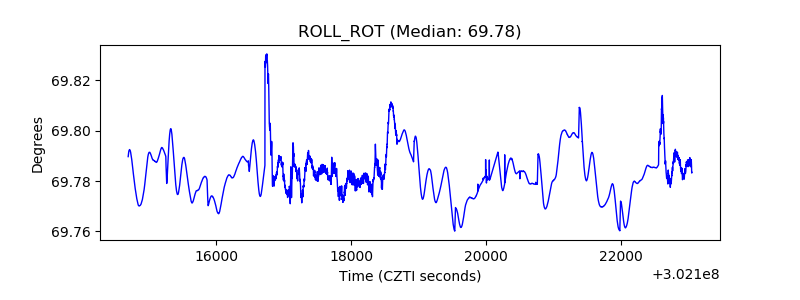 |
| _Roll_DEC | 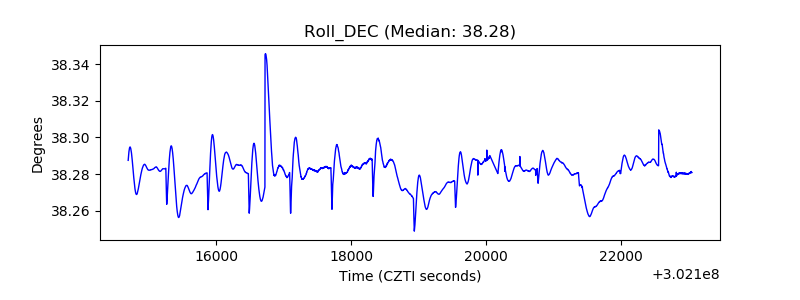 |
| _Roll_RA | 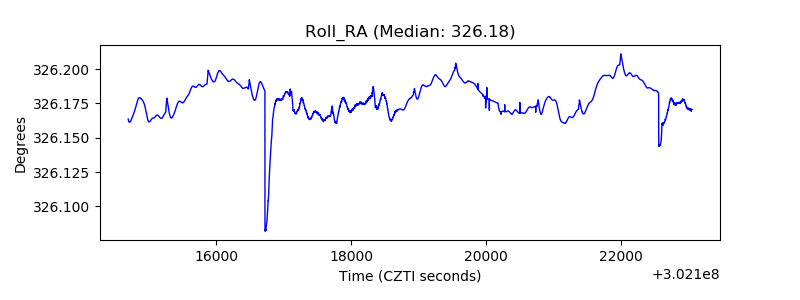 |
| Veto Counter | 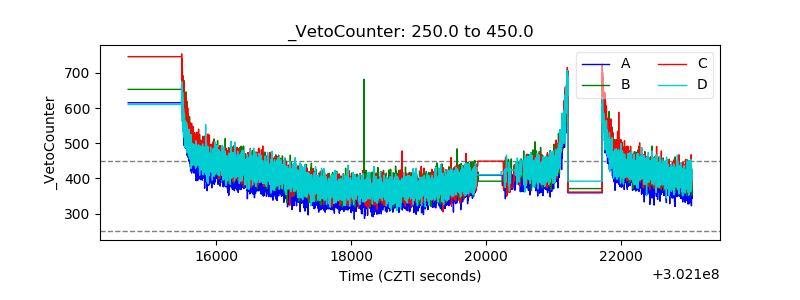 |