| Param | Original file | Final file |
|---|---|---|
| Filename | modeM0/AS1A06_002T02_9000003064_20732cztM0_level2.evt | modeM0/AS1A06_002T02_9000003064_20732cztM0_level2_quad_clean.evt |
| Size (bytes) | 499,613,760 | 104,287,680 |
| Size | 476.5 MB | 99.5 MB |
| Events in quadrant A | 3,434,741 | 684,602 |
| Events in quadrant B | 3,558,586 | 690,870 |
| Events in quadrant C | 3,576,355 | 639,272 |
| Events in quadrant D | 4,064,052 | 634,330 |
| Mode M9 | |||
|---|---|---|---|
| Quadrant | BADHDUFLAG | Total packets | Discarded packets |
| A | 0 | 2 | 0 |
| B | 0 | 2 | 0 |
| C | 0 | 2 | 0 |
| D | 0 | 2 | 0 |
| Mode M0 | |||
|---|---|---|---|
| Quadrant | BADHDUFLAG | Total packets | Discarded packets |
| A | 0 | 15288 | 207 |
| B | 0 | 15502 | 193 |
| C | 0 | 15394 | 213 |
| D | 0 | 17345 | 197 |
| Mode SS | |||
|---|---|---|---|
| Quadrant | BADHDUFLAG | Total packets | Discarded packets |
| A | 0 | 152 | 0 |
| B | 0 | 152 | 0 |
| C | 0 | 152 | 0 |
| D | 0 | 152 | 2 |
| Quadrant | Total seconds | Saturated seconds | Saturation percentage |
|---|---|---|---|
| A | 7304 | 50 | 0.684556% |
| B | 7310 | 68 | 0.930233% |
| C | 7302 | 108 | 1.479047% |
| D | 7312 | 91 | 1.244530% |
Noise dominated data is calculated using 1-second bins in cleaned event files. If a bin has >2000 counts, and if more than 50% of those come from <1% of pixels, then it is considered to be noise-dominated and hence unusable.
| Quadrant | # 1 sec bins | Bins with >0 counts | Bins with >2000 counts | High rate bins dominated by noise | Noise dominated (total time) | Noise dominated (detector-on time) | Marked lightcurve |
|---|---|---|---|---|---|---|---|
| A | 7647 | 7334 | 0 | 0 | 0.00% | 0.00% | 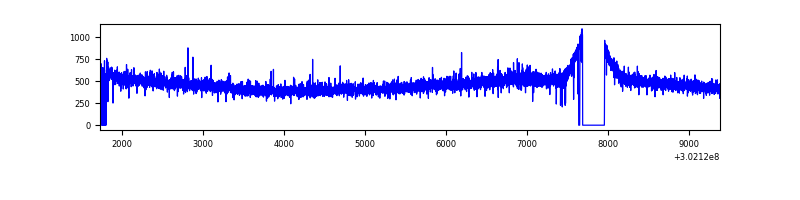 |
| B | 7650 | 7328 | 1 | 1 | 0.01% | 0.01% | 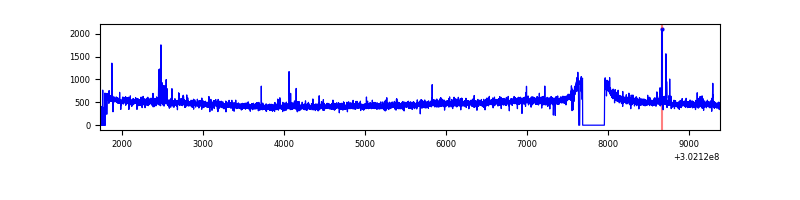 |
| C | 7641 | 7326 | 0 | 0 | 0.00% | 0.00% | 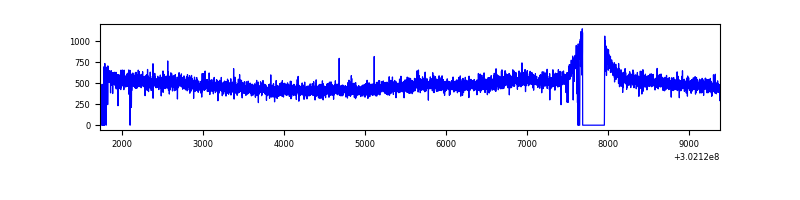 |
| D | 7659 | 7330 | 45 | 45 | 0.59% | 0.61% | 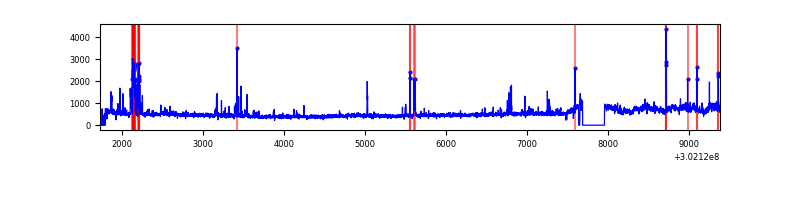 |
Top three noisy pixels from each quadrant. If the there are fewer than three noisy pixels in the level2.evt file, extra rows are filled as -1
| Pixel properties | Quadrant properties | ||||||
|---|---|---|---|---|---|---|---|
| Quadrant | DetID | PixID | Counts | Sigma | Mean | Median | Sigma |
| A | 0 | 226 | 7777 | 38.24 | 892 | 873 | 180.6 |
| A | 3 | 137 | 7442 | 36.38 | 892 | 873 | 180.6 |
| A | 12 | 194 | 6314 | 30.13 | 892 | 873 | 180.6 |
| B | 3 | 64 | 38012 | 216.74 | 890 | 866 | 171.4 |
| B | 12 | 111 | 20926 | 117.05 | 890 | 866 | 171.4 |
| B | 0 | 197 | 18482 | 102.79 | 890 | 866 | 171.4 |
| C | 14 | 238 | 131518 | 646.43 | 851 | 855 | 202.1 |
| C | 7 | 247 | 108306 | 531.59 | 851 | 855 | 202.1 |
| C | 3 | 233 | 21301 | 101.15 | 851 | 855 | 202.1 |
| D | 1 | 20 | 451363 | 2126.98 | 865 | 837 | 211.8 |
| D | 7 | 38 | 145662 | 683.73 | 865 | 837 | 211.8 |
| D | 1 | 52 | 58033 | 270.03 | 865 | 837 | 211.8 |
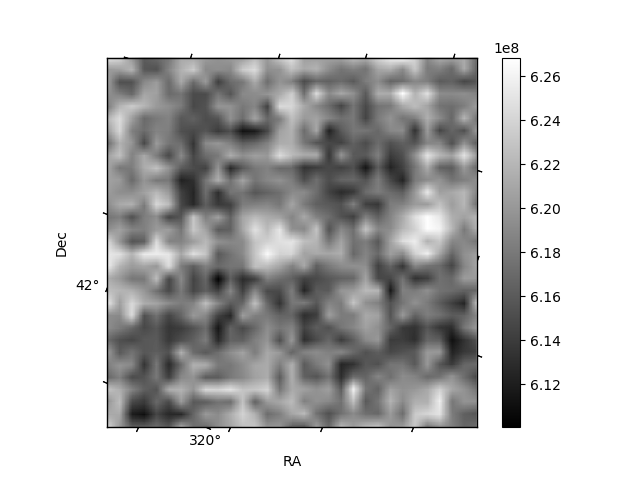
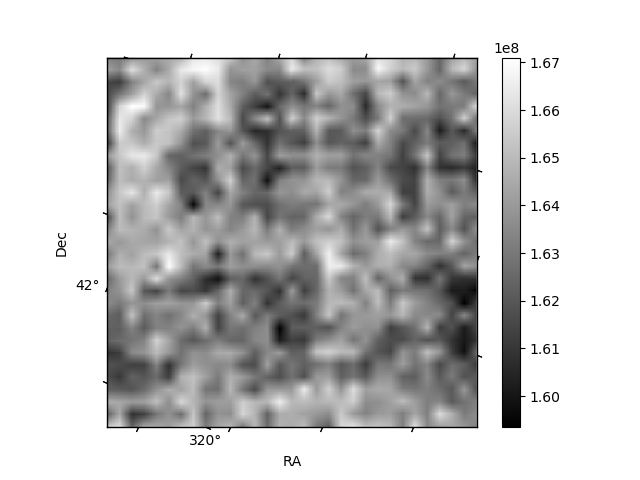
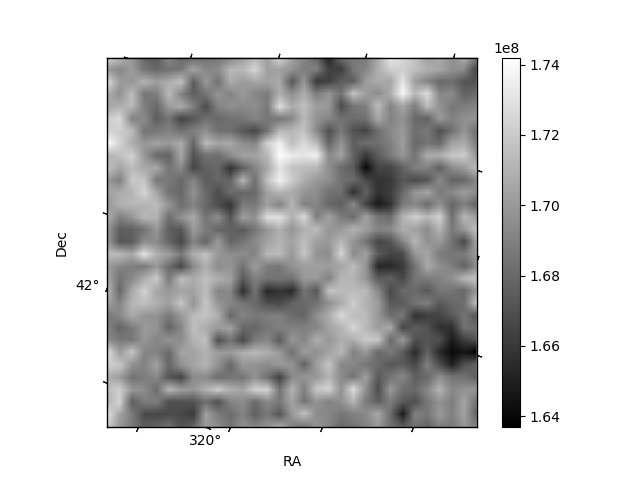
Histogram calculated using DETX and DETY for each event in the final _common_clean file
| Quadrant A | 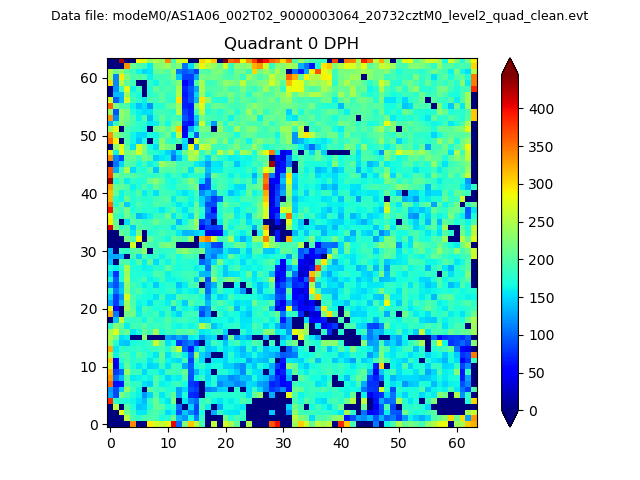 |
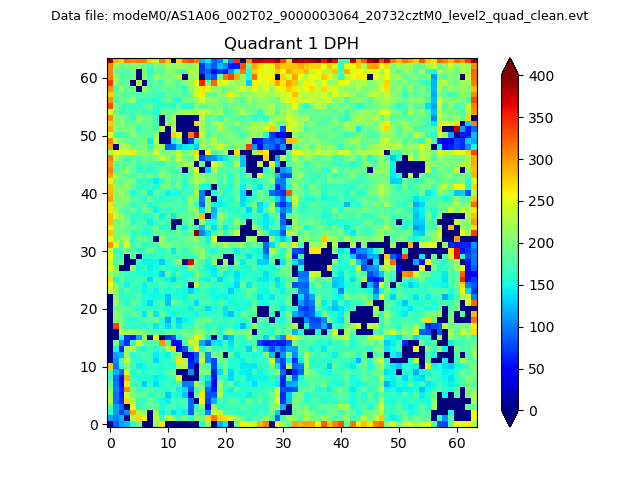 |
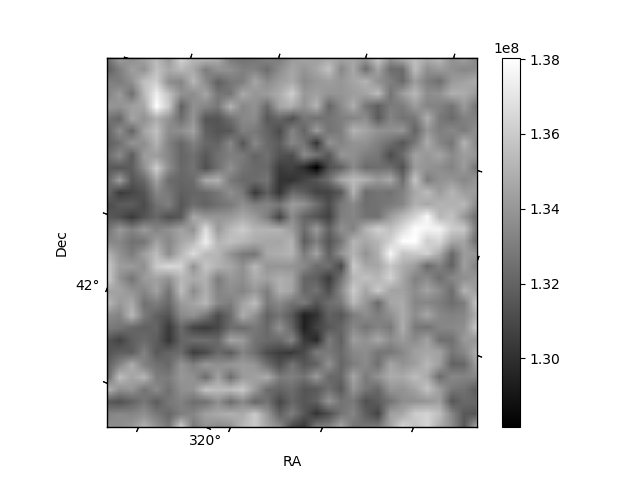
Quadrant B |
|---|---|---|---|
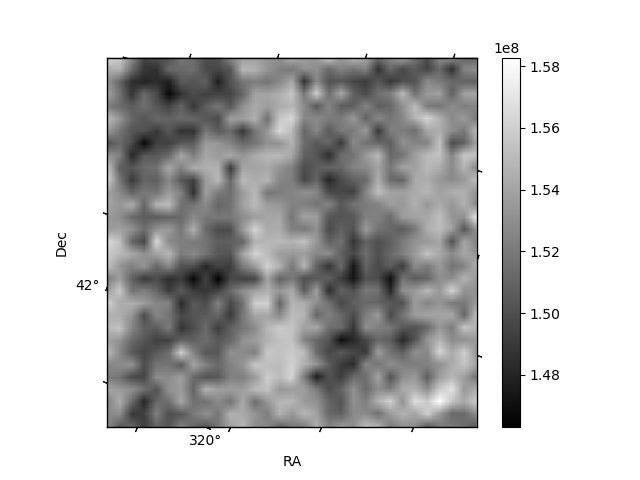
| Quadrant D |  |
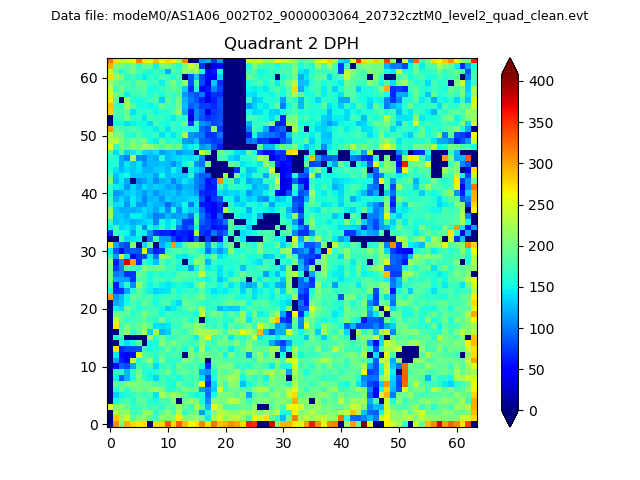 |
Quadrant C |
| Plot type | Count rate plots | Images |
|---|---|---|
| Comparison with Poisson distribution Blue bars denote a histogram of data divided into 1 sec bins. Red curve is a Poisson curve with rate = median count rate of data. |
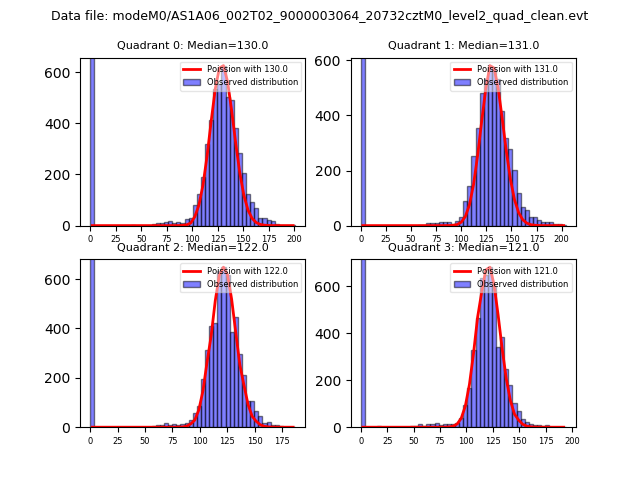 |
 |
| Quadrant-wise count rates Data is divided into 100 sec bins |
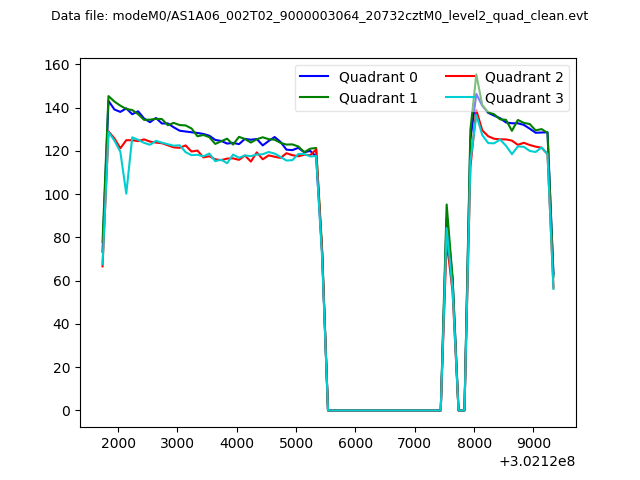 |
|
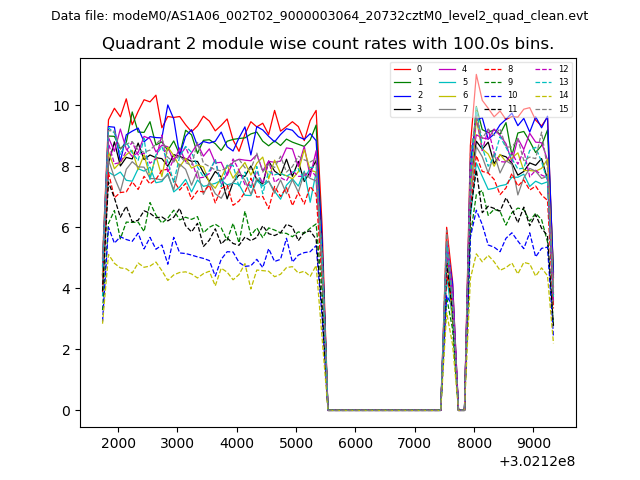
| Module-wise count rates for Quadrant A Data is divided into 100 sec bins |
 |
 |
| Module-wise count rates for Quadrant B Data is divided into 100 sec bins |
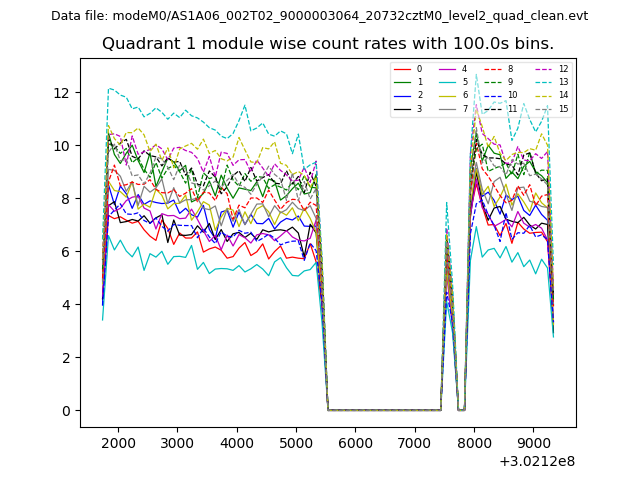 |
 |
| Module-wise count rates for Quadrant C Data is divided into 100 sec bins |
 |
 |
| Module-wise count rates for Quadrant D Data is divided into 100 sec bins |
 |
 |
| Parameter | Plot |
|---|---|
| CZT HV Monitor | 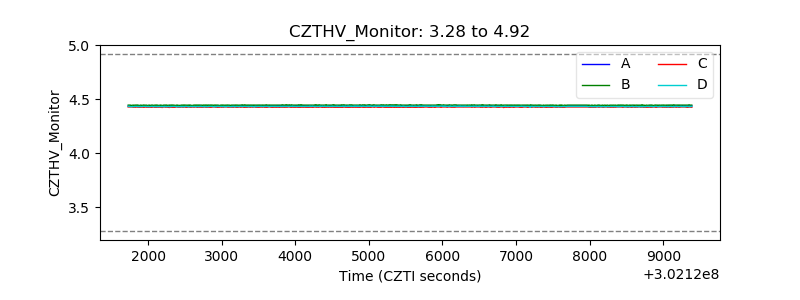 |
| D_VDD | 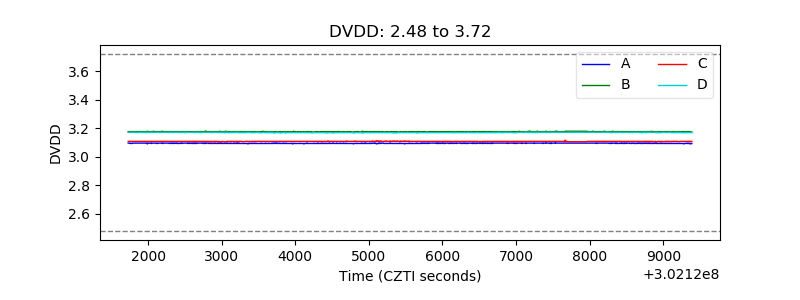 |
| Temperature 1 | 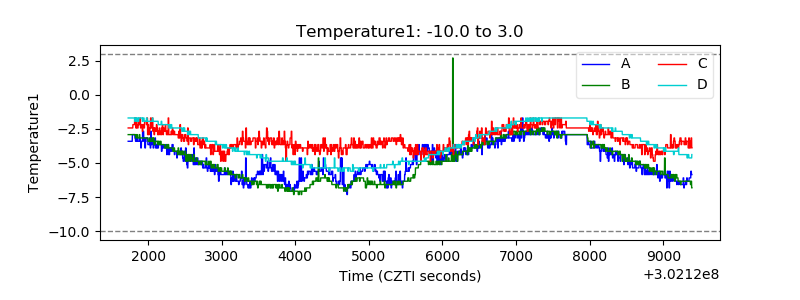 |
| Veto HV Monitor | 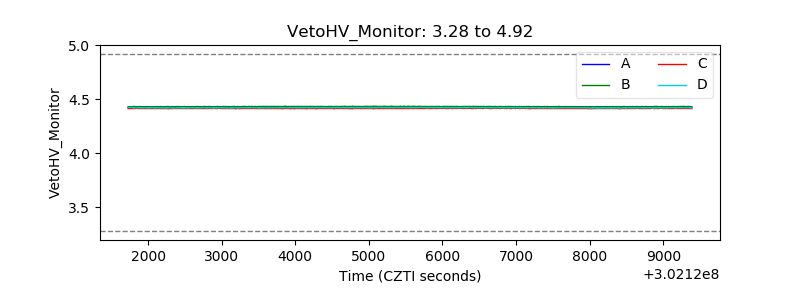 |
| Veto LLD | 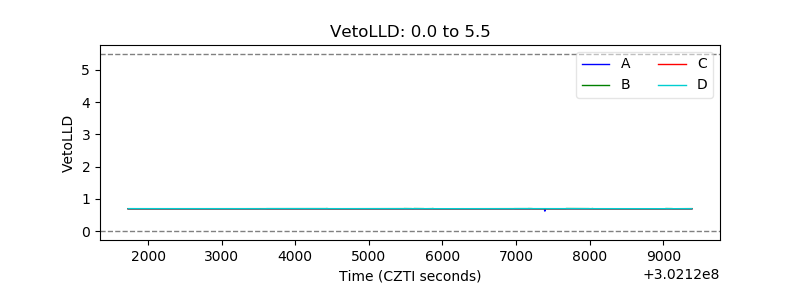 |
| Alpha Counter | 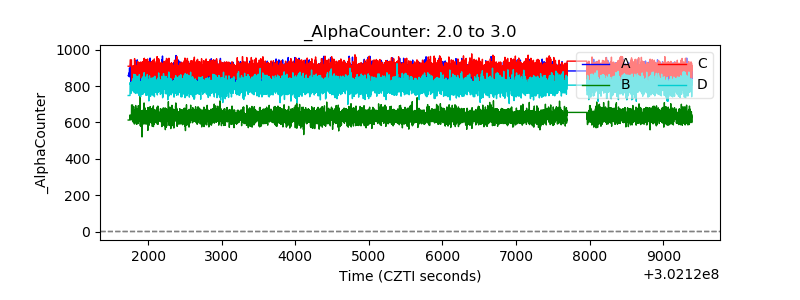 |
| _CPM_Rate |  |
| CZT Counter | 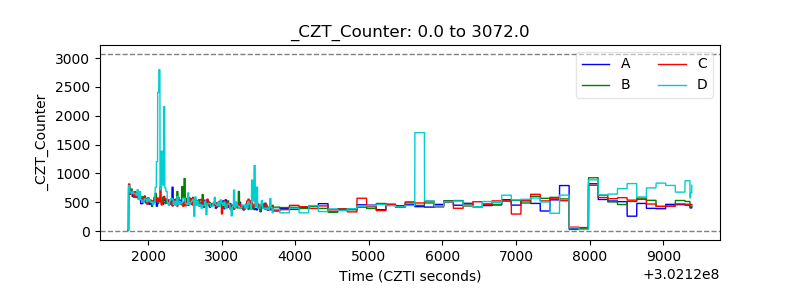 |
| +2.5 Volts monitor | 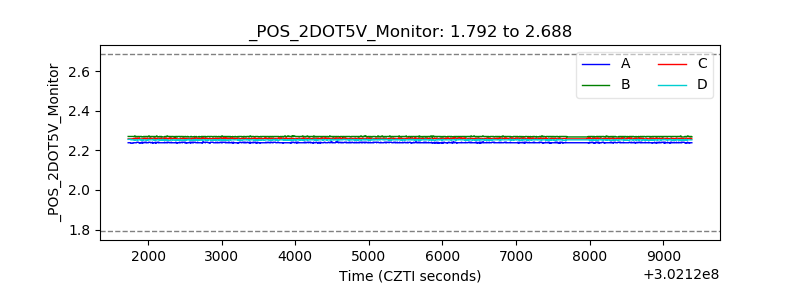 |
| +5 Volts monitor |  |
| _ROLL_ROT | 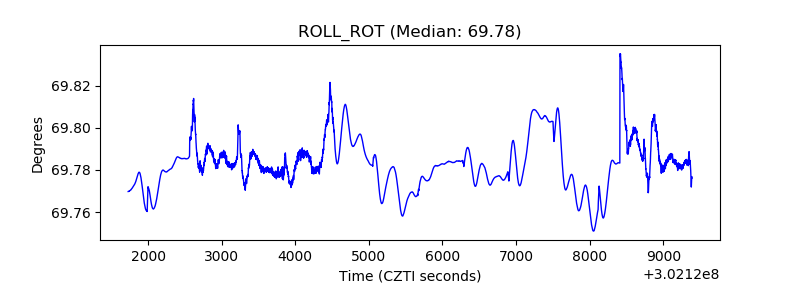 |
| _Roll_DEC | 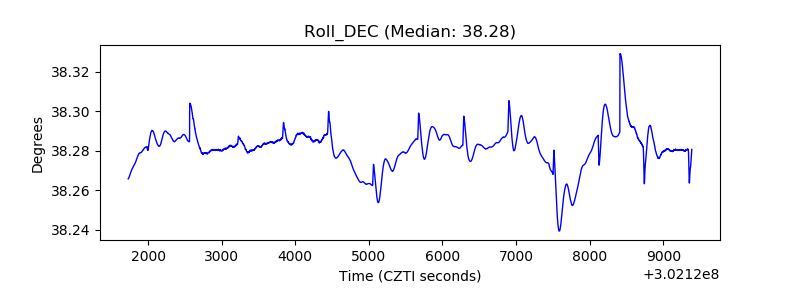 |
| _Roll_RA | 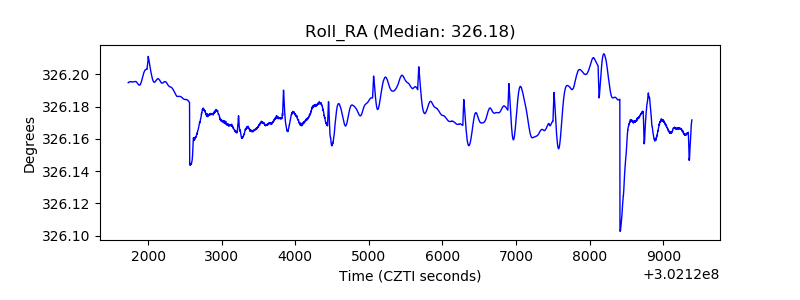 |
| Veto Counter |  |