| Param | Original file | Final file |
|---|---|---|
| Filename | modeM0/AS1A06_002T02_9000003064_20737cztM0_level2.evt | modeM0/AS1A06_002T02_9000003064_20737cztM0_level2_quad_clean.evt |
| Size (bytes) | 1,923,166,080 | 341,280,000 |
| Size | 1.8 GB | 325.5 MB |
| Events in quadrant A | 12,668,178 | 2,184,523 |
| Events in quadrant B | 13,107,341 | 2,200,424 |
| Events in quadrant C | 13,190,931 | 2,053,512 |
| Events in quadrant D | 17,435,308 | 2,023,210 |
| Mode M9 | |||
|---|---|---|---|
| Quadrant | BADHDUFLAG | Total packets | Discarded packets |
| A | 0 | 25 | 0 |
| B | 0 | 25 | 0 |
| C | 0 | 25 | 0 |
| D | 0 | 25 | 0 |
| Mode M0 | |||
|---|---|---|---|
| Quadrant | BADHDUFLAG | Total packets | Discarded packets |
| A | 0 | 56194 | 6 |
| B | 0 | 56988 | 6 |
| C | 0 | 56605 | 6 |
| D | 0 | 70425 | 6 |
| Mode SS | |||
|---|---|---|---|
| Quadrant | BADHDUFLAG | Total packets | Discarded packets |
| A | 0 | 558 | 0 |
| B | 0 | 558 | 0 |
| C | 0 | 558 | 0 |
| D | 0 | 558 | 0 |
| Quadrant | Total seconds | Saturated seconds | Saturation percentage |
|---|---|---|---|
| A | 27263 | 192 | 0.704251% |
| B | 27263 | 300 | 1.100392% |
| C | 27263 | 388 | 1.423174% |
| D | 27263 | 554 | 2.032058% |
Noise dominated data is calculated using 1-second bins in cleaned event files. If a bin has >2000 counts, and if more than 50% of those come from <1% of pixels, then it is considered to be noise-dominated and hence unusable.
| Quadrant | # 1 sec bins | Bins with >0 counts | Bins with >2000 counts | High rate bins dominated by noise | Noise dominated (total time) | Noise dominated (detector-on time) | Marked lightcurve |
|---|---|---|---|---|---|---|---|
| A | 29878 | 27269 | 4 | 4 | 0.01% | 0.01% | 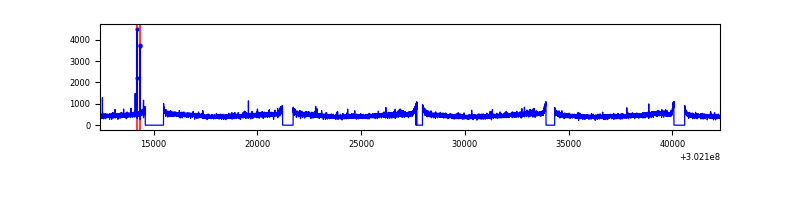 |
| B | 29878 | 27269 | 26 | 26 | 0.09% | 0.10% | 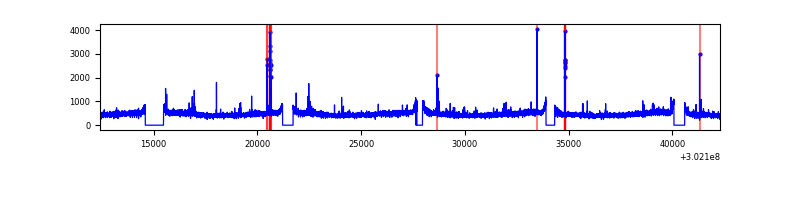 |
| C | 29878 | 27269 | 1 | 1 | 0.00% | 0.00% | 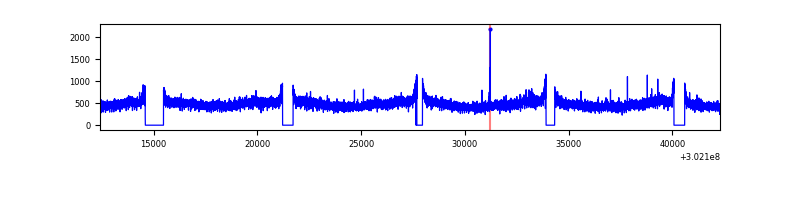 |
| D | 29878 | 27268 | 248 | 248 | 0.83% | 0.91% | 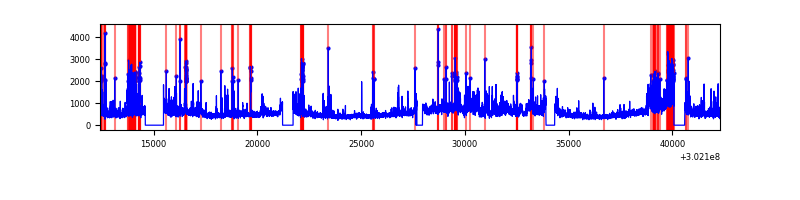 |
Top three noisy pixels from each quadrant. If the there are fewer than three noisy pixels in the level2.evt file, extra rows are filled as -1
| Pixel properties | Quadrant properties | ||||||
|---|---|---|---|---|---|---|---|
| Quadrant | DetID | PixID | Counts | Sigma | Mean | Median | Sigma |
| A | 0 | 226 | 28387 | 38.11 | 3286 | 3218 | 660.4 |
| A | 3 | 137 | 27711 | 37.09 | 3286 | 3218 | 660.4 |
| A | 6 | 240 | 24713 | 32.55 | 3286 | 3218 | 660.4 |
| B | 3 | 64 | 183033 | 289.41 | 3269 | 3188 | 621.4 |
| B | 12 | 111 | 77331 | 119.31 | 3269 | 3188 | 621.4 |
| B | 11 | 111 | 67364 | 103.27 | 3269 | 3188 | 621.4 |
| C | 14 | 238 | 484188 | 660.09 | 3124 | 3148 | 728.8 |
| C | 7 | 247 | 392261 | 533.94 | 3124 | 3148 | 728.8 |
| C | 3 | 233 | 129984 | 174.05 | 3124 | 3148 | 728.8 |
| D | 1 | 20 | 2418504 | 3166.21 | 3162 | 3071 | 762.9 |
| D | 1 | 52 | 1975394 | 2585.37 | 3162 | 3071 | 762.9 |
| D | 5 | 222 | 341531 | 443.66 | 3162 | 3071 | 762.9 |
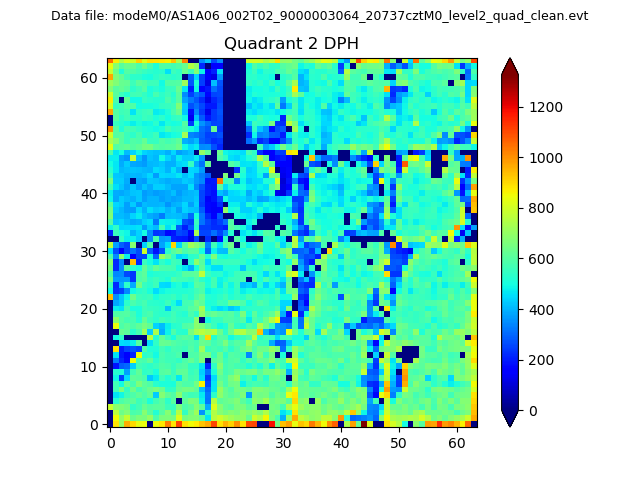
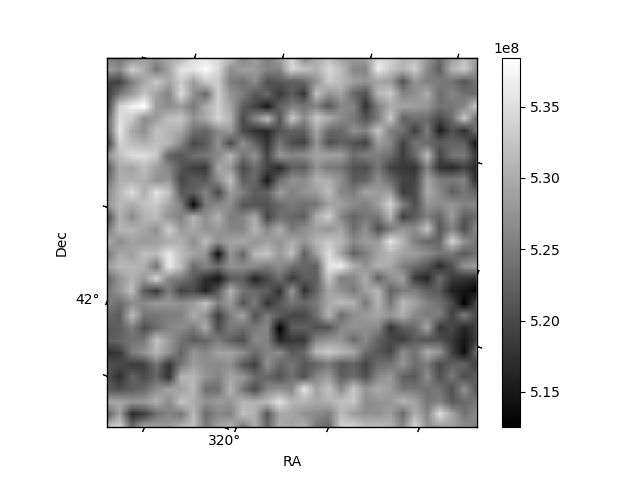
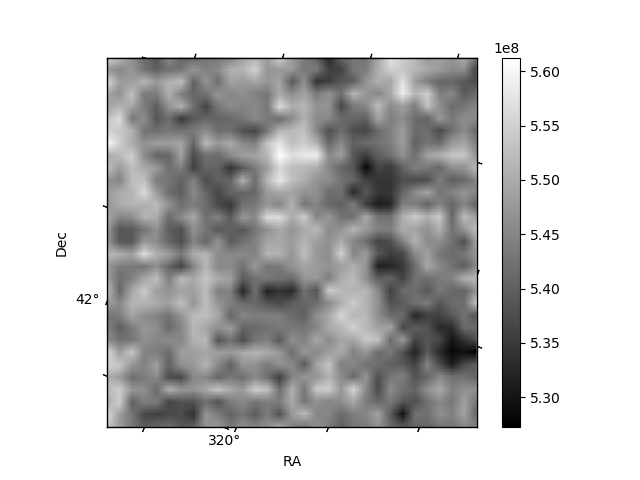
Histogram calculated using DETX and DETY for each event in the final _common_clean file
| Quadrant A |  |
 |
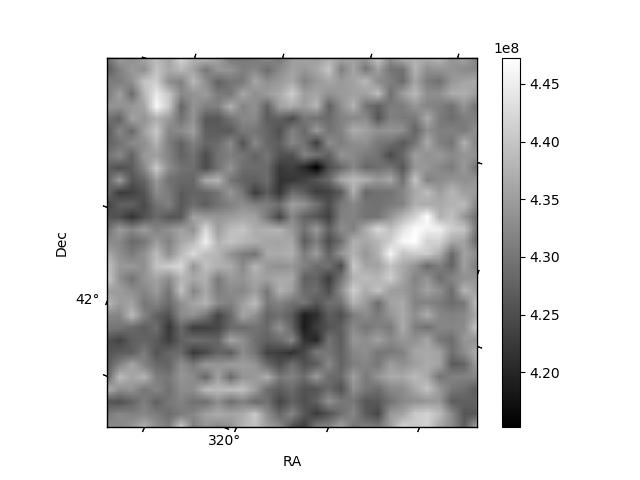
Quadrant B |
|---|---|---|---|
| Quadrant D | 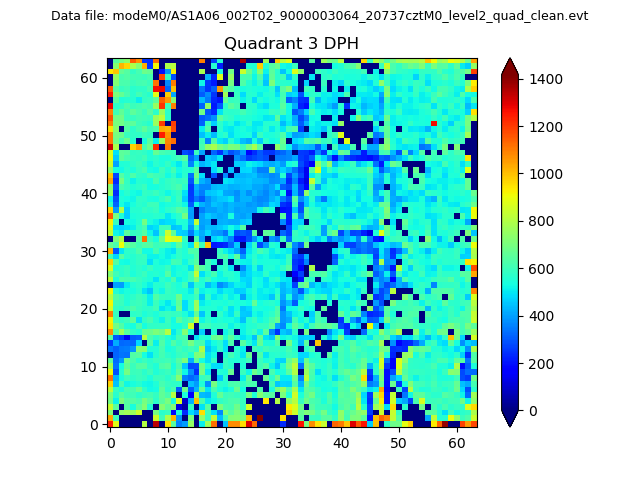 |
 |
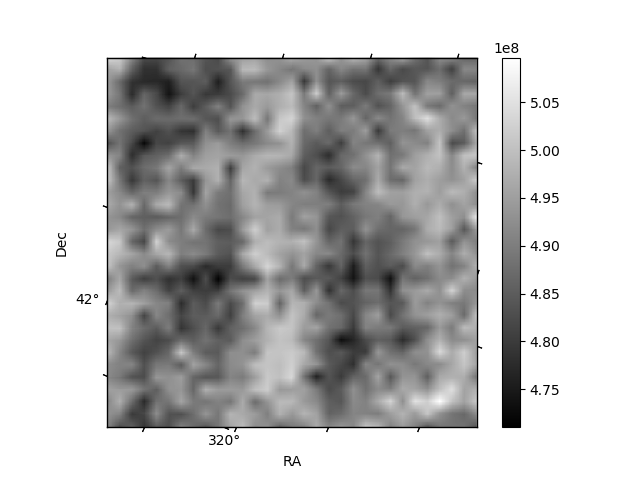
Quadrant C |
| Plot type | Count rate plots | Images |
|---|---|---|
| Comparison with Poisson distribution Blue bars denote a histogram of data divided into 1 sec bins. Red curve is a Poisson curve with rate = median count rate of data. |
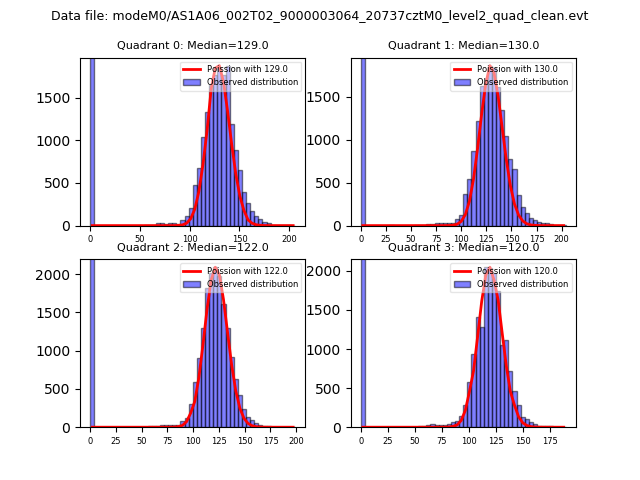 |
 |
| Quadrant-wise count rates Data is divided into 100 sec bins |
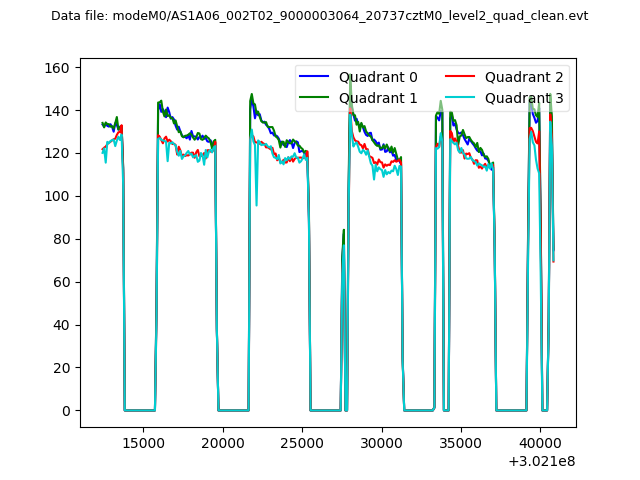 |
|
| Module-wise count rates for Quadrant A Data is divided into 100 sec bins |
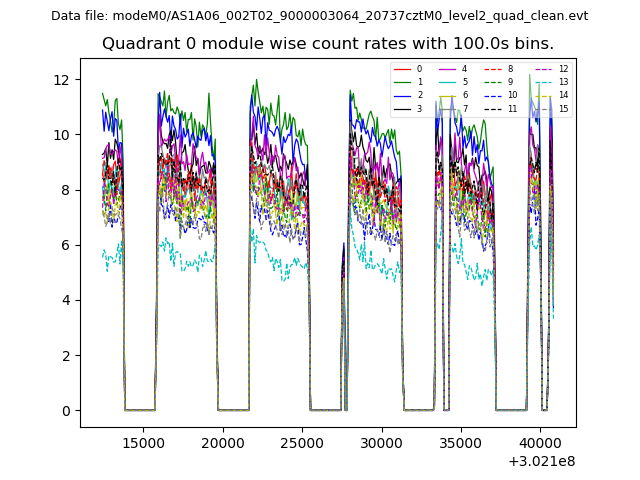 |
 |
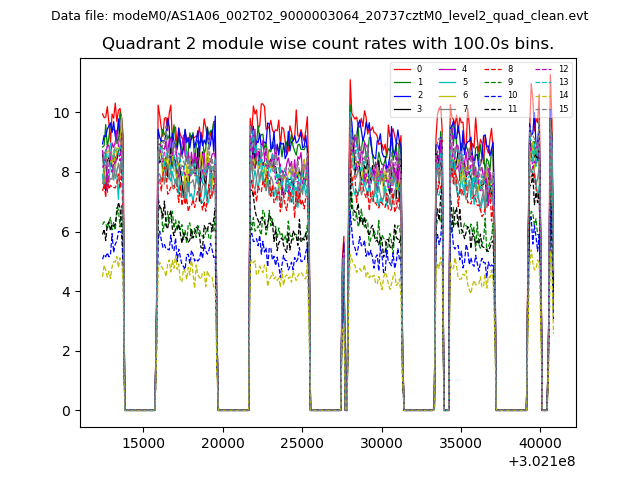
| Module-wise count rates for Quadrant B Data is divided into 100 sec bins |
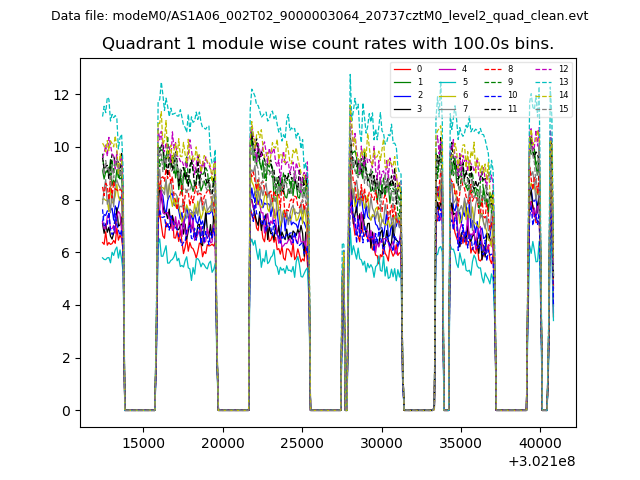 |
 |
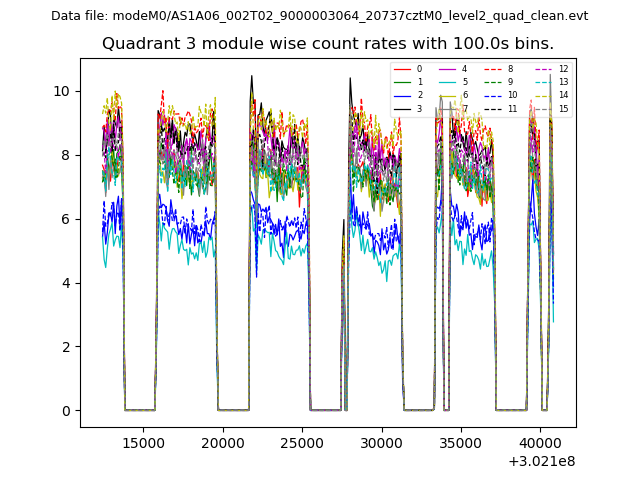
| Module-wise count rates for Quadrant C Data is divided into 100 sec bins |
 |
 |
| Module-wise count rates for Quadrant D Data is divided into 100 sec bins |
 |
 |
| Parameter | Plot |
|---|---|
| CZT HV Monitor | 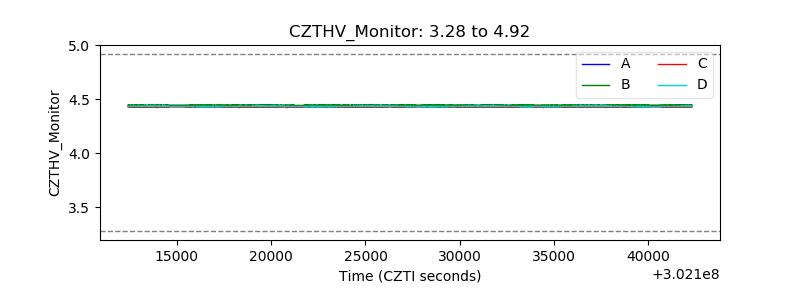 |
| D_VDD | 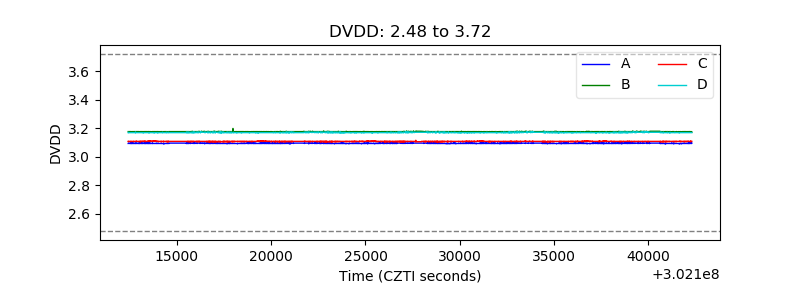 |
| Temperature 1 | 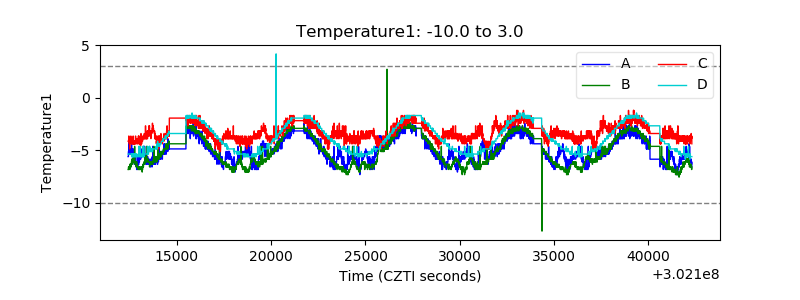 |
| Veto HV Monitor | 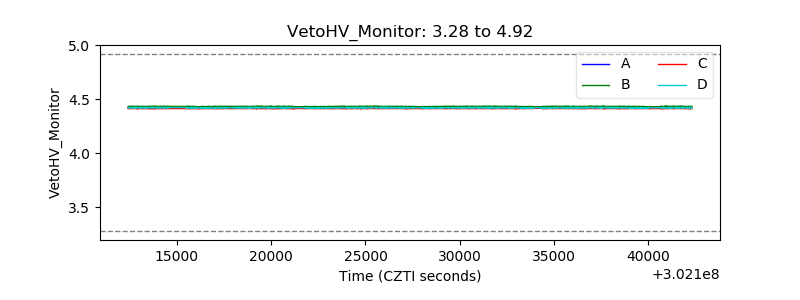 |
| Veto LLD | 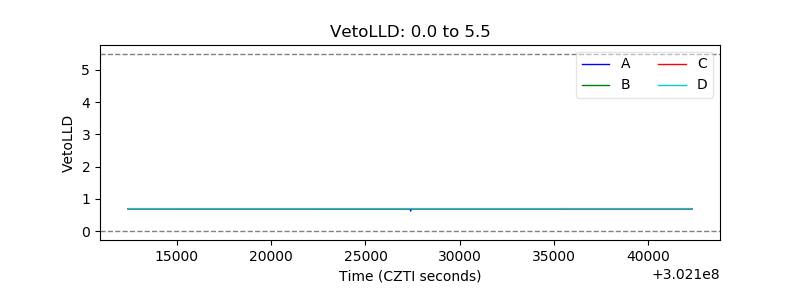 |
| Alpha Counter | 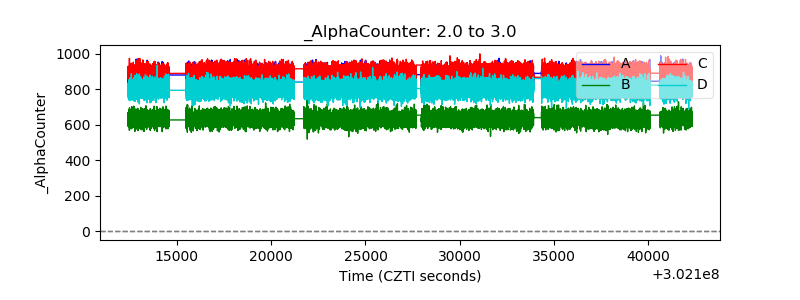 |
| _CPM_Rate | 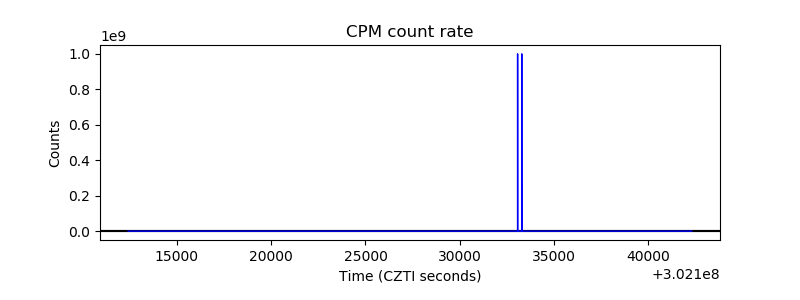 |
| CZT Counter |  |
| +2.5 Volts monitor |  |
| +5 Volts monitor | 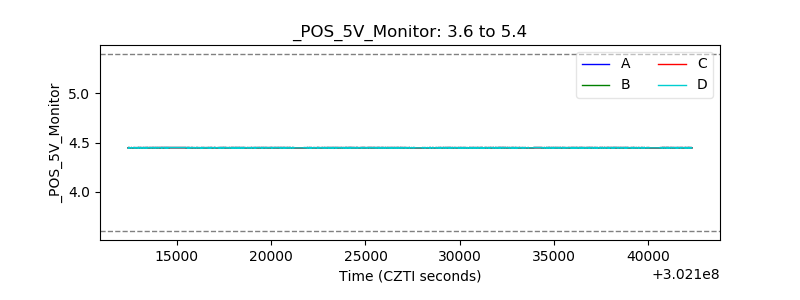 |
| _ROLL_ROT | 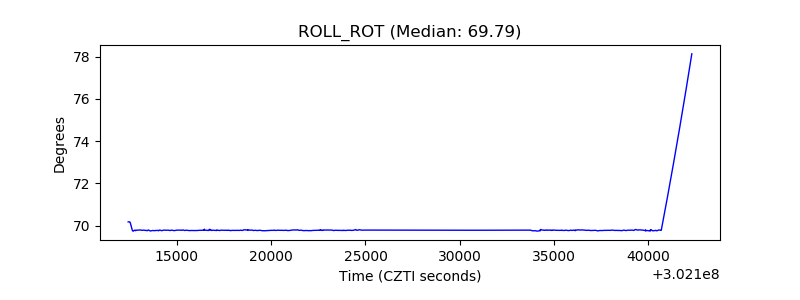 |
| _Roll_DEC | 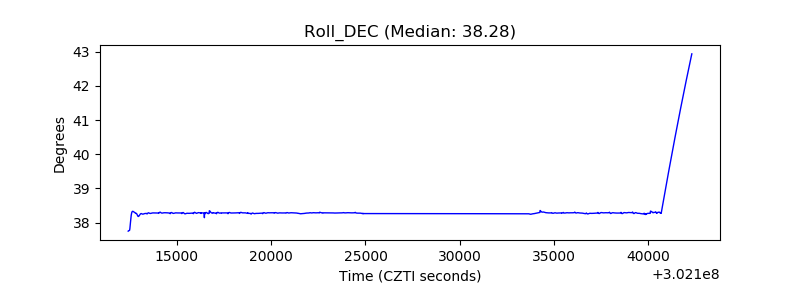 |
| _Roll_RA |  |
| Veto Counter | 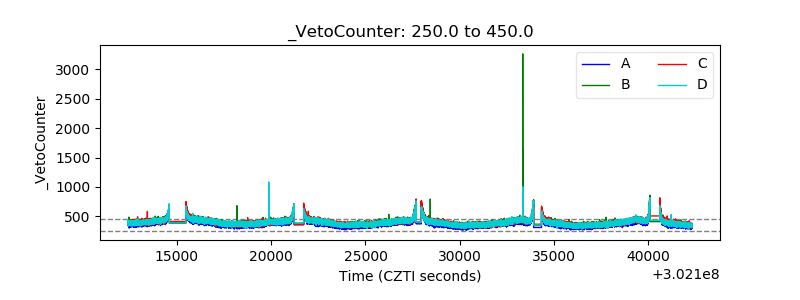 |