| Param | Original file | Final file |
|---|---|---|
| Filename | modeM0/AS1A05_063T03_9000003066cztM0_level2.fits | modeM0/AS1A05_063T03_9000003066cztM0_level2_quad_clean.evt |
| Size (bytes) | 573,963,840 | 231,528,960 |
| Size | 547.4 MB | 220.8 MB |
| Events in quadrant A | 3,682,278 | 841,379 |
| Events in quadrant B | 3,442,836 | 813,757 |
| Events in quadrant C | 3,348,912 | 794,711 |
| Events in quadrant D | 3,058,702 | 705,486 |
| Mode M0 | |||
|---|---|---|---|
| Quadrant | BADHDUFLAG | Total packets | Discarded packets |
| A | 0 | 118829 | 0 |
| B | 0 | 125185 | 0 |
| C | 0 | 118168 | 0 |
| D | 0 | 153771 | 0 |
| Mode SS | |||
|---|---|---|---|
| Quadrant | BADHDUFLAG | Total packets | Discarded packets |
| A | 0 | 1148 | 0 |
| B | 0 | 1146 | 0 |
| C | 0 | 1145 | 0 |
| D | 0 | 1146 | 0 |
| Mode M9 | |||
|---|---|---|---|
| Quadrant | BADHDUFLAG | Total packets | Discarded packets |
| A | 0 | 109 | 0 |
| B | 0 | 109 | 0 |
| C | 0 | 109 | 0 |
| D | 0 | 109 | 0 |
| Quadrant | Total seconds | Saturated seconds | Saturation percentage |
|---|---|---|---|
| A | 56152 | 700 | 1.246616% |
| B | 56079 | 1103 | 1.966868% |
| C | 56144 | 950 | 1.692078% |
| D | 56058 | 2513 | 4.482857% |
Noise dominated data is calculated using 1-second bins in cleaned event files. If a bin has >2000 counts, and if more than 50% of those come from <1% of pixels, then it is considered to be noise-dominated and hence unusable.
| Quadrant | # 1 sec bins | Bins with >0 counts | Bins with >2000 counts | High rate bins dominated by noise | Noise dominated (total time) | Noise dominated (detector-on time) | Marked lightcurve |
|---|---|---|---|---|---|---|---|
| A | 67620 | 56326 | 0 | 0 | 0.00% | 0.00% |  |
| B | 67621 | 56220 | 0 | 0 | 0.00% | 0.00% |  |
| C | 67621 | 56290 | 0 | 0 | 0.00% | 0.00% | 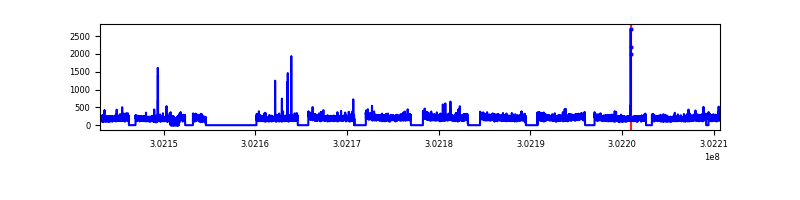 |
| D | 67621 | 56177 | 0 | 0 | 0.00% | 0.00% |  |
Top three noisy pixels from each quadrant. If the there are fewer than three noisy pixels in the level2.evt file, extra rows are filled as -1
| Pixel properties | Quadrant properties | ||||||
|---|---|---|---|---|---|---|---|
| Quadrant | DetID | PixID | Counts | Sigma | Mean | Median | Sigma |
| A | 0 | 29 | 3557 | 11.42 | 958 | 901 | 232.7 |
| A | 7 | 110 | 2967 | 8.88 | 958 | 901 | 232.7 |
| A | 0 | 30 | 2835 | 8.31 | 958 | 901 | 232.7 |
| B | 2 | 9 | 2642 | 9.95 | 911 | 871 | 178.0 |
| B | 2 | 8 | 2262 | 7.82 | 911 | 871 | 178.0 |
| B | 3 | 17 | 2251 | 7.75 | 911 | 871 | 178.0 |
| C | 1 | 81 | 2594 | 8.66 | 888 | 855 | 200.7 |
| C | 3 | 203 | 2090 | 6.15 | 888 | 855 | 200.7 |
| C | 12 | 249 | 2083 | 6.12 | 888 | 855 | 200.7 |
| D | 13 | 238 | 2200 | 6.06 | 874 | 799 | 231.0 |
| D | 6 | 231 | 2160 | 5.89 | 874 | 799 | 231.0 |
| D | 6 | 38 | 2140 | 5.8 | 874 | 799 | 231.0 |
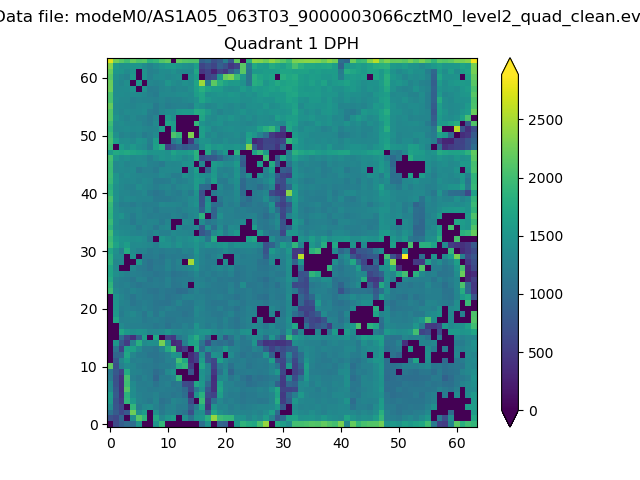
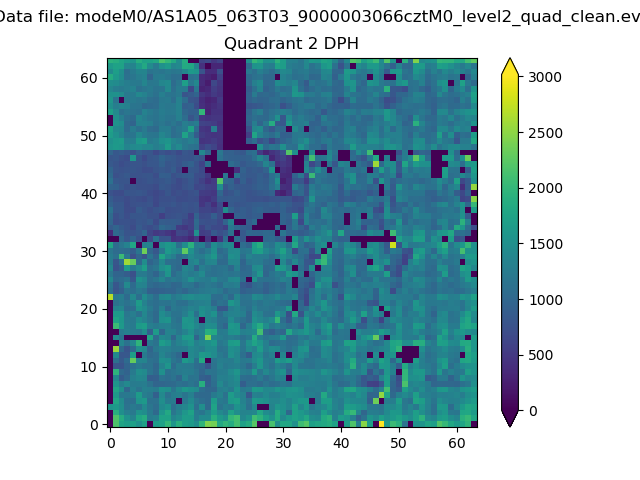
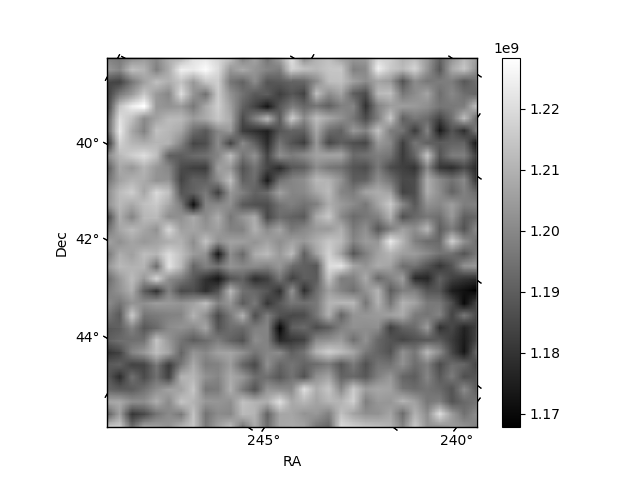
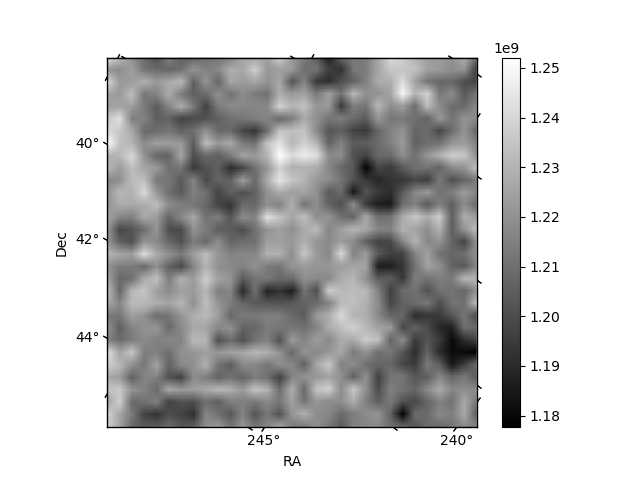
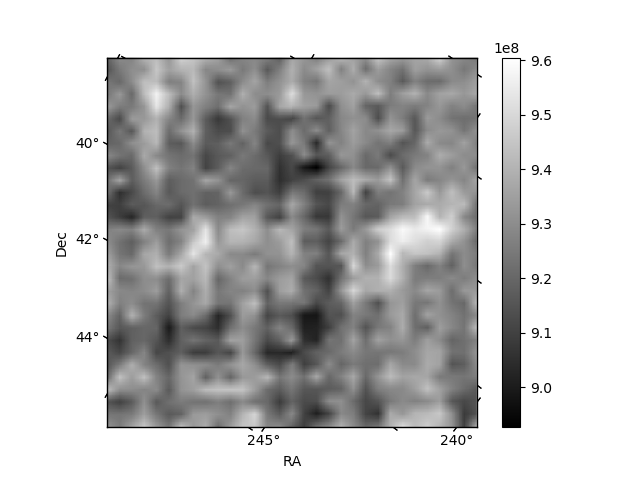
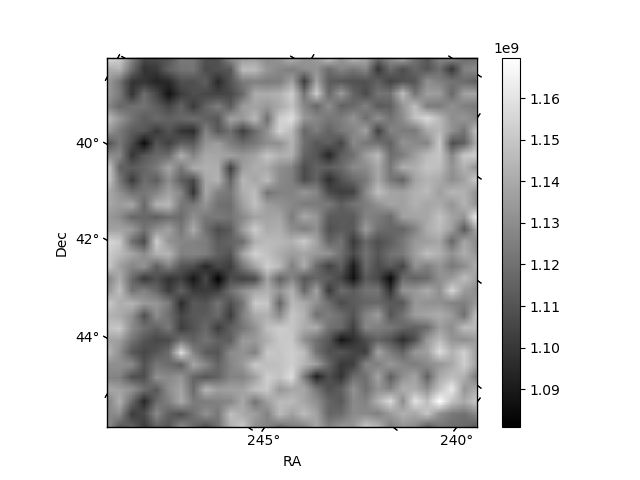
Histogram calculated using DETX and DETY for each event in the final _common_clean file
| Quadrant A |  |
 |
Quadrant B |
|---|---|---|---|
| Quadrant D | 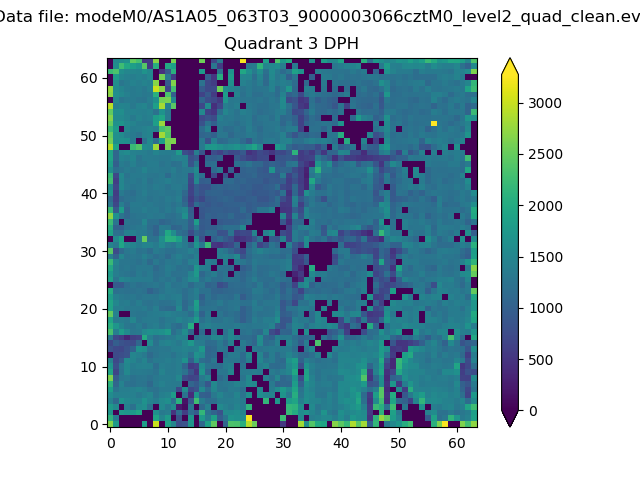 |
 |
Quadrant C |
| Plot type | Count rate plots | Images |
|---|---|---|
| Comparison with Poisson distribution Blue bars denote a histogram of data divided into 1 sec bins. Red curve is a Poisson curve with rate = median count rate of data. |
 |
 |
| Quadrant-wise count rates Data is divided into 100 sec bins |
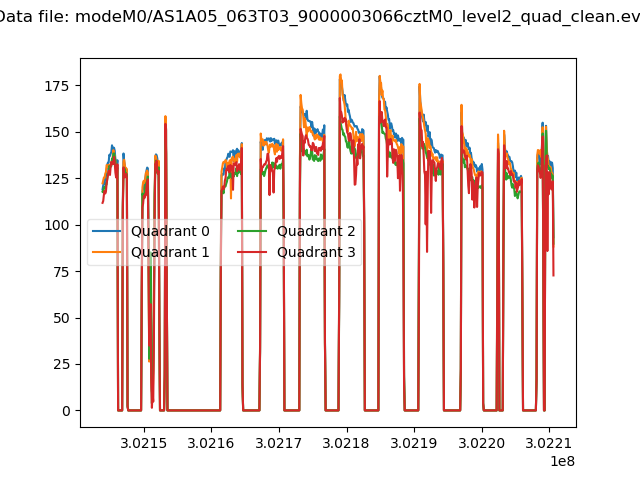 |
|
| Module-wise count rates for Quadrant A Data is divided into 100 sec bins |
 |
 |
| Module-wise count rates for Quadrant B Data is divided into 100 sec bins |
 |
 |
| Module-wise count rates for Quadrant C Data is divided into 100 sec bins |
 |
 |
| Module-wise count rates for Quadrant D Data is divided into 100 sec bins |
 |
 |
| Parameter | Plot |
|---|---|
| CZT HV Monitor | 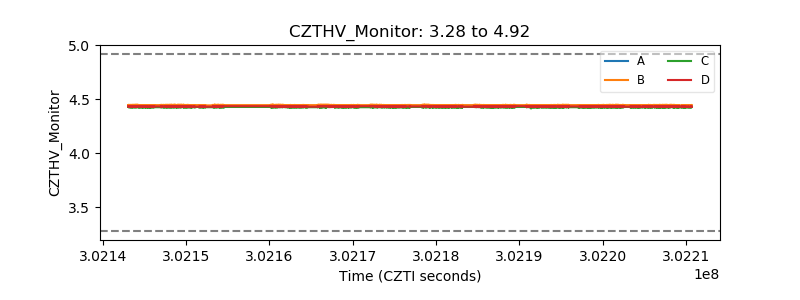 |
| D_VDD |  |
| Temperature 1 |  |
| Veto HV Monitor |  |
| Veto LLD | 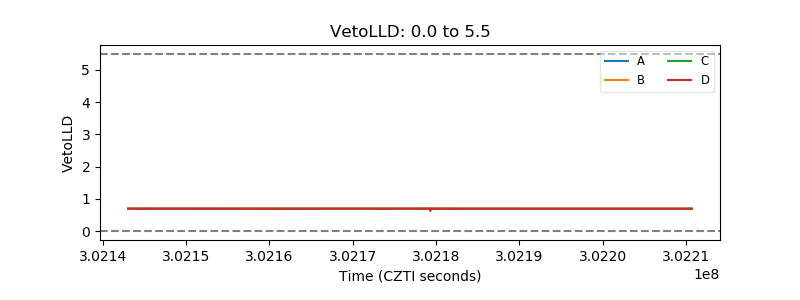 |
| Alpha Counter | 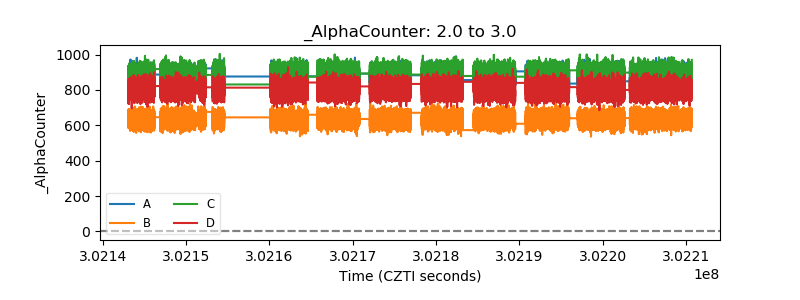 |
| _CPM_Rate | 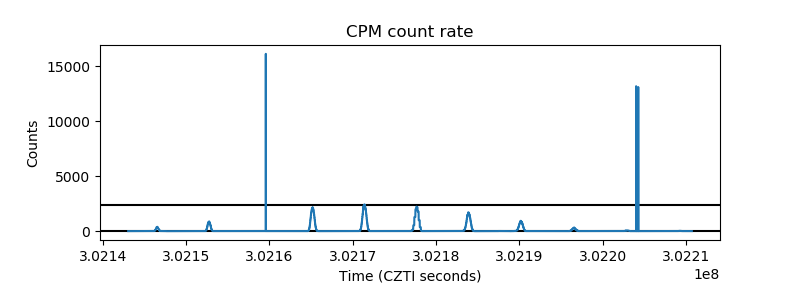 |
| CZT Counter |  |
| +2.5 Volts monitor | 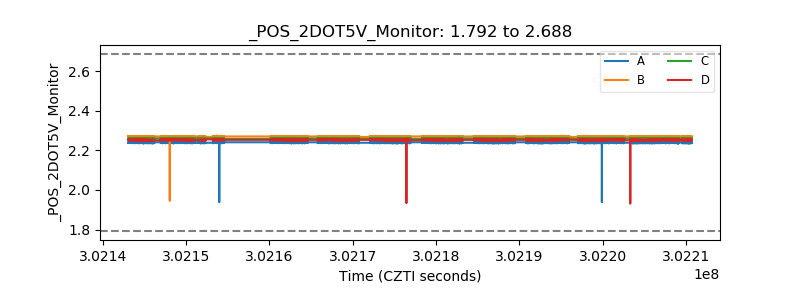 |
| +5 Volts monitor |  |
| _ROLL_ROT |  |
| _Roll_DEC |  |
| _Roll_RA |  |
| Veto Counter |  |