| Param | Original file | Final file |
|---|---|---|
| Filename | modeM0/AS1A05_063T03_9000003066_20736cztM0_level2.evt | modeM0/AS1A05_063T03_9000003066_20736cztM0_level2_quad_clean.evt |
| Size (bytes) | 652,832,640 | 110,280,960 |
| Size | 622.6 MB | 105.2 MB |
| Events in quadrant A | 4,379,969 | 694,596 |
| Events in quadrant B | 4,646,321 | 681,177 |
| Events in quadrant C | 4,487,729 | 667,297 |
| Events in quadrant D | 5,625,913 | 650,791 |
| Mode M0 | |||
|---|---|---|---|
| Quadrant | BADHDUFLAG | Total packets | Discarded packets |
| A | 0 | 20216 | 1215 |
| B | 0 | 21580 | 1862 |
| C | 0 | 20419 | 1223 |
| D | 0 | 25142 | 2208 |
| Mode SS | |||
|---|---|---|---|
| Quadrant | BADHDUFLAG | Total packets | Discarded packets |
| A | 0 | 204 | 10 |
| B | 0 | 204 | 12 |
| C | 0 | 203 | 12 |
| D | 0 | 204 | 12 |
| Mode M9 | |||
|---|---|---|---|
| Quadrant | BADHDUFLAG | Total packets | Discarded packets |
| A | 0 | 16 | 0 |
| B | 0 | 16 | 0 |
| C | 0 | 16 | 0 |
| D | 0 | 16 | 0 |
| Quadrant | Total seconds | Saturated seconds | Saturation percentage |
|---|---|---|---|
| A | 9344 | 70 | 0.749144% |
| B | 9273 | 130 | 1.401920% |
| C | 9335 | 114 | 1.221210% |
| D | 9250 | 126 | 1.362162% |
Noise dominated data is calculated using 1-second bins in cleaned event files. If a bin has >2000 counts, and if more than 50% of those come from <1% of pixels, then it is considered to be noise-dominated and hence unusable.
| Quadrant | # 1 sec bins | Bins with >0 counts | Bins with >2000 counts | High rate bins dominated by noise | Noise dominated (total time) | Noise dominated (detector-on time) | Marked lightcurve |
|---|---|---|---|---|---|---|---|
| A | 11526 | 9524 | 0 | 0 | 0.00% | 0.00% | 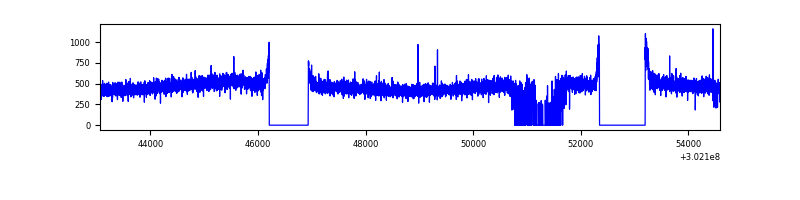 |
| B | 11527 | 9420 | 15 | 15 | 0.13% | 0.16% | 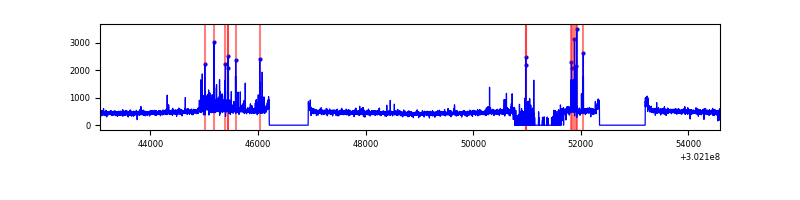 |
| C | 11527 | 9490 | 5 | 5 | 0.04% | 0.05% | 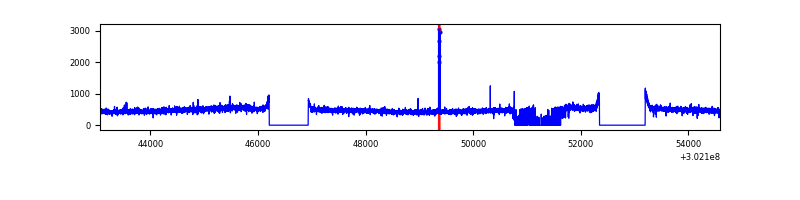 |
| D | 11527 | 9391 | 74 | 74 | 0.64% | 0.79% | 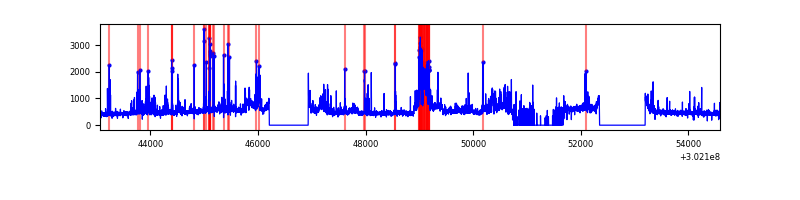 |
Top three noisy pixels from each quadrant. If the there are fewer than three noisy pixels in the level2.evt file, extra rows are filled as -1
| Pixel properties | Quadrant properties | ||||||
|---|---|---|---|---|---|---|---|
| Quadrant | DetID | PixID | Counts | Sigma | Mean | Median | Sigma |
| A | 0 | 226 | 9810 | 37.87 | 1139 | 1114 | 229.6 |
| A | 3 | 137 | 9530 | 36.65 | 1139 | 1114 | 229.6 |
| A | 12 | 194 | 8134 | 30.57 | 1139 | 1114 | 229.6 |
| B | 7 | 220 | 162192 | 746.67 | 1118 | 1086 | 215.8 |
| B | 0 | 197 | 38879 | 175.16 | 1118 | 1086 | 215.8 |
| B | 12 | 111 | 26558 | 118.05 | 1118 | 1086 | 215.8 |
| C | 14 | 238 | 168418 | 656.04 | 1090 | 1098 | 255.0 |
| C | 3 | 233 | 34998 | 132.92 | 1090 | 1098 | 255.0 |
| C | 9 | 54 | 26964 | 101.42 | 1090 | 1098 | 255.0 |
| D | 1 | 20 | 705620 | 2627.16 | 1096 | 1063 | 268.2 |
| D | 1 | 52 | 290094 | 1077.74 | 1096 | 1063 | 268.2 |
| D | 5 | 222 | 255125 | 947.35 | 1096 | 1063 | 268.2 |
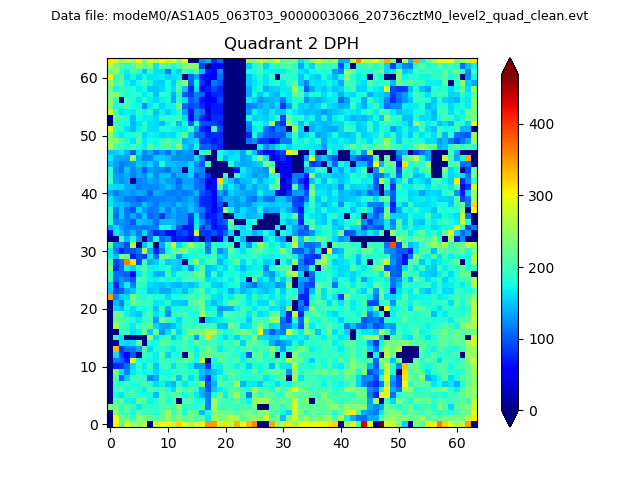
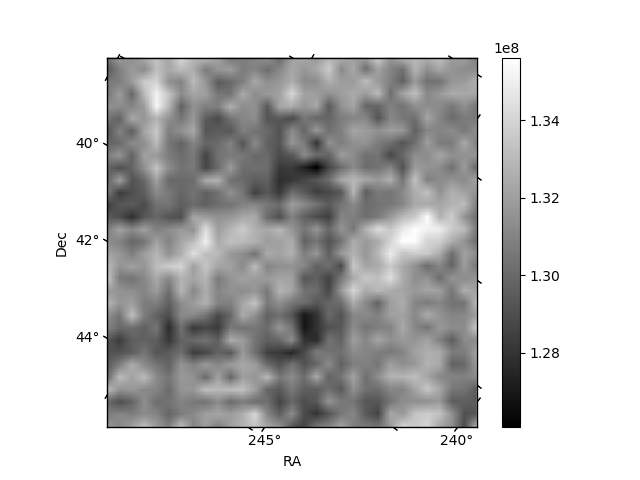
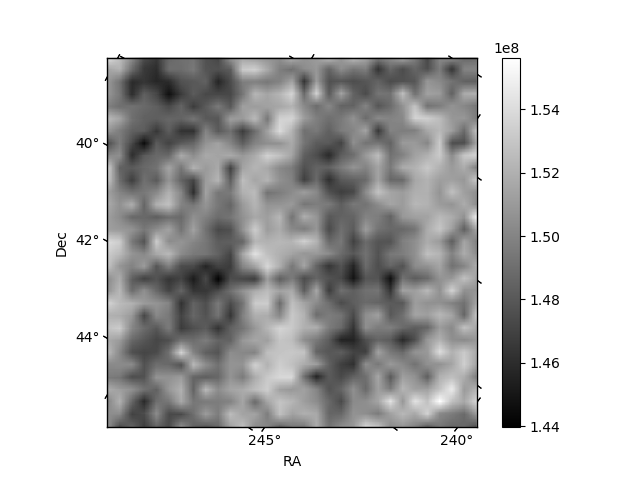
Histogram calculated using DETX and DETY for each event in the final _common_clean file
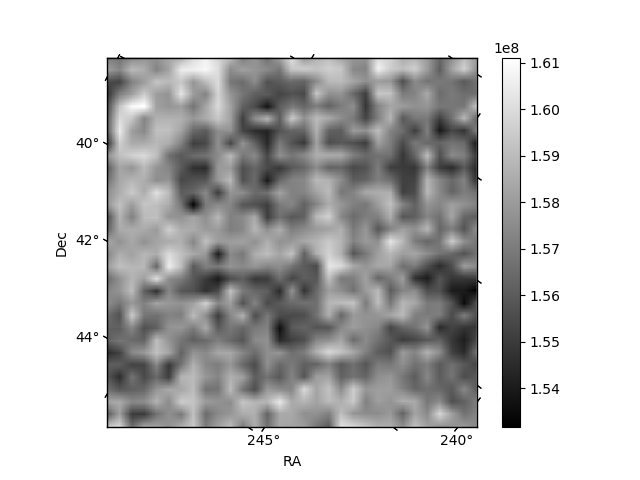
| Quadrant A |  |
 |
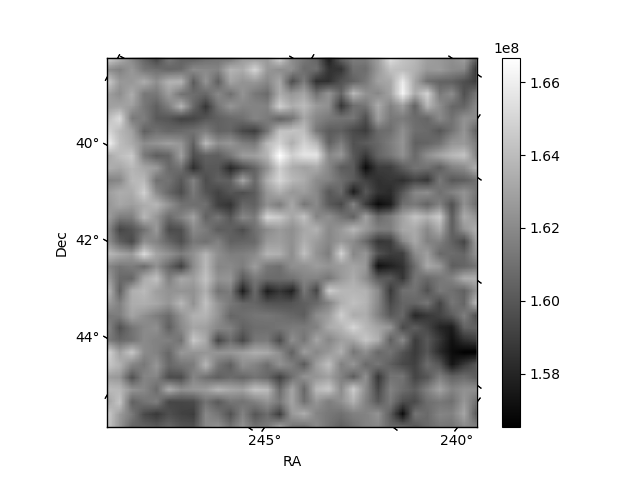
Quadrant B |
|---|---|---|---|
| Quadrant D | 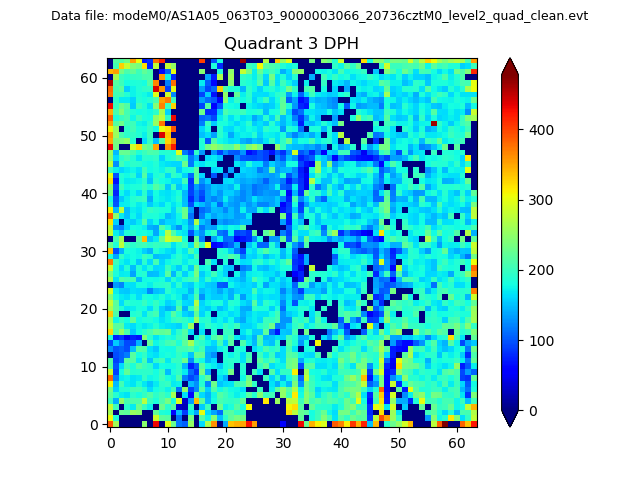 |
 |
Quadrant C |
| Plot type | Count rate plots | Images |
|---|---|---|
| Comparison with Poisson distribution Blue bars denote a histogram of data divided into 1 sec bins. Red curve is a Poisson curve with rate = median count rate of data. |
 |
 |
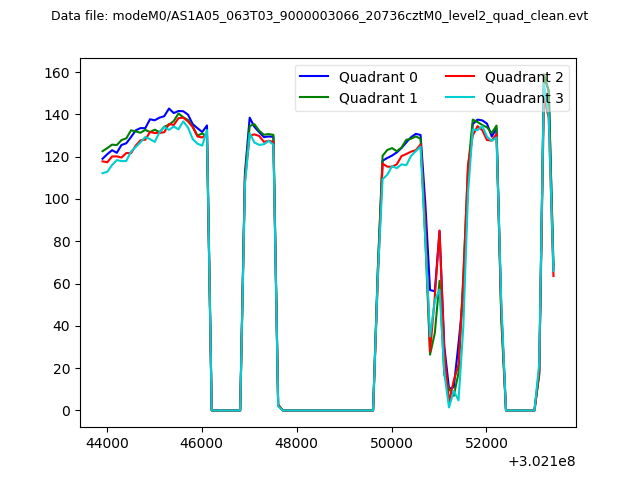
| Quadrant-wise count rates Data is divided into 100 sec bins |
 |
|
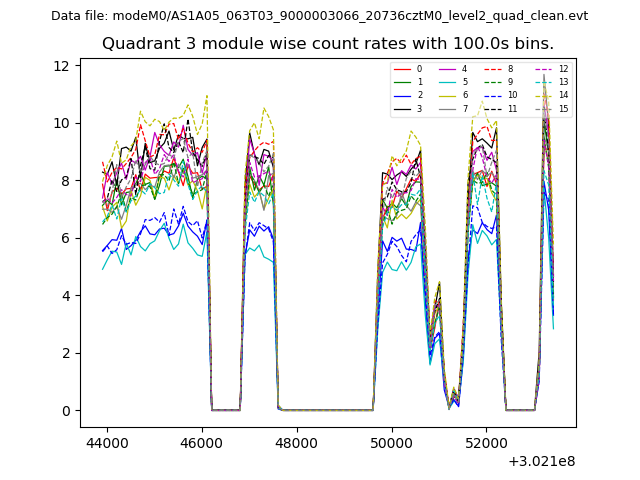
| Module-wise count rates for Quadrant A Data is divided into 100 sec bins |
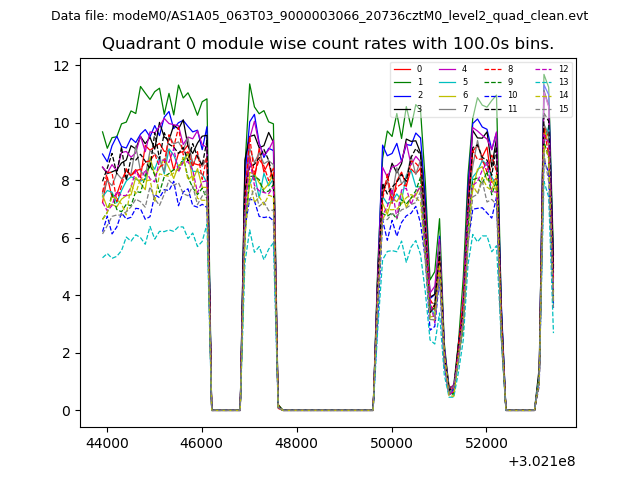 |
 |
| Module-wise count rates for Quadrant B Data is divided into 100 sec bins |
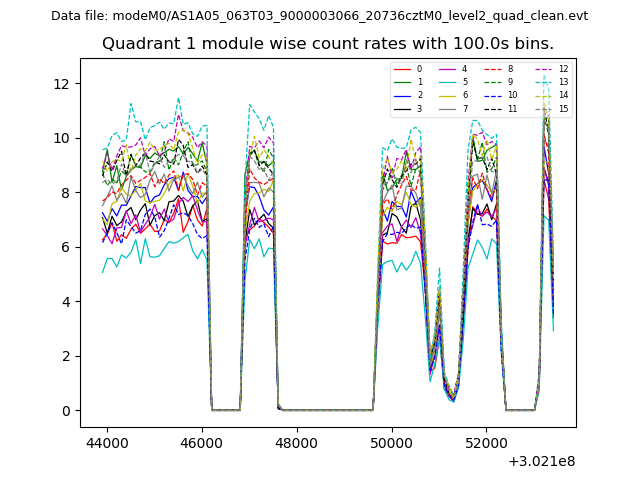 |
 |
| Module-wise count rates for Quadrant C Data is divided into 100 sec bins |
 |
 |
| Module-wise count rates for Quadrant D Data is divided into 100 sec bins |
 |
 |
| Parameter | Plot |
|---|---|
| CZT HV Monitor |  |
| D_VDD | 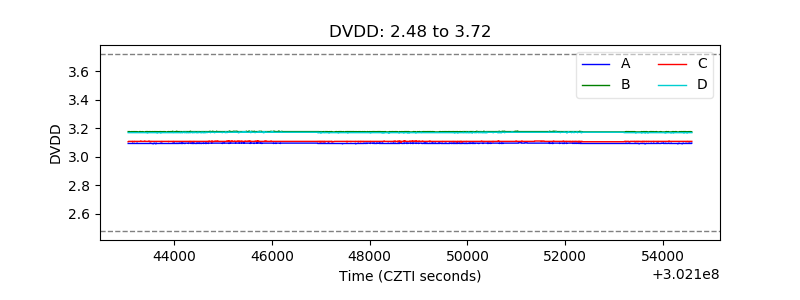 |
| Temperature 1 | 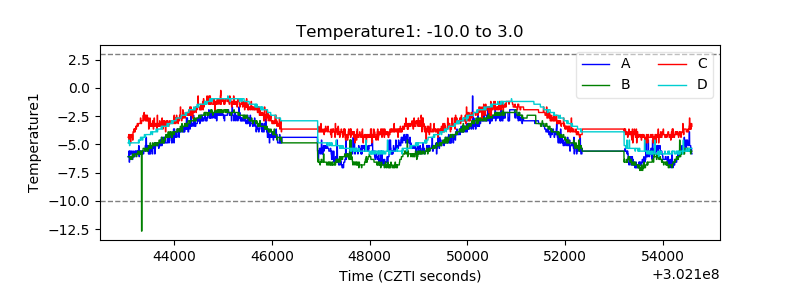 |
| Veto HV Monitor | 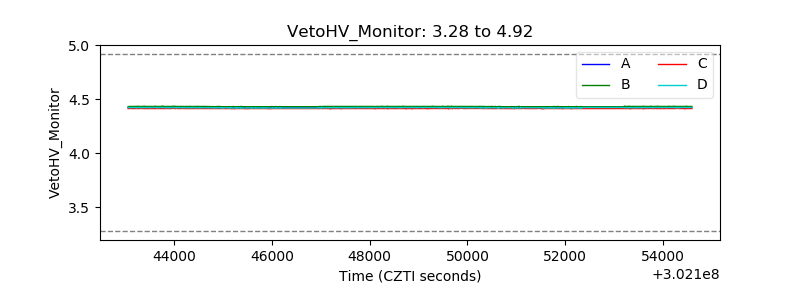 |
| Veto LLD | 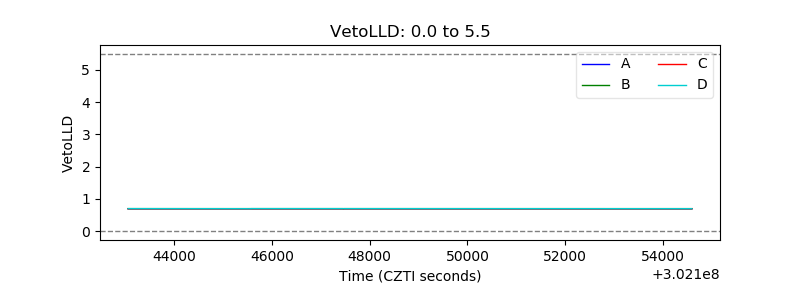 |
| Alpha Counter | 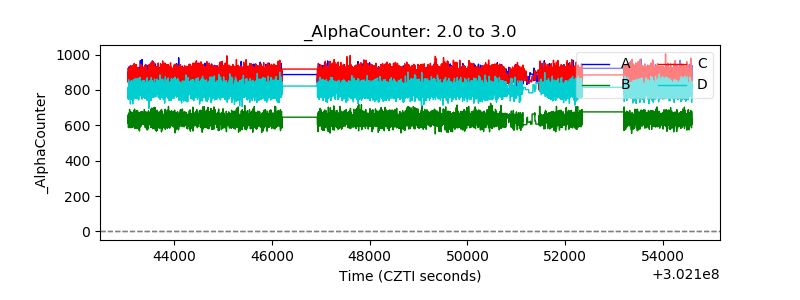 |
| _CPM_Rate | 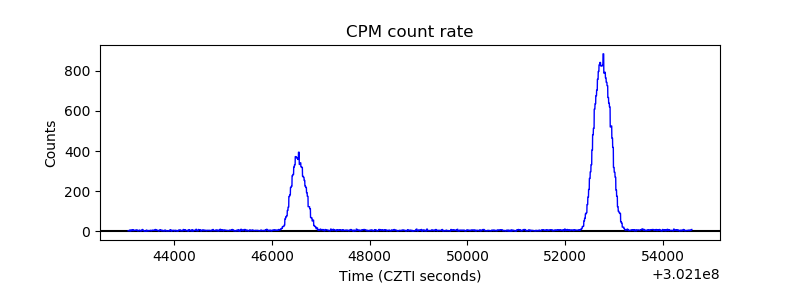 |
| CZT Counter | 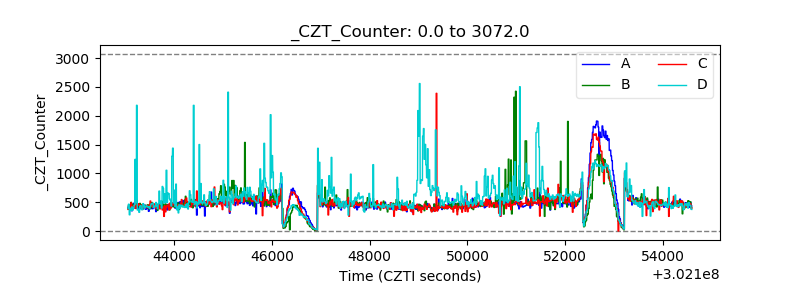 |
| +2.5 Volts monitor |  |
| +5 Volts monitor |  |
| _ROLL_ROT | 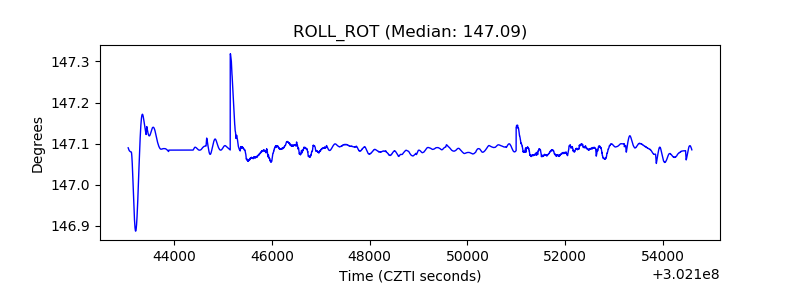 |
| _Roll_DEC | 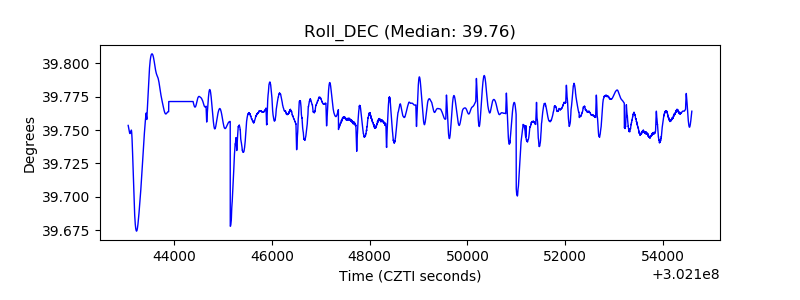 |
| _Roll_RA | 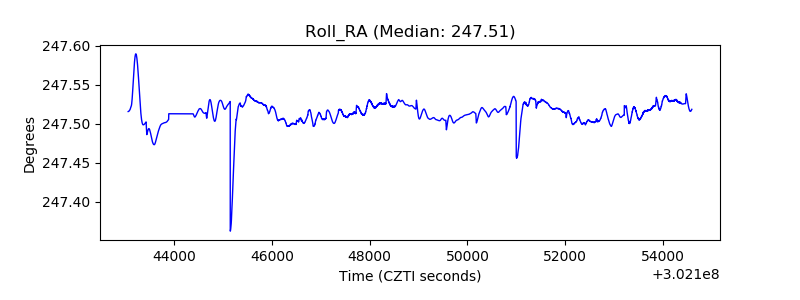 |
| Veto Counter | 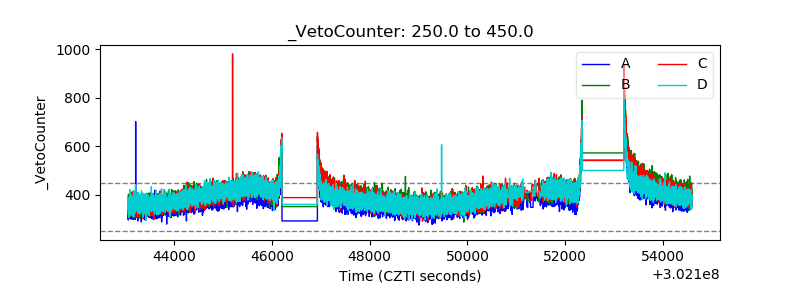 |