| Param | Original file | Final file |
|---|---|---|
| Filename | modeM0/AS1A05_063T03_9000003066_20741cztM0_level2.evt | modeM0/AS1A05_063T03_9000003066_20741cztM0_level2_quad_clean.evt |
| Size (bytes) | 1,220,296,320 | 244,284,480 |
| Size | 1.1 GB | 233.0 MB |
| Events in quadrant A | 8,415,476 | 1,635,497 |
| Events in quadrant B | 8,923,353 | 1,613,807 |
| Events in quadrant C | 8,231,560 | 1,536,889 |
| Events in quadrant D | 10,316,486 | 1,519,584 |
| Mode M0 | |||
|---|---|---|---|
| Quadrant | BADHDUFLAG | Total packets | Discarded packets |
| A | 0 | 34800 | 4 |
| B | 0 | 36314 | 3 |
| C | 0 | 33943 | 6 |
| D | 0 | 40831 | 3 |
| Mode SS | |||
|---|---|---|---|
| Quadrant | BADHDUFLAG | Total packets | Discarded packets |
| A | 0 | 326 | 0 |
| B | 0 | 326 | 0 |
| C | 0 | 326 | 0 |
| D | 0 | 326 | 0 |
| Mode M9 | |||
|---|---|---|---|
| Quadrant | BADHDUFLAG | Total packets | Discarded packets |
| A | 0 | 37 | 0 |
| B | 0 | 37 | 0 |
| C | 0 | 37 | 0 |
| D | 0 | 37 | 0 |
| Quadrant | Total seconds | Saturated seconds | Saturation percentage |
|---|---|---|---|
| A | 15846 | 184 | 1.161176% |
| B | 15845 | 319 | 2.013253% |
| C | 15845 | 241 | 1.520985% |
| D | 15847 | 349 | 2.202310% |
Noise dominated data is calculated using 1-second bins in cleaned event files. If a bin has >2000 counts, and if more than 50% of those come from <1% of pixels, then it is considered to be noise-dominated and hence unusable.
| Quadrant | # 1 sec bins | Bins with >0 counts | Bins with >2000 counts | High rate bins dominated by noise | Noise dominated (total time) | Noise dominated (detector-on time) | Marked lightcurve |
|---|---|---|---|---|---|---|---|
| A | 19582 | 15848 | 0 | 0 | 0.00% | 0.00% | 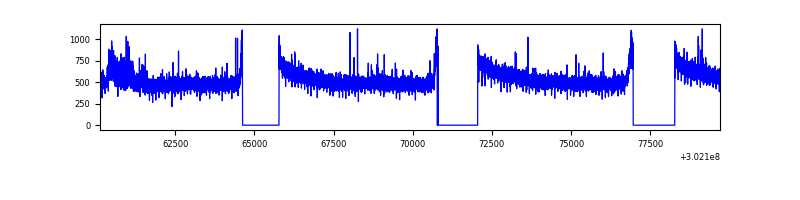 |
| B | 19581 | 15846 | 78 | 78 | 0.40% | 0.49% | 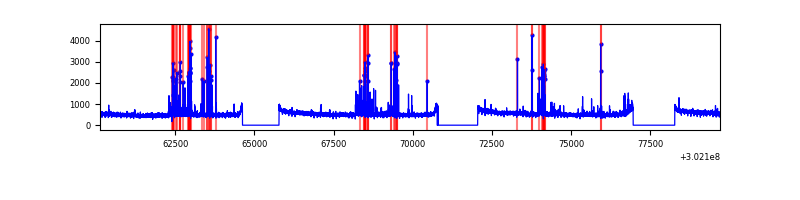 |
| C | 19580 | 15847 | 6 | 6 | 0.03% | 0.04% | 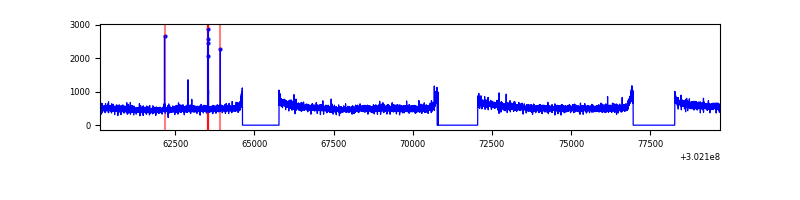 |
| D | 19582 | 15850 | 194 | 194 | 0.99% | 1.22% | 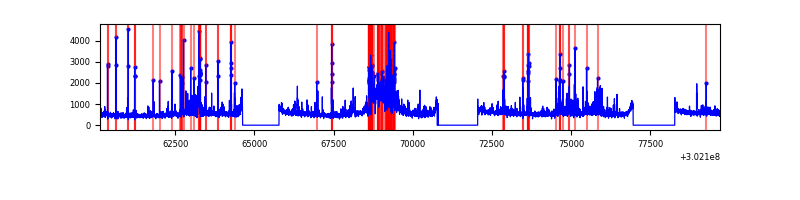 |
Top three noisy pixels from each quadrant. If the there are fewer than three noisy pixels in the level2.evt file, extra rows are filled as -1
| Pixel properties | Quadrant properties | ||||||
|---|---|---|---|---|---|---|---|
| Quadrant | DetID | PixID | Counts | Sigma | Mean | Median | Sigma |
| A | 6 | 240 | 134880 | 314.36 | 2154 | 2117 | 422.3 |
| A | 0 | 226 | 18599 | 39.03 | 2154 | 2117 | 422.3 |
| A | 3 | 137 | 16218 | 33.39 | 2154 | 2117 | 422.3 |
| B | 7 | 220 | 458032 | 1171.52 | 2107 | 2058 | 389.2 |
| B | 0 | 197 | 82536 | 206.77 | 2107 | 2058 | 389.2 |
| B | 0 | 229 | 50655 | 124.86 | 2107 | 2058 | 389.2 |
| C | 14 | 238 | 323336 | 694.36 | 2015 | 2032 | 462.7 |
| C | 9 | 54 | 32399 | 65.62 | 2015 | 2032 | 462.7 |
| C | 7 | 247 | 19218 | 37.14 | 2015 | 2032 | 462.7 |
| D | 5 | 222 | 1515865 | 3058.84 | 2068 | 2011 | 494.9 |
| D | 1 | 52 | 515767 | 1038.08 | 2068 | 2011 | 494.9 |
| D | 1 | 20 | 373845 | 751.31 | 2068 | 2011 | 494.9 |
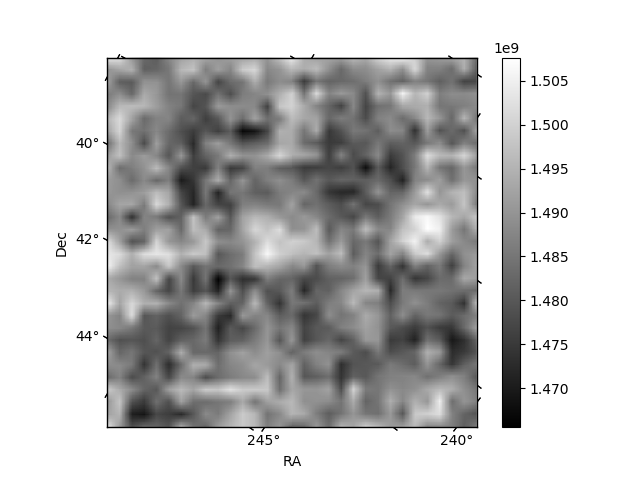
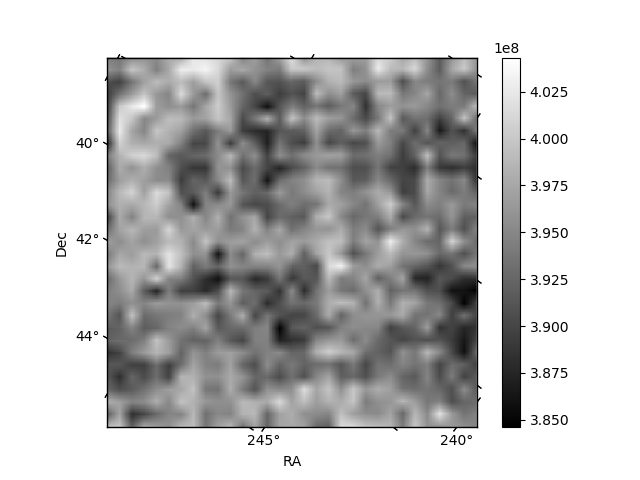
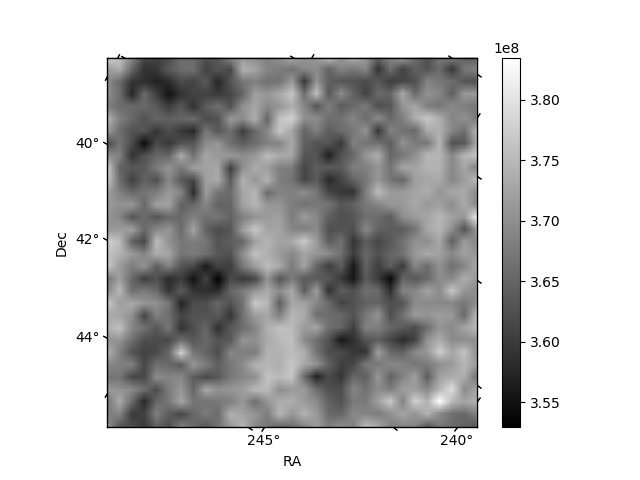
Histogram calculated using DETX and DETY for each event in the final _common_clean file
| Quadrant A | 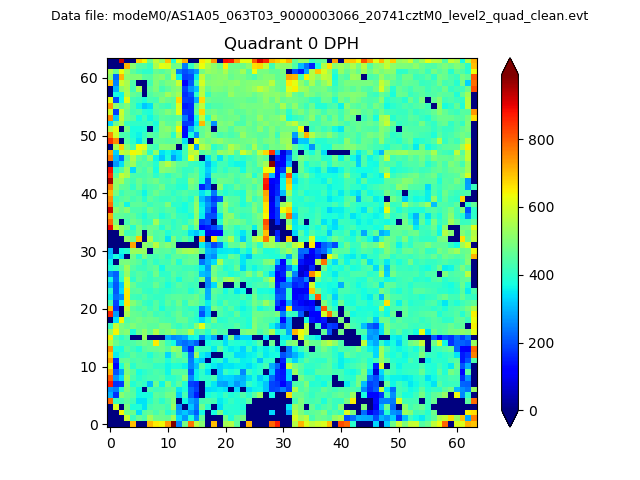 |
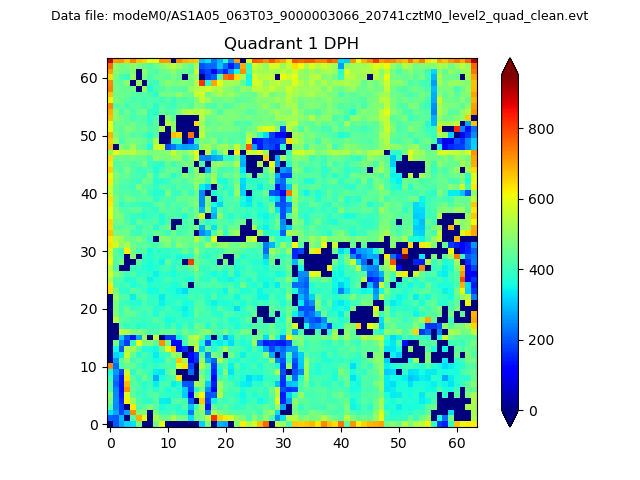 |
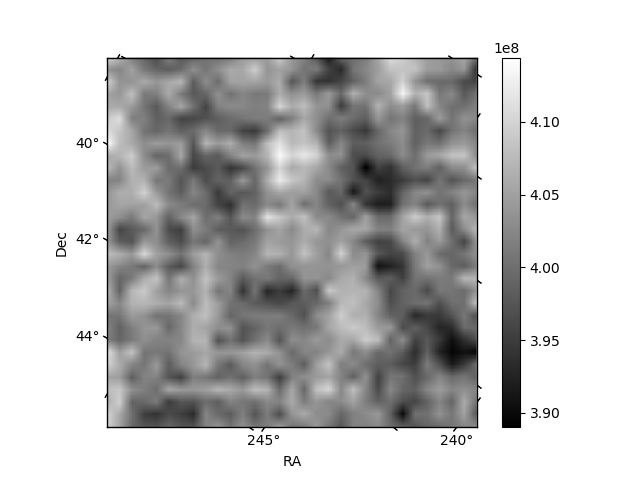
Quadrant B |
|---|---|---|---|
| Quadrant D | 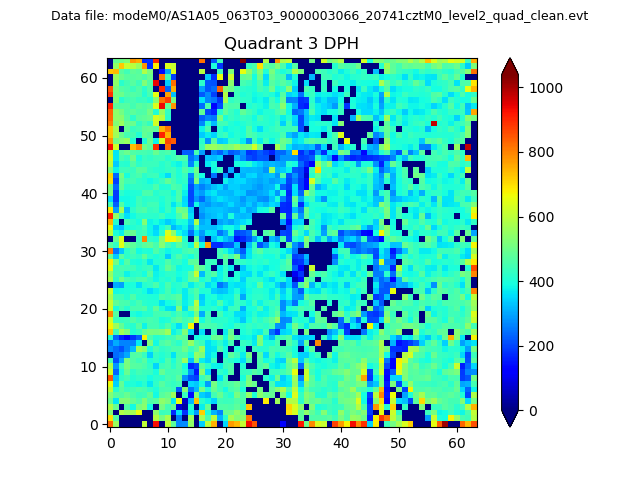 |
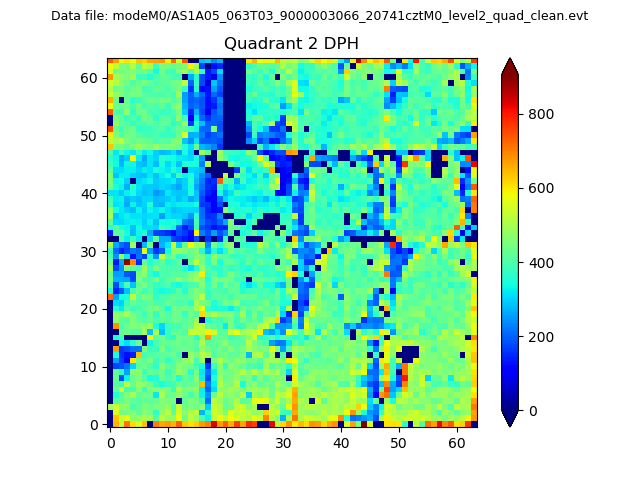 |
Quadrant C |
| Plot type | Count rate plots | Images |
|---|---|---|
| Comparison with Poisson distribution Blue bars denote a histogram of data divided into 1 sec bins. Red curve is a Poisson curve with rate = median count rate of data. |
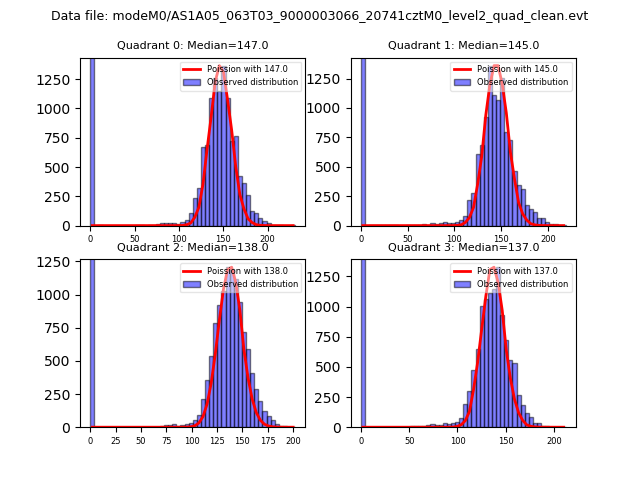 |
 |
| Quadrant-wise count rates Data is divided into 100 sec bins |
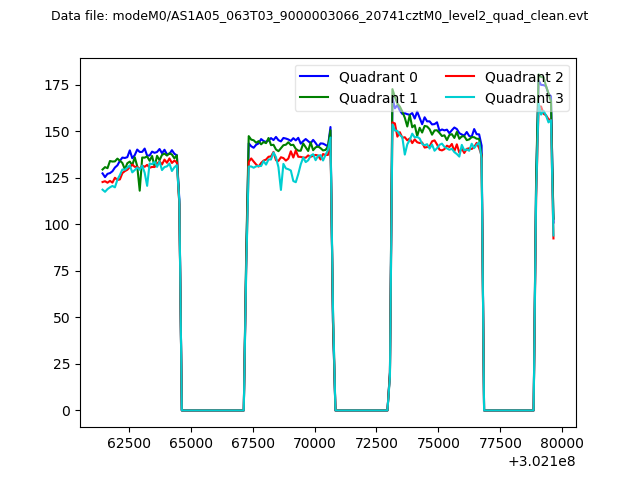 |
|
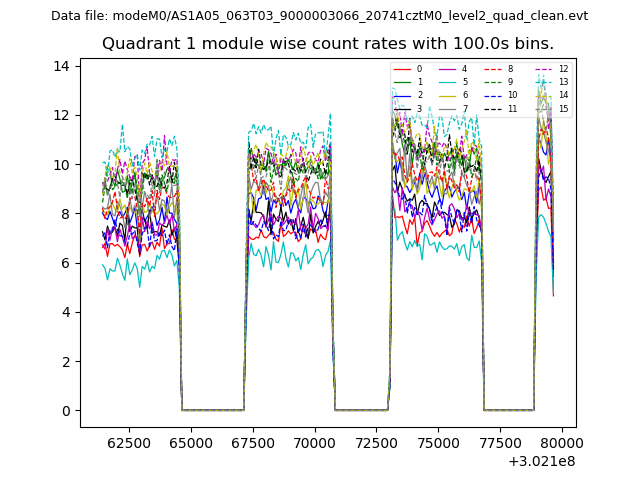
| Module-wise count rates for Quadrant A Data is divided into 100 sec bins |
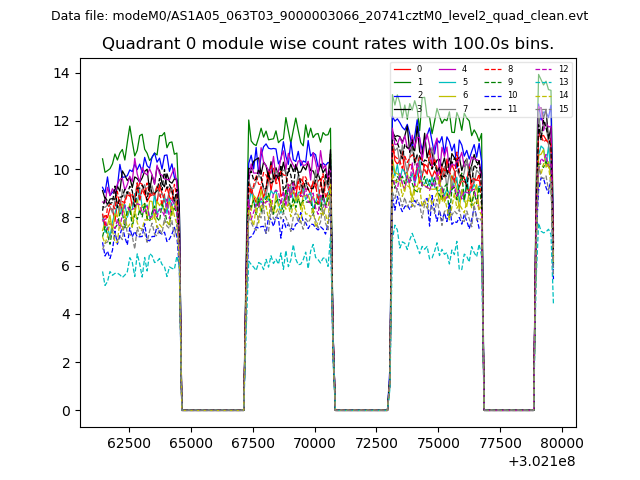 |
 |
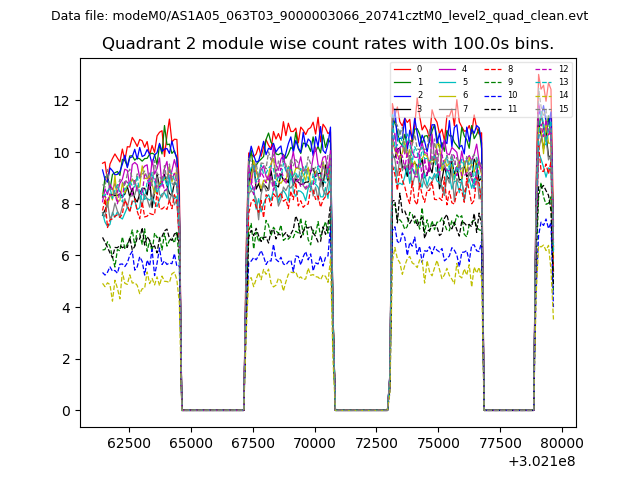
| Module-wise count rates for Quadrant B Data is divided into 100 sec bins |
 |
 |
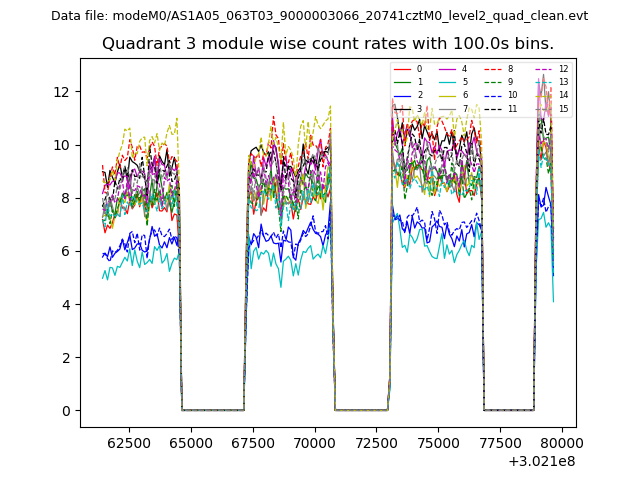
| Module-wise count rates for Quadrant C Data is divided into 100 sec bins |
 |
 |
| Module-wise count rates for Quadrant D Data is divided into 100 sec bins |
 |
 |
| Parameter | Plot |
|---|---|
| CZT HV Monitor | 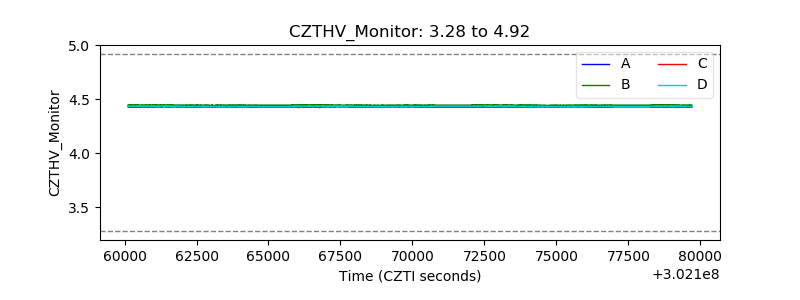 |
| D_VDD | 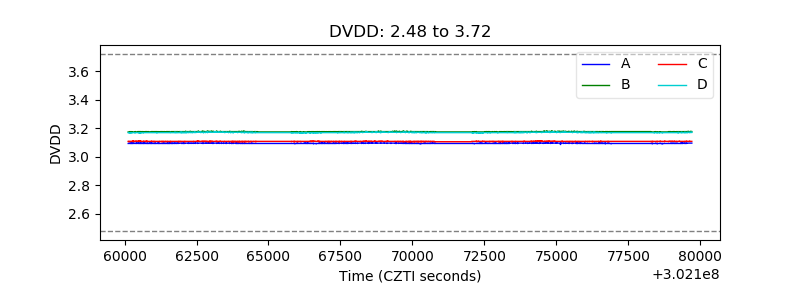 |
| Temperature 1 | 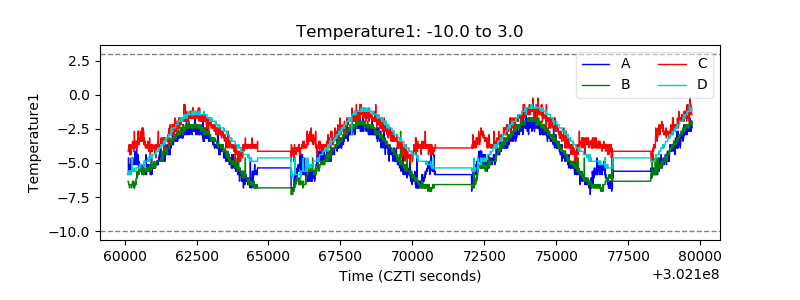 |
| Veto HV Monitor |  |
| Veto LLD | 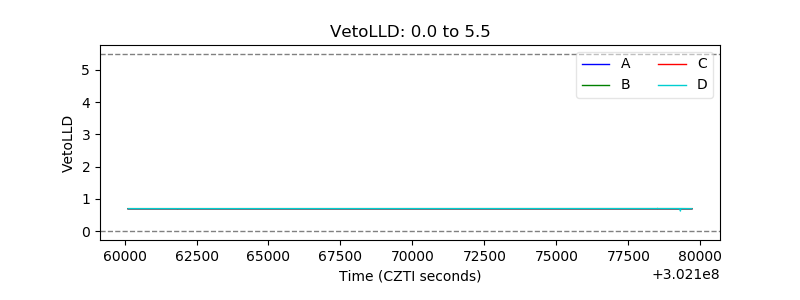 |
| Alpha Counter |  |
| _CPM_Rate |  |
| CZT Counter | 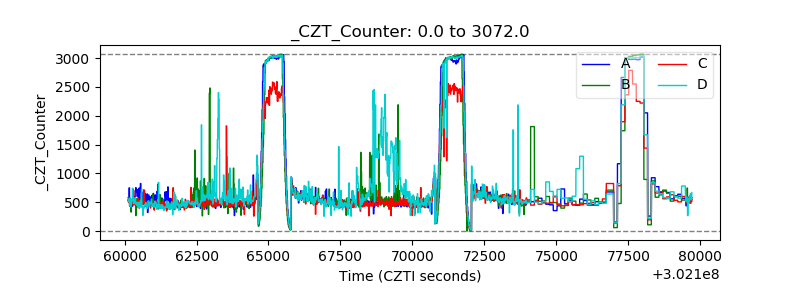 |
| +2.5 Volts monitor |  |
| +5 Volts monitor |  |
| _ROLL_ROT | 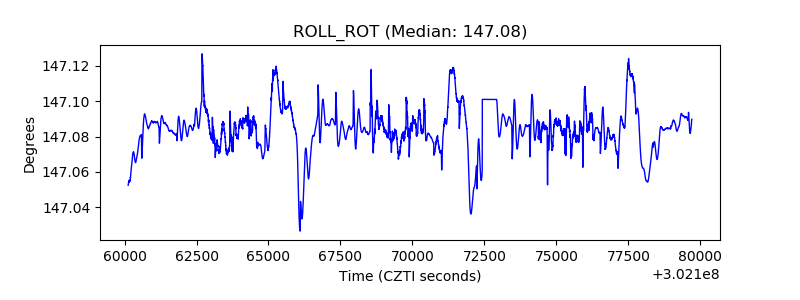 |
| _Roll_DEC | 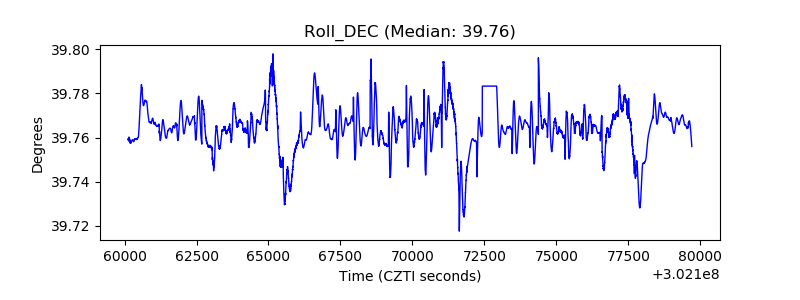 |
| _Roll_RA | 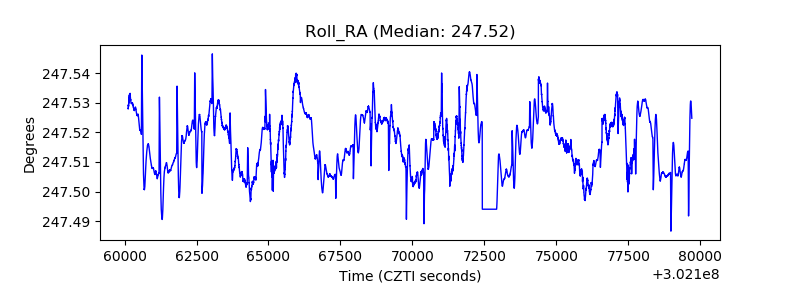 |
| Veto Counter | 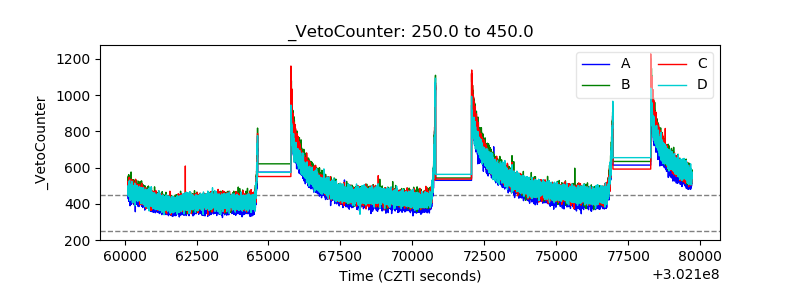 |