| Param | Original file | Final file |
|---|---|---|
| Filename | modeM0/AS1A05_063T03_9000003066_20742cztM0_level2.evt | modeM0/AS1A05_063T03_9000003066_20742cztM0_level2_quad_clean.evt |
| Size (bytes) | 489,000,960 | 116,472,960 |
| Size | 466.3 MB | 111.1 MB |
| Events in quadrant A | 3,288,732 | 811,075 |
| Events in quadrant B | 3,593,774 | 794,149 |
| Events in quadrant C | 3,259,772 | 756,034 |
| Events in quadrant D | 4,258,363 | 745,719 |
| Mode M0 | |||
|---|---|---|---|
| Quadrant | BADHDUFLAG | Total packets | Discarded packets |
| A | 0 | 13408 | 1 |
| B | 0 | 14458 | 1 |
| C | 0 | 13093 | 1 |
| D | 0 | 16399 | 1 |
| Mode SS | |||
|---|---|---|---|
| Quadrant | BADHDUFLAG | Total packets | Discarded packets |
| A | 0 | 122 | 0 |
| B | 0 | 122 | 0 |
| C | 0 | 122 | 0 |
| D | 0 | 122 | 0 |
| Mode M9 | |||
|---|---|---|---|
| Quadrant | BADHDUFLAG | Total packets | Discarded packets |
| A | 0 | 13 | 0 |
| B | 0 | 13 | 0 |
| C | 0 | 13 | 0 |
| D | 0 | 13 | 0 |
| Quadrant | Total seconds | Saturated seconds | Saturation percentage |
|---|---|---|---|
| A | 6025 | 120 | 1.991701% |
| B | 6026 | 173 | 2.870893% |
| C | 6026 | 128 | 2.124129% |
| D | 6026 | 313 | 5.194159% |
Noise dominated data is calculated using 1-second bins in cleaned event files. If a bin has >2000 counts, and if more than 50% of those come from <1% of pixels, then it is considered to be noise-dominated and hence unusable.
| Quadrant | # 1 sec bins | Bins with >0 counts | Bins with >2000 counts | High rate bins dominated by noise | Noise dominated (total time) | Noise dominated (detector-on time) | Marked lightcurve |
|---|---|---|---|---|---|---|---|
| A | 7340 | 6025 | 0 | 0 | 0.00% | 0.00% | 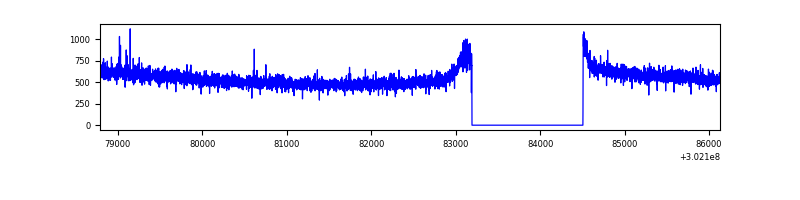 |
| B | 7341 | 6026 | 31 | 31 | 0.42% | 0.51% | 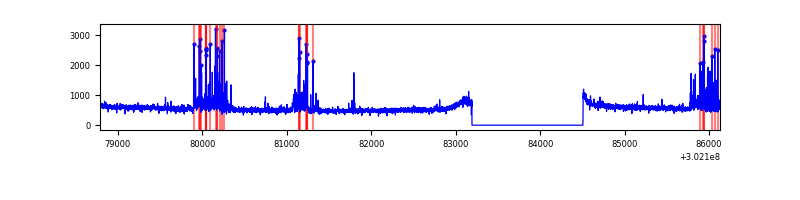 |
| C | 7341 | 6026 | 0 | 0 | 0.00% | 0.00% | 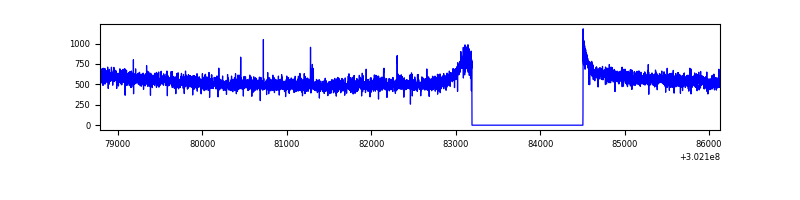 |
| D | 7341 | 6026 | 179 | 179 | 2.44% | 2.97% | 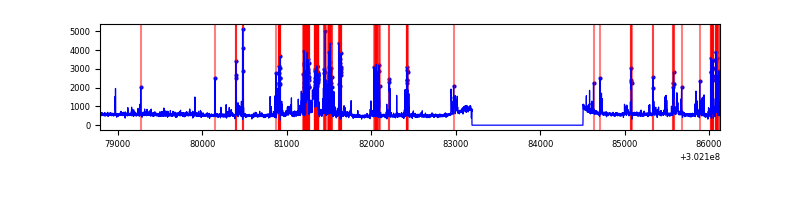 |
Top three noisy pixels from each quadrant. If the there are fewer than three noisy pixels in the level2.evt file, extra rows are filled as -1
| Pixel properties | Quadrant properties | ||||||
|---|---|---|---|---|---|---|---|
| Quadrant | DetID | PixID | Counts | Sigma | Mean | Median | Sigma |
| A | 0 | 226 | 7574 | 39.97 | 854 | 840 | 168.5 |
| A | 3 | 137 | 6298 | 32.4 | 854 | 840 | 168.5 |
| A | 12 | 194 | 6193 | 31.77 | 854 | 840 | 168.5 |
| B | 7 | 220 | 257524 | 1670.8 | 826 | 808 | 153.6 |
| B | 0 | 197 | 56521 | 362.6 | 826 | 808 | 153.6 |
| B | 12 | 111 | 17321 | 107.47 | 826 | 808 | 153.6 |
| C | 14 | 238 | 127226 | 690.41 | 797 | 805 | 183.1 |
| C | 7 | 247 | 20090 | 105.32 | 797 | 805 | 183.1 |
| C | 3 | 233 | 6623 | 31.77 | 797 | 805 | 183.1 |
| D | 1 | 20 | 387137 | 1974.79 | 818 | 798 | 195.6 |
| D | 1 | 52 | 356132 | 1816.31 | 818 | 798 | 195.6 |
| D | 2 | 165 | 304756 | 1553.7 | 818 | 798 | 195.6 |
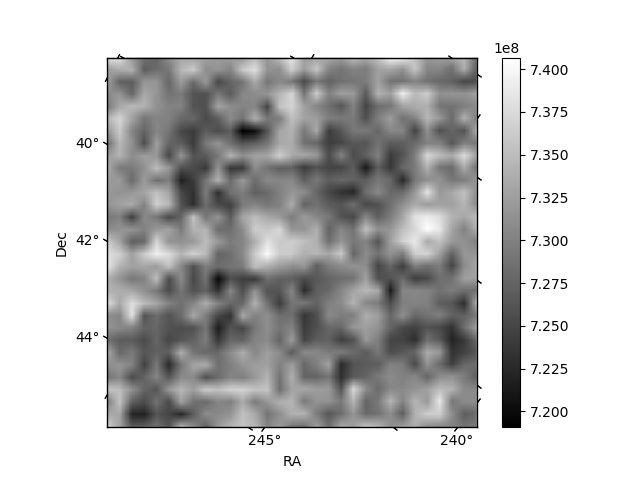
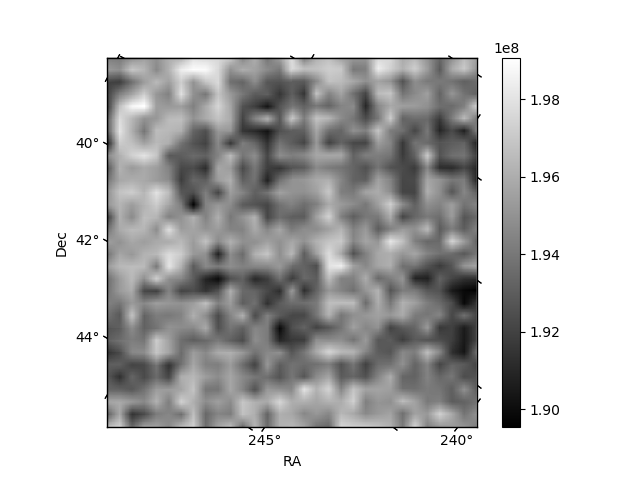
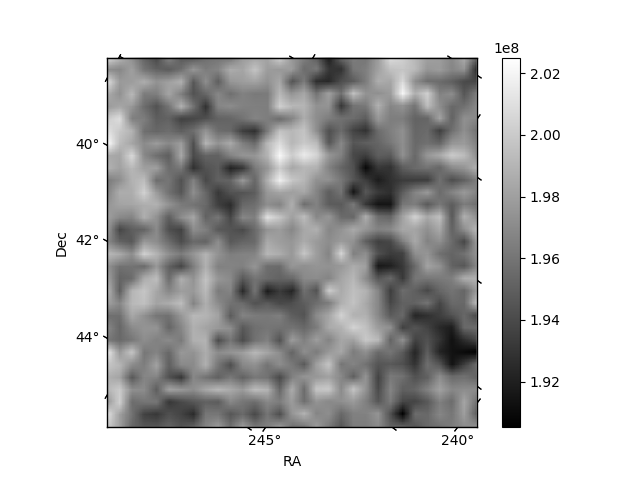
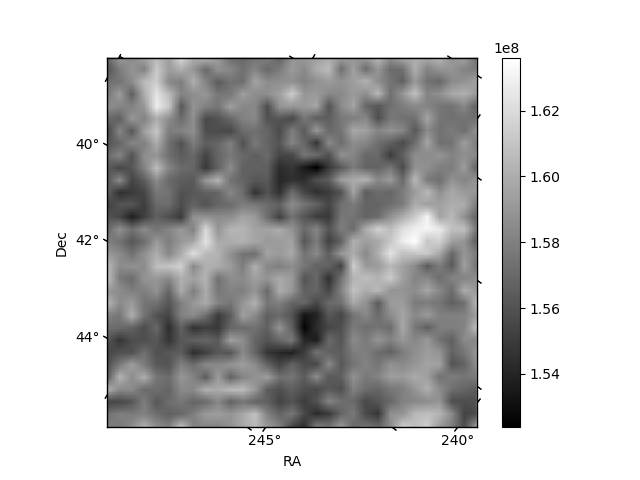
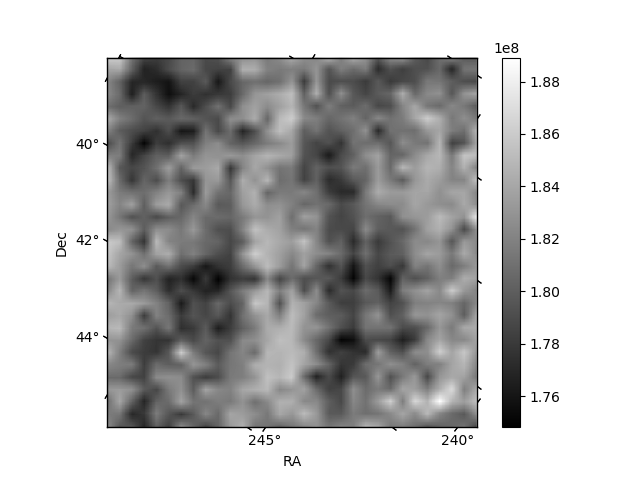
Histogram calculated using DETX and DETY for each event in the final _common_clean file
| Quadrant A | 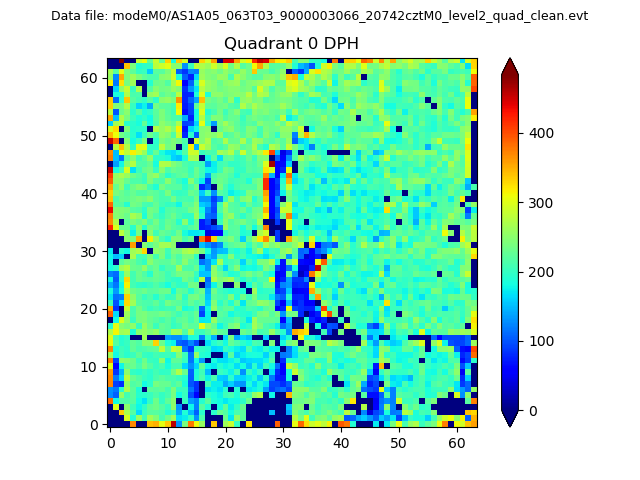 |
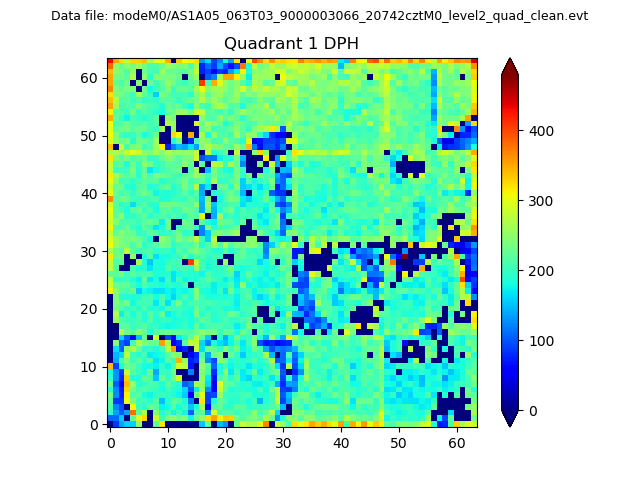 |
Quadrant B |
|---|---|---|---|
| Quadrant D | 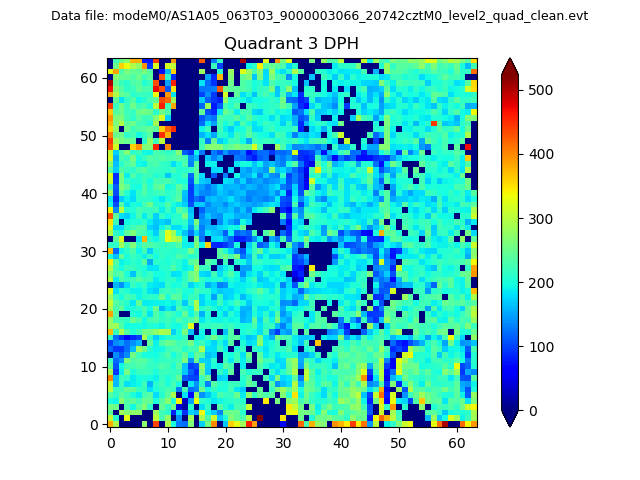 |
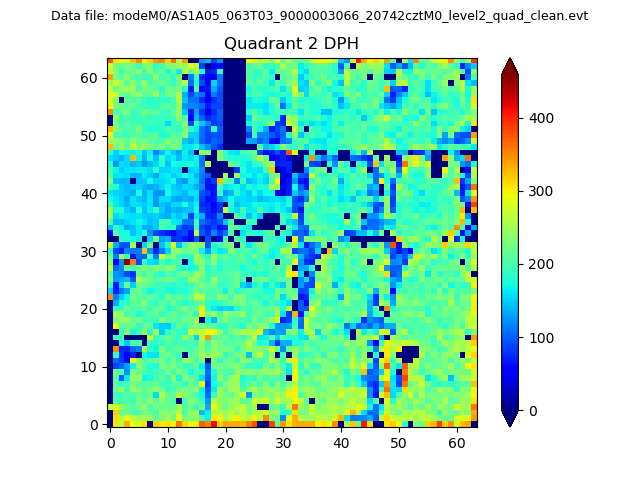 |
Quadrant C |
| Plot type | Count rate plots | Images |
|---|---|---|
| Comparison with Poisson distribution Blue bars denote a histogram of data divided into 1 sec bins. Red curve is a Poisson curve with rate = median count rate of data. |
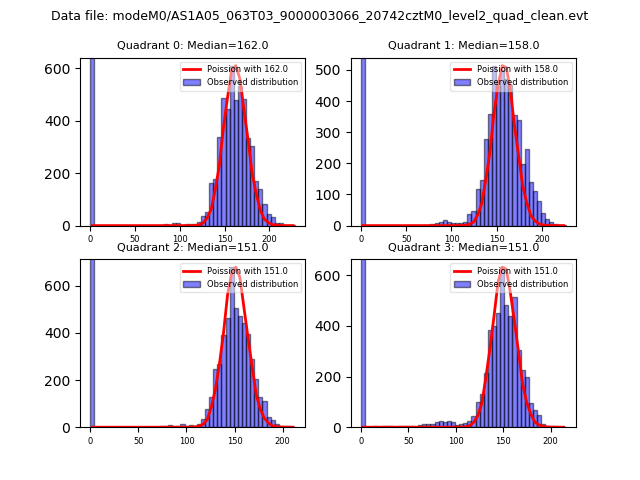 |
 |
| Quadrant-wise count rates Data is divided into 100 sec bins |
 |
|
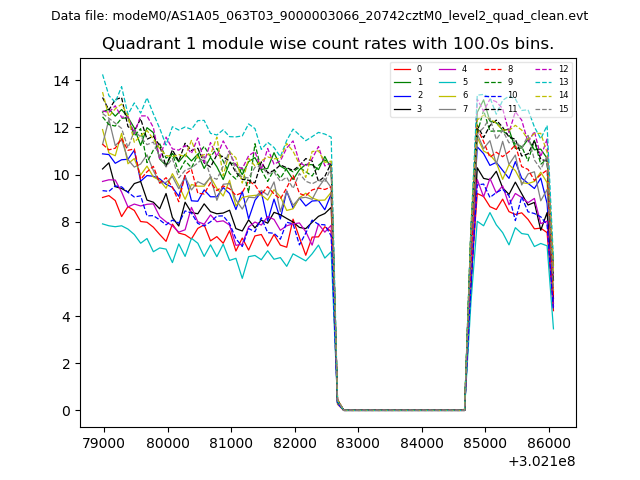
| Module-wise count rates for Quadrant A Data is divided into 100 sec bins |
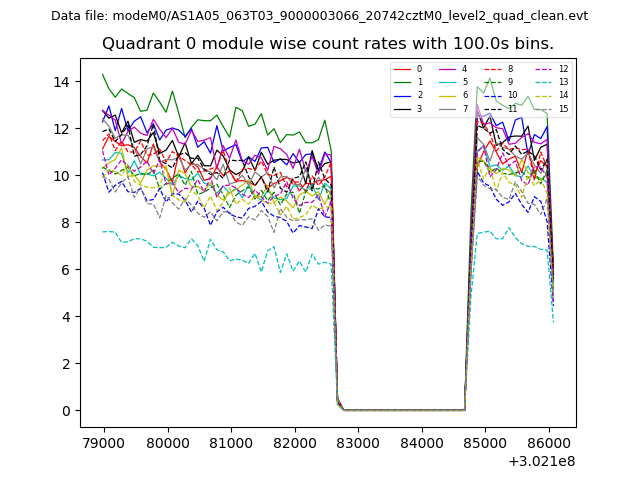 |
 |
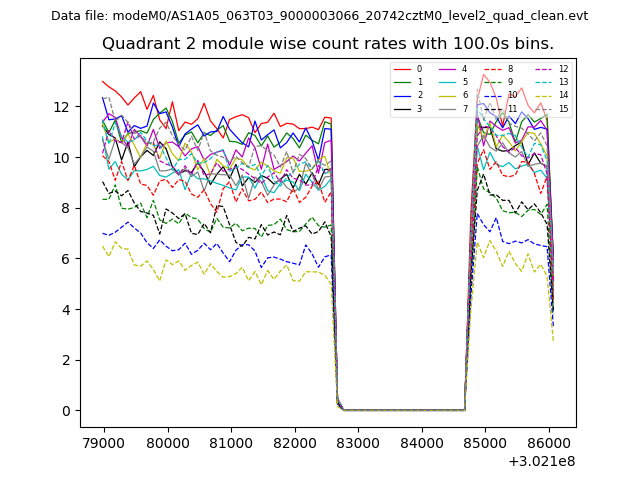
| Module-wise count rates for Quadrant B Data is divided into 100 sec bins |
 |
 |
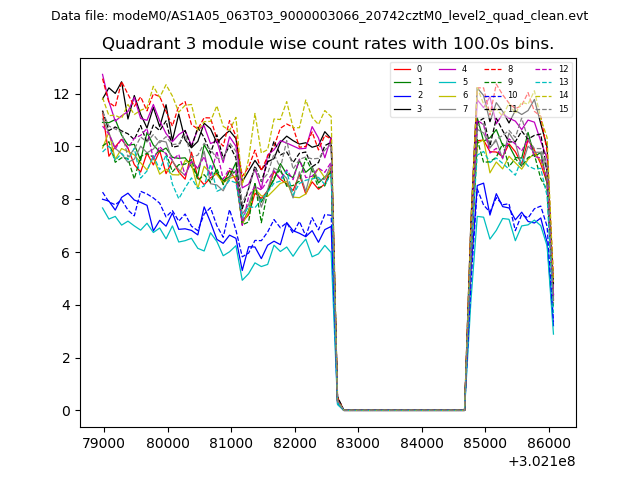
| Module-wise count rates for Quadrant C Data is divided into 100 sec bins |
 |
 |
| Module-wise count rates for Quadrant D Data is divided into 100 sec bins |
 |
 |
| Parameter | Plot |
|---|---|
| CZT HV Monitor | 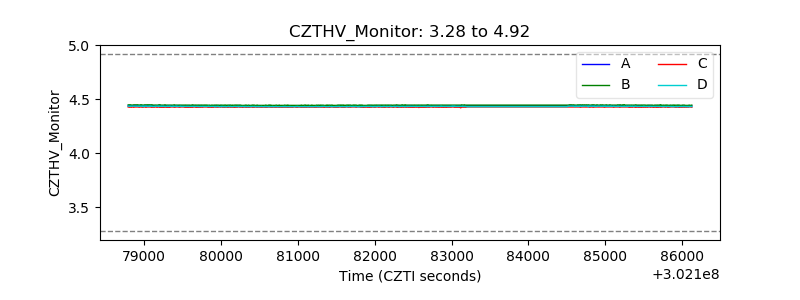 |
| D_VDD | 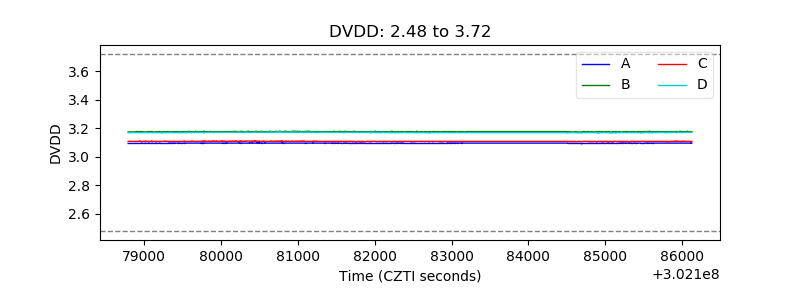 |
| Temperature 1 | 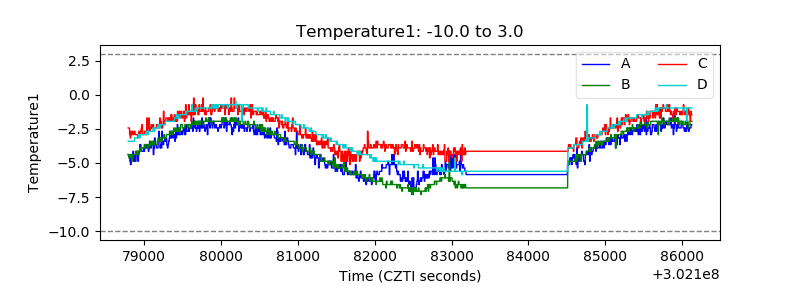 |
| Veto HV Monitor | 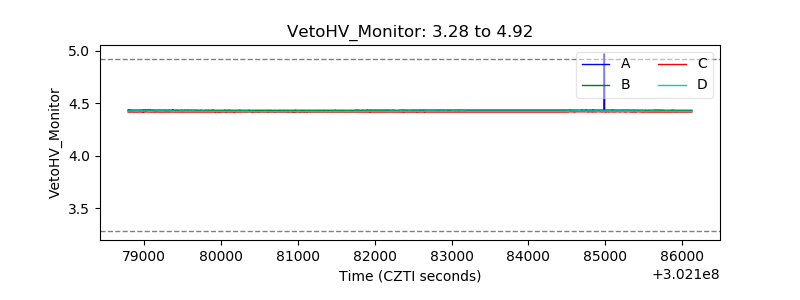 |
| Veto LLD | 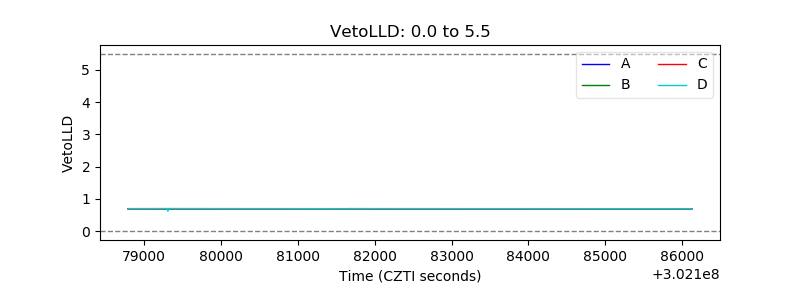 |
| Alpha Counter | 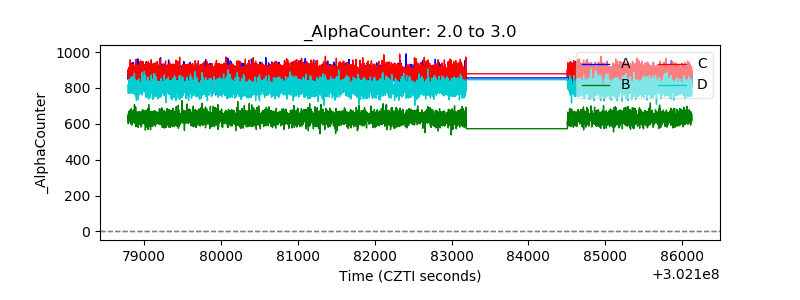 |
| _CPM_Rate | 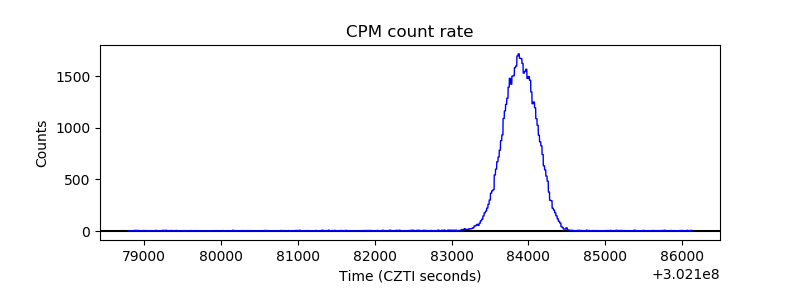 |
| CZT Counter |  |
| +2.5 Volts monitor |  |
| +5 Volts monitor |  |
| _ROLL_ROT | 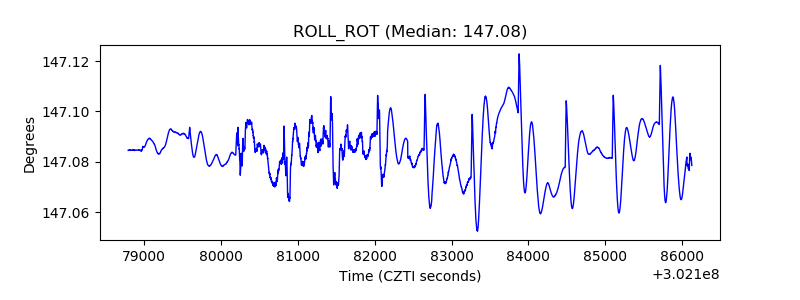 |
| _Roll_DEC | 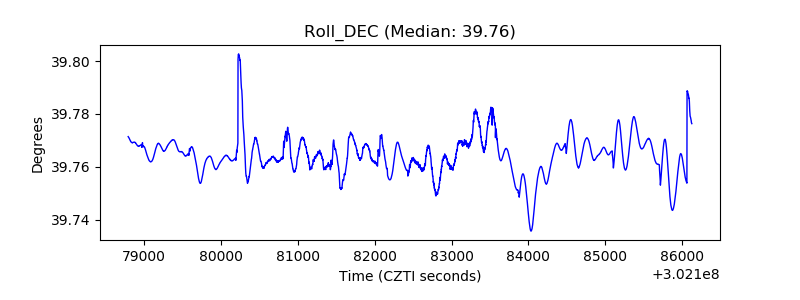 |
| _Roll_RA | 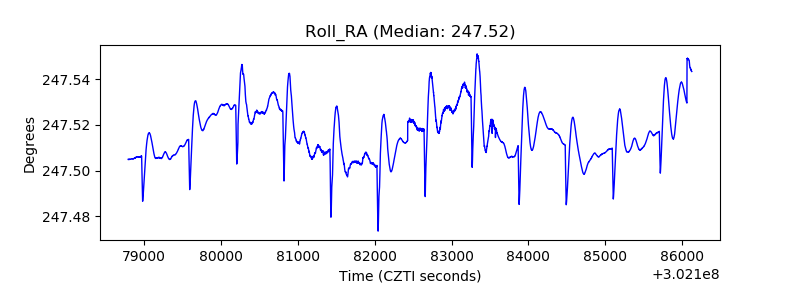 |
| Veto Counter | 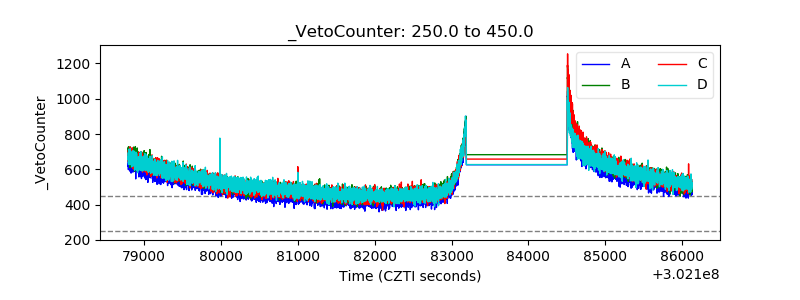 |