| Param | Original file | Final file |
|---|---|---|
| Filename | modeM0/AS1A05_063T03_9000003066_20743cztM0_level2.evt | modeM0/AS1A05_063T03_9000003066_20743cztM0_level2_quad_clean.evt |
| Size (bytes) | 537,442,560 | 109,932,480 |
| Size | 512.5 MB | 104.8 MB |
| Events in quadrant A | 3,064,144 | 766,825 |
| Events in quadrant B | 3,458,301 | 747,552 |
| Events in quadrant C | 3,051,747 | 719,971 |
| Events in quadrant D | 6,302,213 | 682,546 |
| Mode M0 | |||
|---|---|---|---|
| Quadrant | BADHDUFLAG | Total packets | Discarded packets |
| A | 0 | 12540 | 1 |
| B | 0 | 13974 | 1 |
| C | 0 | 12462 | 1 |
| D | 0 | 22609 | 1 |
| Mode SS | |||
|---|---|---|---|
| Quadrant | BADHDUFLAG | Total packets | Discarded packets |
| A | 0 | 120 | 0 |
| B | 0 | 120 | 0 |
| C | 0 | 120 | 0 |
| D | 0 | 120 | 0 |
| Mode M9 | |||
|---|---|---|---|
| Quadrant | BADHDUFLAG | Total packets | Discarded packets |
| A | 0 | 12 | 0 |
| B | 0 | 12 | 0 |
| C | 0 | 12 | 0 |
| D | 0 | 12 | 0 |
| Quadrant | Total seconds | Saturated seconds | Saturation percentage |
|---|---|---|---|
| A | 5902 | 109 | 1.846832% |
| B | 5903 | 189 | 3.201762% |
| C | 5903 | 121 | 2.049805% |
| D | 5903 | 967 | 16.381501% |
Noise dominated data is calculated using 1-second bins in cleaned event files. If a bin has >2000 counts, and if more than 50% of those come from <1% of pixels, then it is considered to be noise-dominated and hence unusable.
| Quadrant | # 1 sec bins | Bins with >0 counts | Bins with >2000 counts | High rate bins dominated by noise | Noise dominated (total time) | Noise dominated (detector-on time) | Marked lightcurve |
|---|---|---|---|---|---|---|---|
| A | 7167 | 5903 | 0 | 0 | 0.00% | 0.00% | 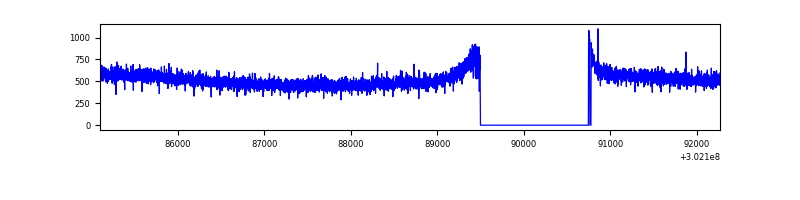 |
| B | 7168 | 5905 | 39 | 39 | 0.54% | 0.66% | 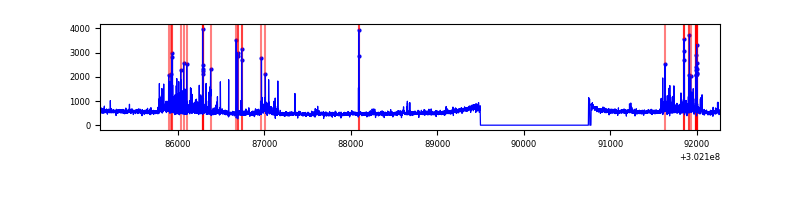 |
| C | 7168 | 5905 | 0 | 0 | 0.00% | 0.00% | 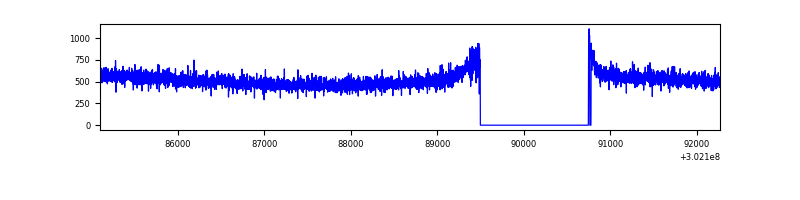 |
| D | 7168 | 5905 | 843 | 843 | 11.76% | 14.28% | 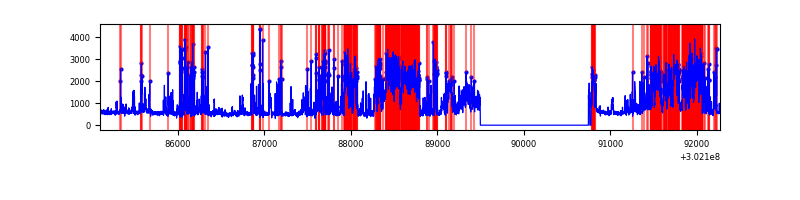 |
Top three noisy pixels from each quadrant. If the there are fewer than three noisy pixels in the level2.evt file, extra rows are filled as -1
| Pixel properties | Quadrant properties | ||||||
|---|---|---|---|---|---|---|---|
| Quadrant | DetID | PixID | Counts | Sigma | Mean | Median | Sigma |
| A | 0 | 226 | 7038 | 39.57 | 795 | 780 | 158.2 |
| A | 3 | 137 | 5982 | 32.89 | 795 | 780 | 158.2 |
| A | 12 | 194 | 5733 | 31.32 | 795 | 780 | 158.2 |
| B | 7 | 220 | 330187 | 2283.45 | 772 | 755 | 144.3 |
| B | 0 | 197 | 33929 | 229.94 | 772 | 755 | 144.3 |
| B | 0 | 229 | 22102 | 147.97 | 772 | 755 | 144.3 |
| C | 14 | 238 | 117641 | 675.79 | 750 | 756 | 173.0 |
| C | 3 | 233 | 6338 | 32.27 | 750 | 756 | 173.0 |
| C | 7 | 247 | 5439 | 27.08 | 750 | 756 | 173.0 |
| D | 1 | 52 | 2610493 | 14545.16 | 744 | 726 | 179.4 |
| D | 1 | 20 | 647323 | 3603.72 | 744 | 726 | 179.4 |
| D | 2 | 165 | 180060 | 999.49 | 744 | 726 | 179.4 |
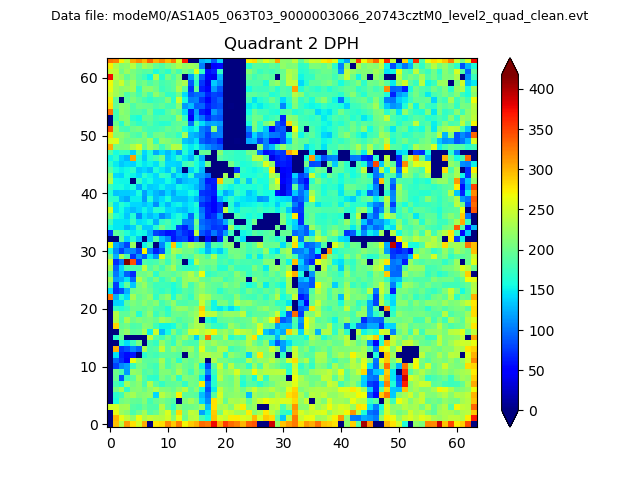
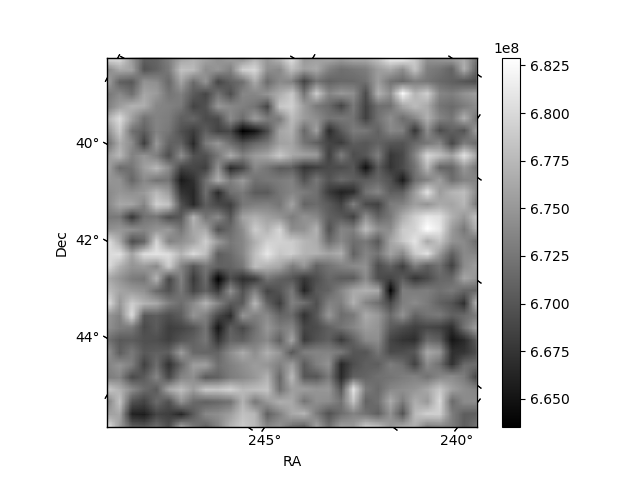
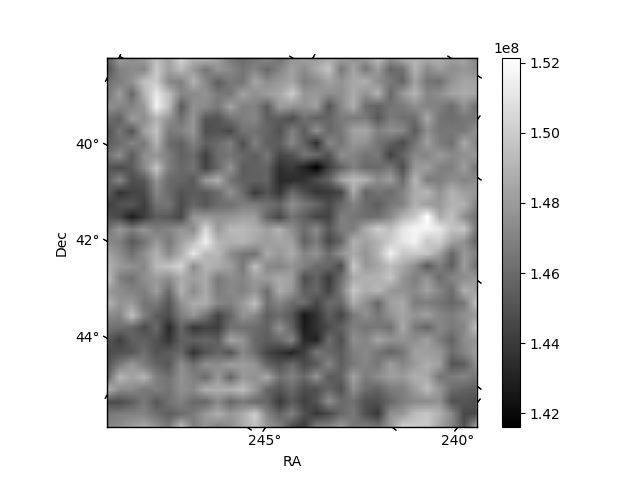
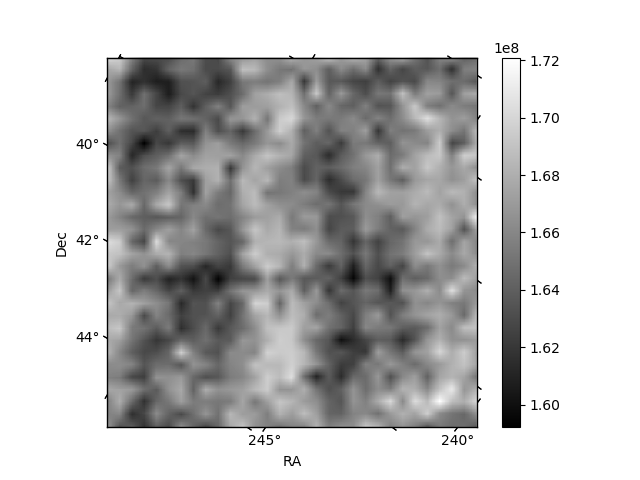
Histogram calculated using DETX and DETY for each event in the final _common_clean file
| Quadrant A | 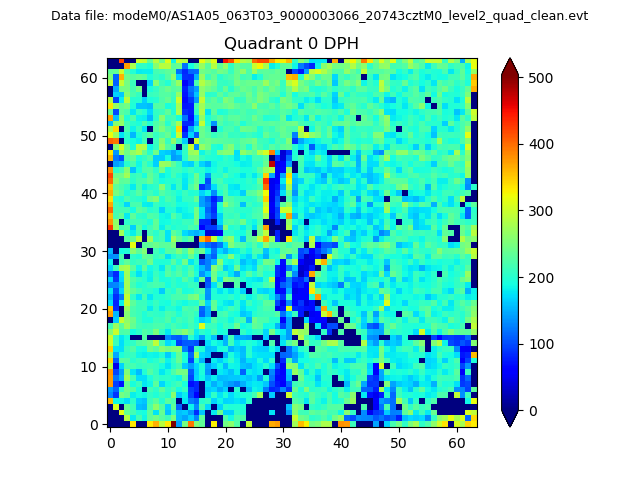 |
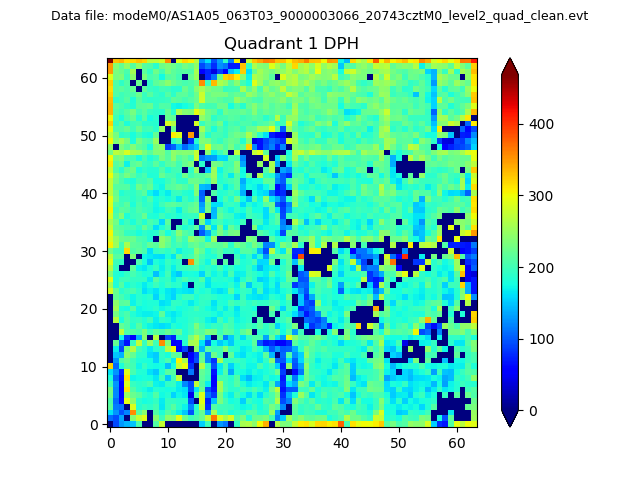 |
Quadrant B |
|---|---|---|---|
| Quadrant D | 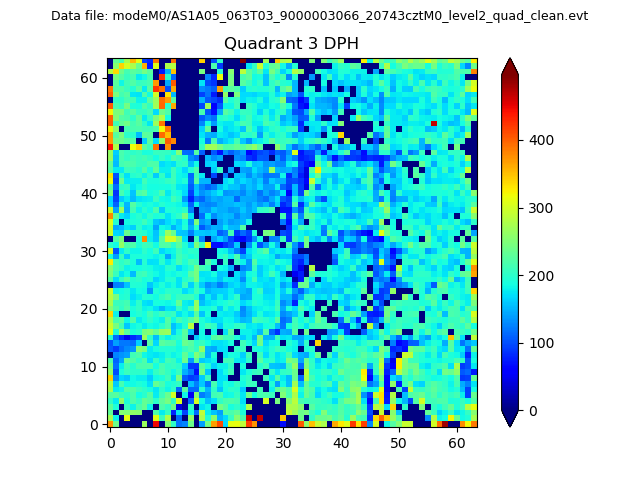 |
 |
Quadrant C |
| Plot type | Count rate plots | Images |
|---|---|---|
| Comparison with Poisson distribution Blue bars denote a histogram of data divided into 1 sec bins. Red curve is a Poisson curve with rate = median count rate of data. |
 |
 |
| Quadrant-wise count rates Data is divided into 100 sec bins |
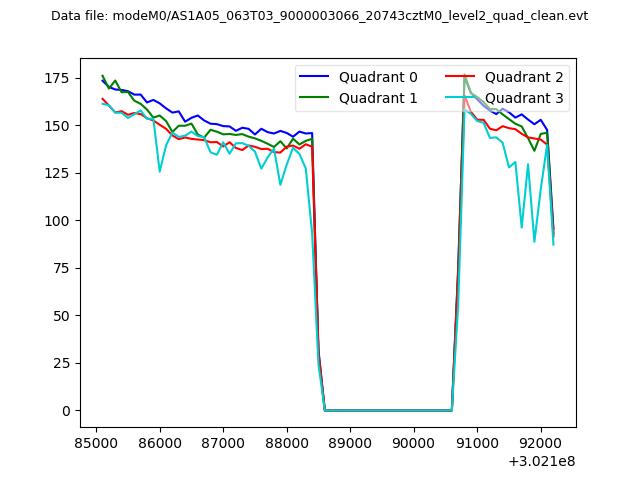 |
|
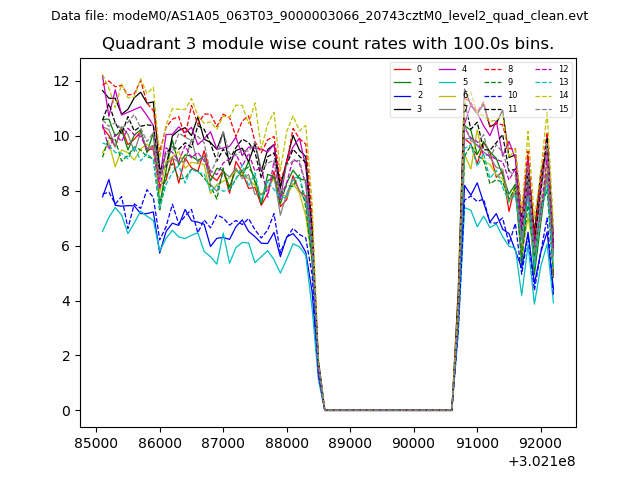
| Module-wise count rates for Quadrant A Data is divided into 100 sec bins |
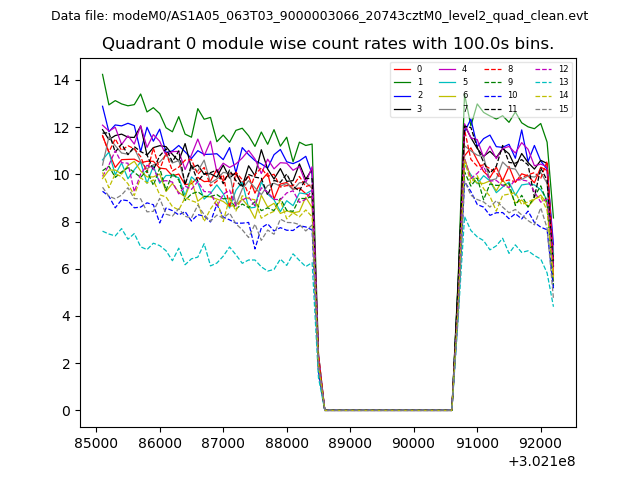 |
 |
| Module-wise count rates for Quadrant B Data is divided into 100 sec bins |
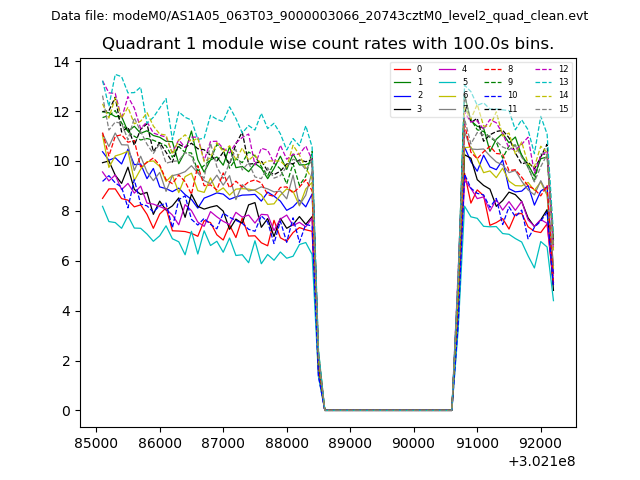 |
 |
| Module-wise count rates for Quadrant C Data is divided into 100 sec bins |
 |
 |
| Module-wise count rates for Quadrant D Data is divided into 100 sec bins |
 |
 |
| Parameter | Plot |
|---|---|
| CZT HV Monitor |  |
| D_VDD | 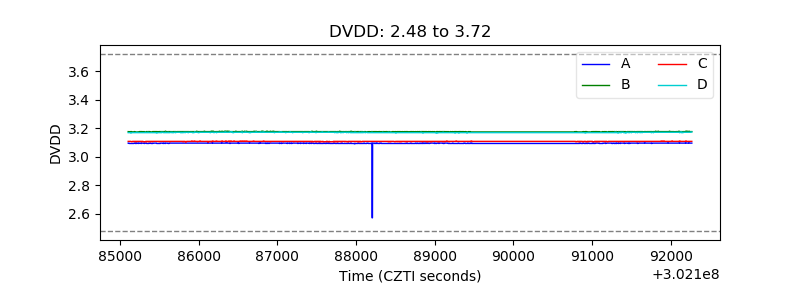 |
| Temperature 1 | 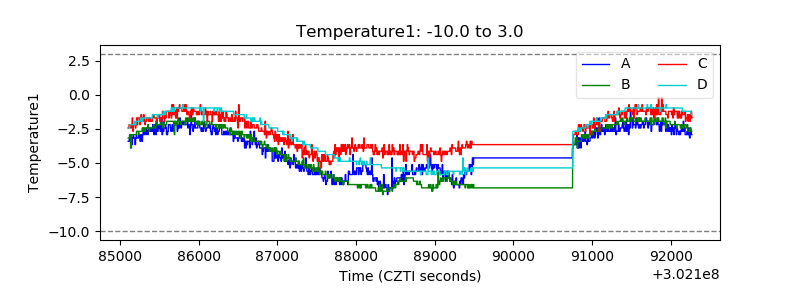 |
| Veto HV Monitor | 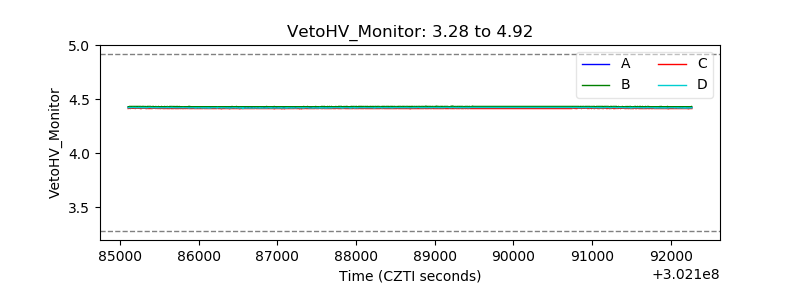 |
| Veto LLD | 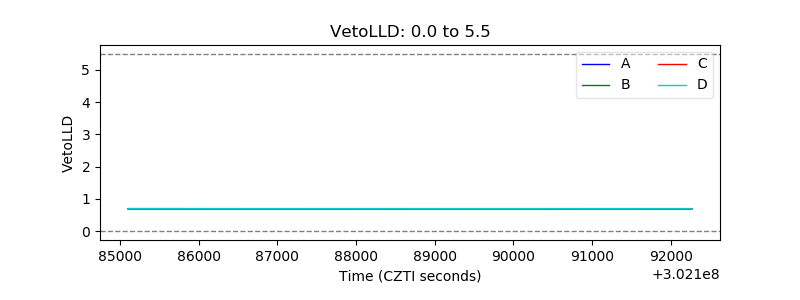 |
| Alpha Counter | 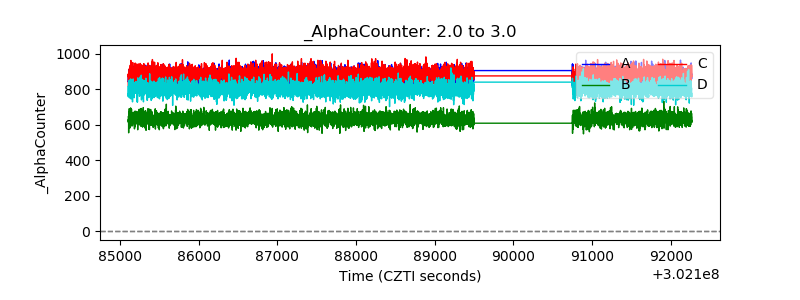 |
| _CPM_Rate | 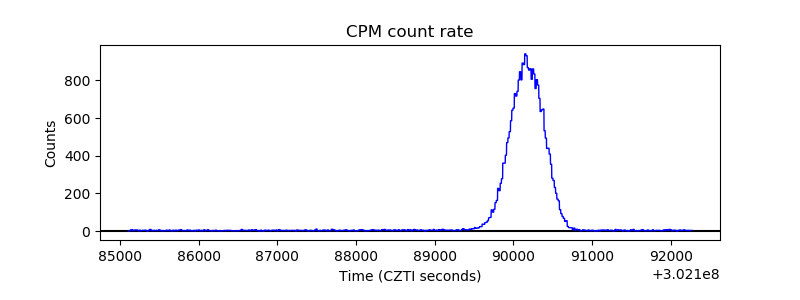 |
| CZT Counter | 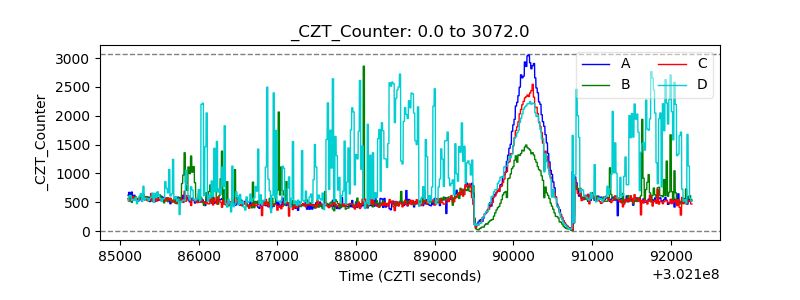 |
| +2.5 Volts monitor | 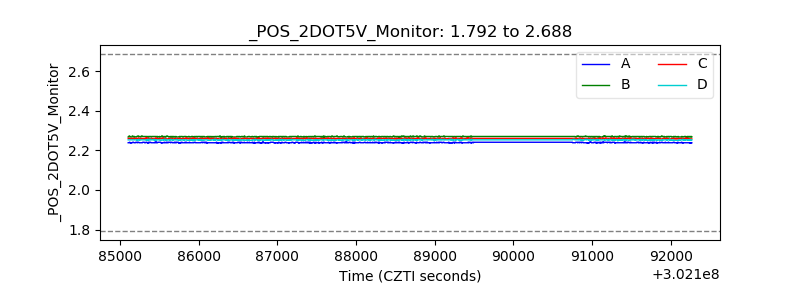 |
| +5 Volts monitor |  |
| _ROLL_ROT | 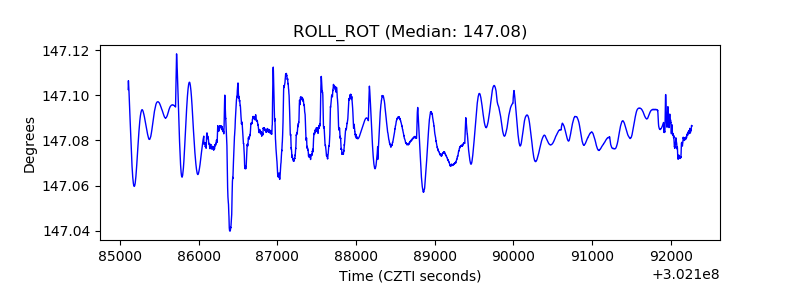 |
| _Roll_DEC | 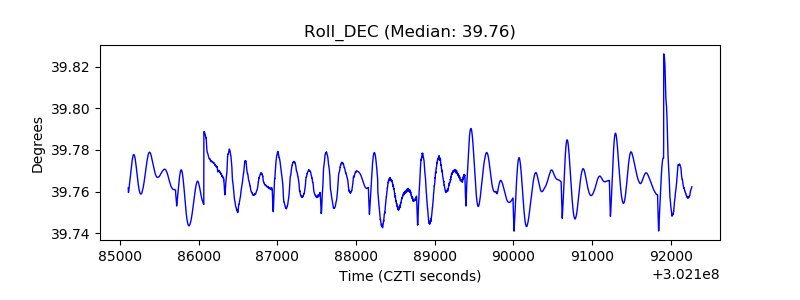 |
| _Roll_RA | 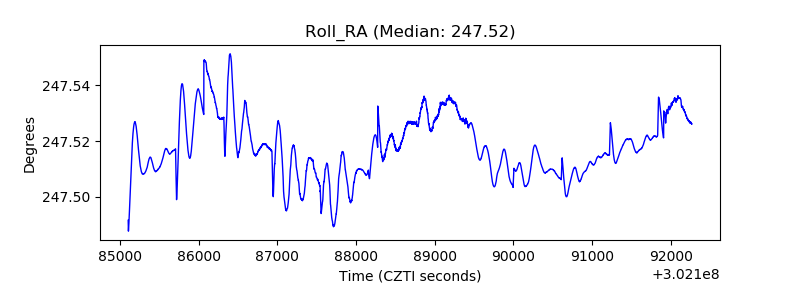 |
| Veto Counter | 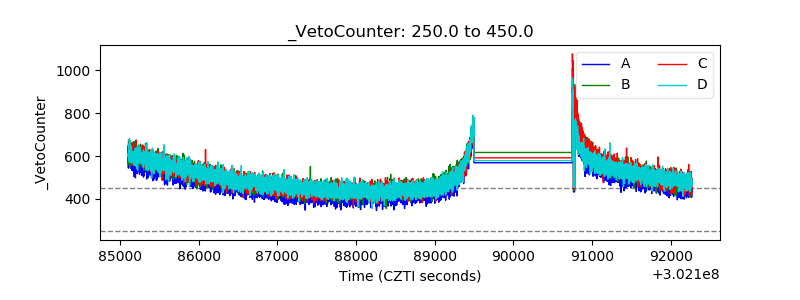 |