| Param | Original file | Final file |
|---|---|---|
| Filename | modeM0/AS1A05_063T03_9000003066_20747cztM0_level2.evt | modeM0/AS1A05_063T03_9000003066_20747cztM0_level2_quad_clean.evt |
| Size (bytes) | 503,743,680 | 99,293,760 |
| Size | 480.4 MB | 94.7 MB |
| Events in quadrant A | 3,341,529 | 647,775 |
| Events in quadrant B | 3,533,380 | 641,456 |
| Events in quadrant C | 3,373,903 | 621,465 |
| Events in quadrant D | 4,534,313 | 611,103 |
| Mode M0 | |||
|---|---|---|---|
| Quadrant | BADHDUFLAG | Total packets | Discarded packets |
| A | 0 | 14520 | 3 |
| B | 0 | 14977 | 6 |
| C | 0 | 14482 | 7 |
| D | 0 | 18179 | 3 |
| Mode SS | |||
|---|---|---|---|
| Quadrant | BADHDUFLAG | Total packets | Discarded packets |
| A | 0 | 140 | 0 |
| B | 0 | 140 | 0 |
| C | 0 | 140 | 0 |
| D | 0 | 140 | 0 |
| Mode M9 | |||
|---|---|---|---|
| Quadrant | BADHDUFLAG | Total packets | Discarded packets |
| A | 0 | 3 | 0 |
| B | 0 | 3 | 0 |
| C | 0 | 3 | 0 |
| D | 0 | 3 | 0 |
| Quadrant | Total seconds | Saturated seconds | Saturation percentage |
|---|---|---|---|
| A | 6969 | 59 | 0.846606% |
| B | 6968 | 105 | 1.506889% |
| C | 6968 | 97 | 1.392078% |
| D | 6970 | 259 | 3.715925% |
Noise dominated data is calculated using 1-second bins in cleaned event files. If a bin has >2000 counts, and if more than 50% of those come from <1% of pixels, then it is considered to be noise-dominated and hence unusable.
| Quadrant | # 1 sec bins | Bins with >0 counts | Bins with >2000 counts | High rate bins dominated by noise | Noise dominated (total time) | Noise dominated (detector-on time) | Marked lightcurve |
|---|---|---|---|---|---|---|---|
| A | 7235 | 6971 | 1 | 1 | 0.01% | 0.01% | 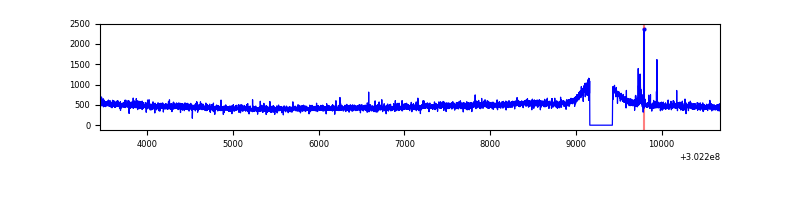 |
| B | 7236 | 6971 | 8 | 8 | 0.11% | 0.11% | 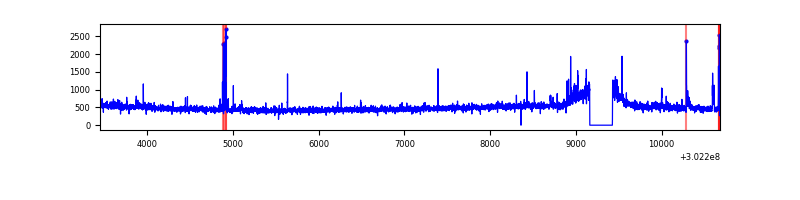 |
| C | 7236 | 6972 | 0 | 0 | 0.00% | 0.00% | 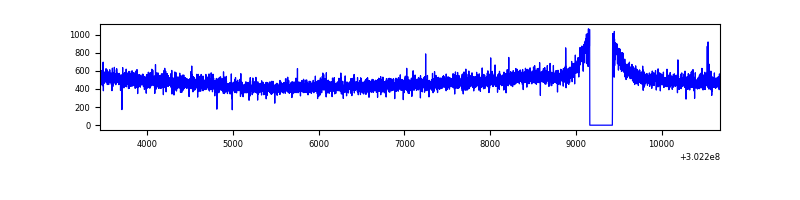 |
| D | 7236 | 6972 | 168 | 168 | 2.32% | 2.41% | 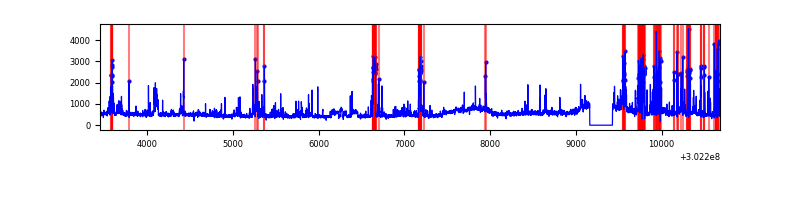 |
Top three noisy pixels from each quadrant. If the there are fewer than three noisy pixels in the level2.evt file, extra rows are filled as -1
| Pixel properties | Quadrant properties | ||||||
|---|---|---|---|---|---|---|---|
| Quadrant | DetID | PixID | Counts | Sigma | Mean | Median | Sigma |
| A | 5 | 16 | 21488 | 117.59 | 863 | 842 | 175.6 |
| A | 0 | 226 | 7454 | 37.66 | 863 | 842 | 175.6 |
| A | 3 | 137 | 7101 | 35.65 | 863 | 842 | 175.6 |
| B | 7 | 220 | 64432 | 388.69 | 852 | 832 | 163.6 |
| B | 3 | 64 | 35820 | 213.83 | 852 | 832 | 163.6 |
| B | 0 | 229 | 34836 | 207.81 | 852 | 832 | 163.6 |
| C | 14 | 238 | 126678 | 645.6 | 827 | 833 | 194.9 |
| C | 9 | 54 | 10207 | 48.09 | 827 | 833 | 194.9 |
| C | 3 | 233 | 8973 | 41.76 | 827 | 833 | 194.9 |
| D | 1 | 52 | 699486 | 3474.08 | 832 | 809 | 201.1 |
| D | 5 | 222 | 306210 | 1518.57 | 832 | 809 | 201.1 |
| D | 2 | 165 | 192765 | 954.48 | 832 | 809 | 201.1 |
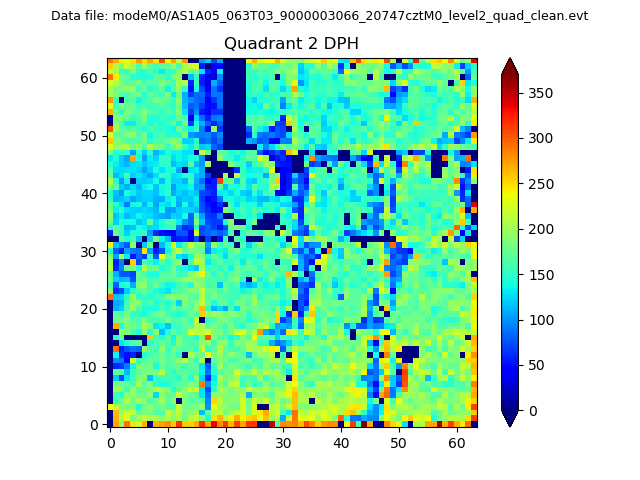
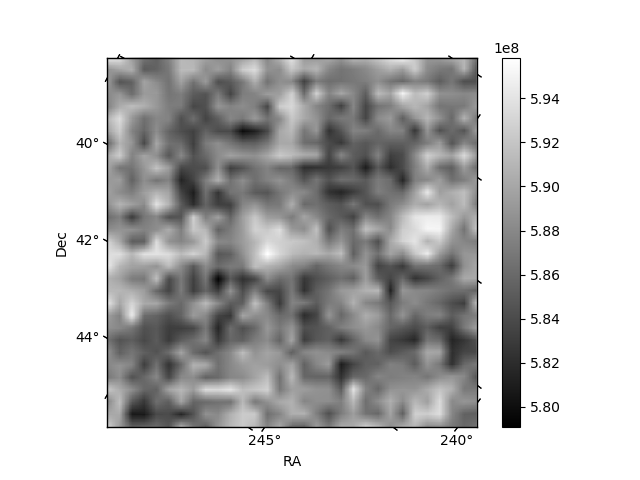
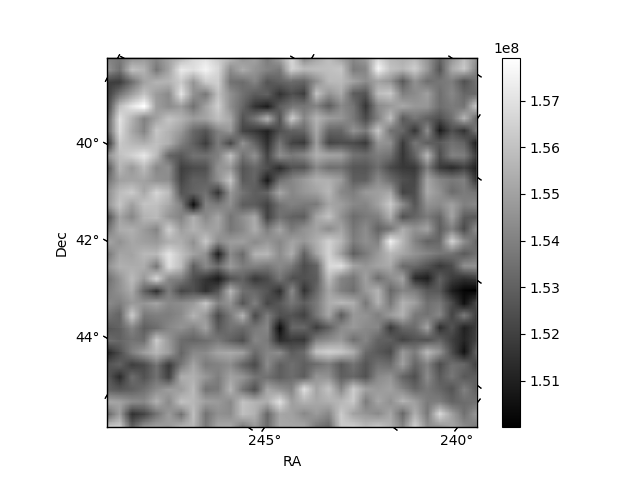
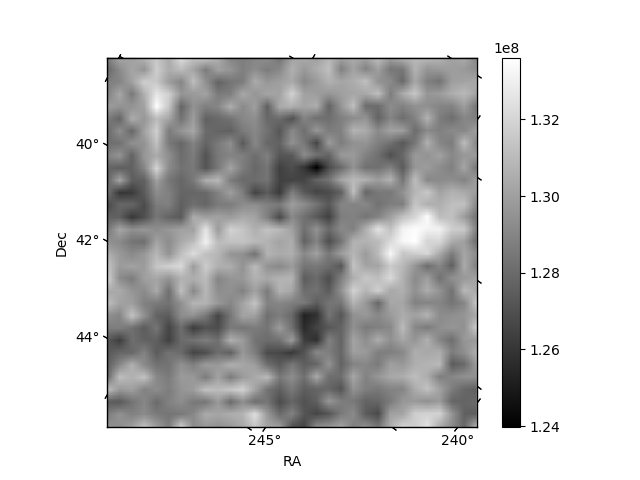
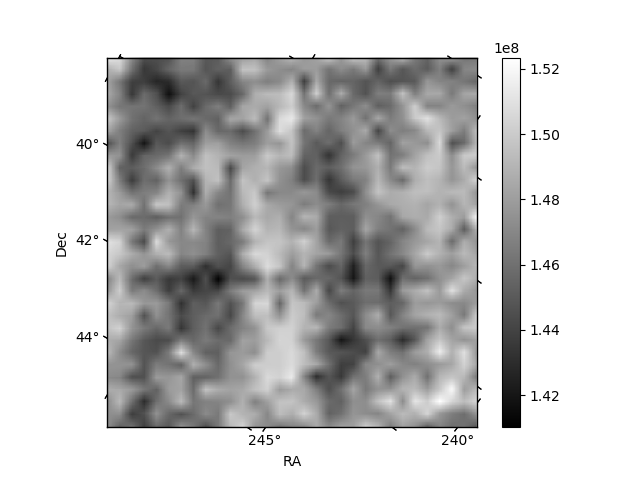
Histogram calculated using DETX and DETY for each event in the final _common_clean file
| Quadrant A | 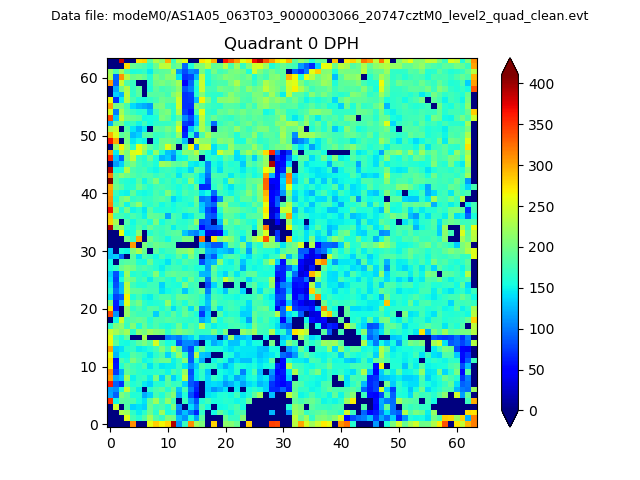 |
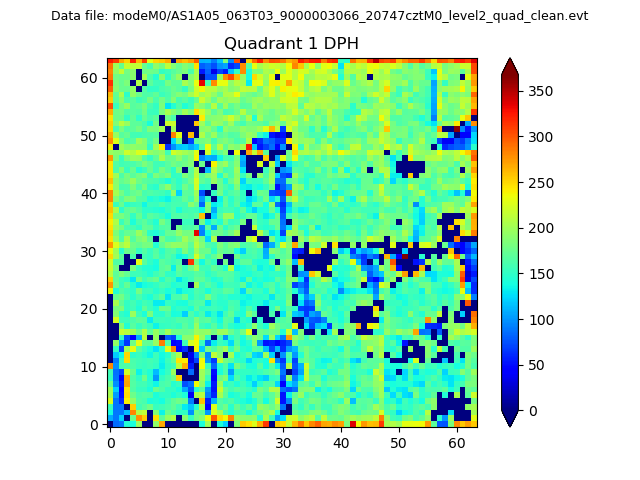 |
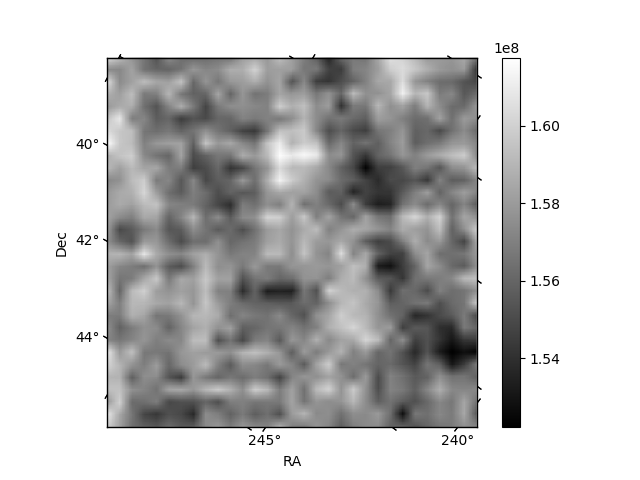
Quadrant B |
|---|---|---|---|
| Quadrant D | 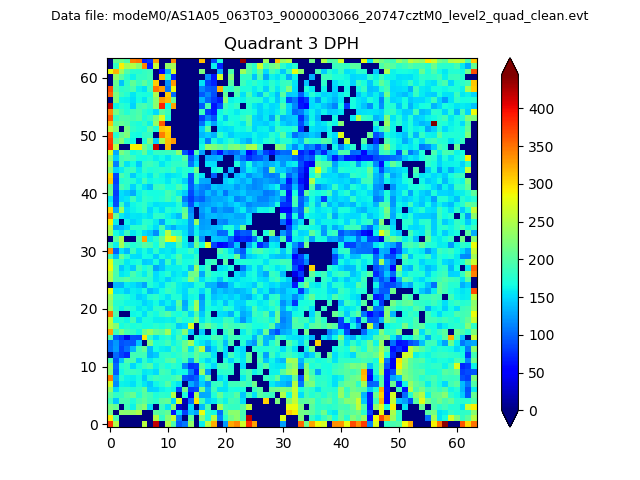 |
 |
Quadrant C |
| Plot type | Count rate plots | Images |
|---|---|---|
| Comparison with Poisson distribution Blue bars denote a histogram of data divided into 1 sec bins. Red curve is a Poisson curve with rate = median count rate of data. |
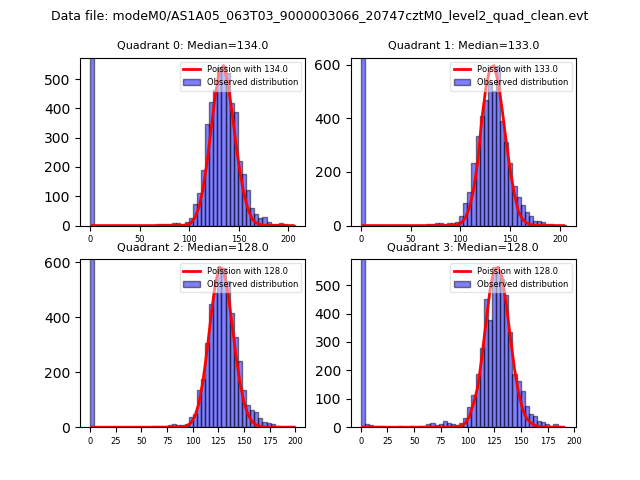 |
 |
| Quadrant-wise count rates Data is divided into 100 sec bins |
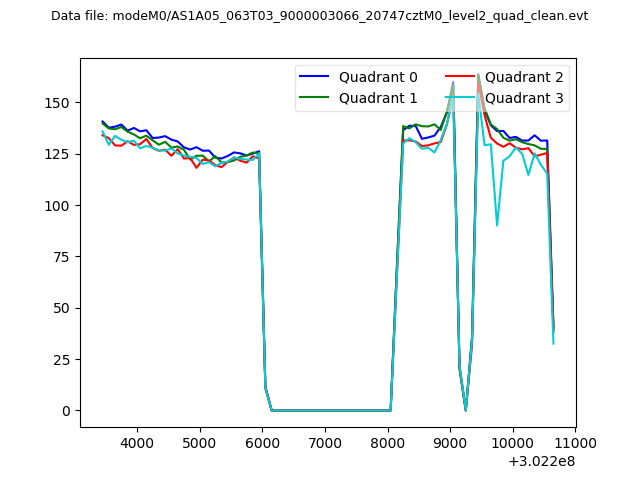 |
|
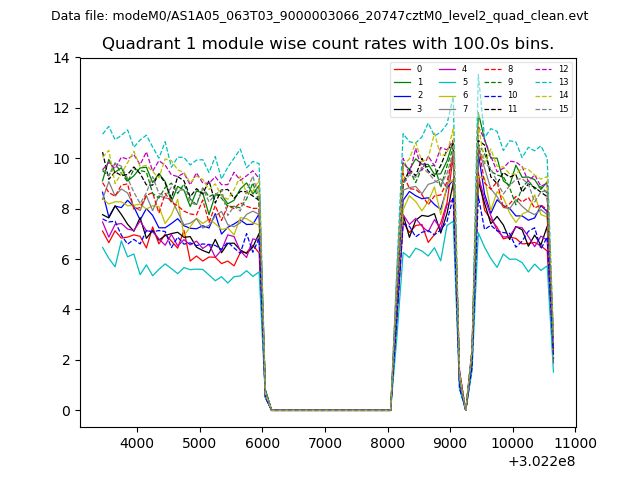
| Module-wise count rates for Quadrant A Data is divided into 100 sec bins |
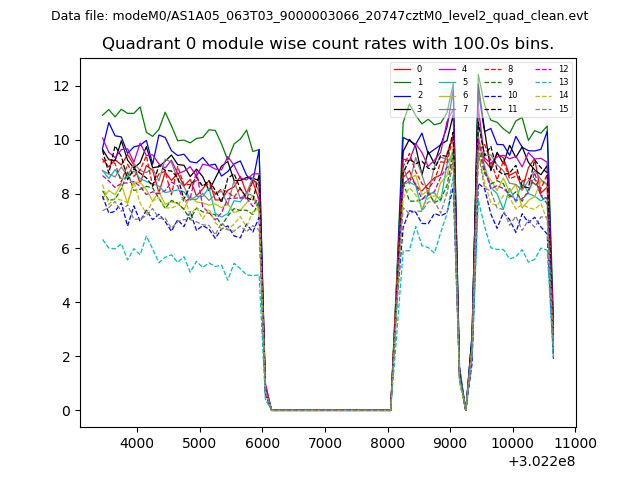 |
 |
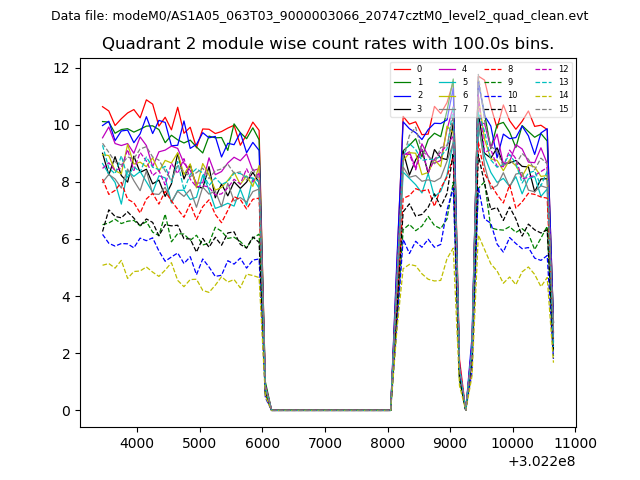
| Module-wise count rates for Quadrant B Data is divided into 100 sec bins |
 |
 |
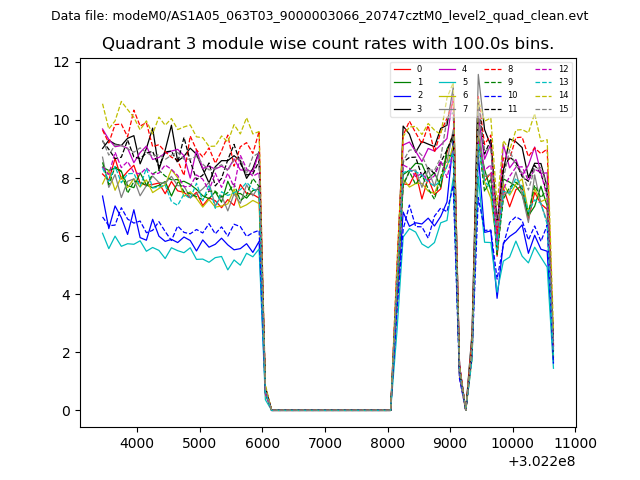
| Module-wise count rates for Quadrant C Data is divided into 100 sec bins |
 |
 |
| Module-wise count rates for Quadrant D Data is divided into 100 sec bins |
 |
 |
| Parameter | Plot |
|---|---|
| CZT HV Monitor | 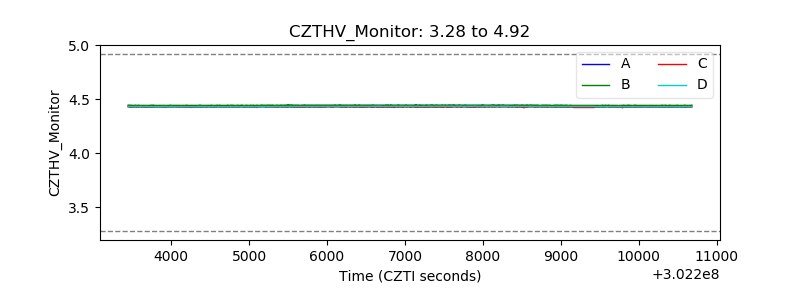 |
| D_VDD | 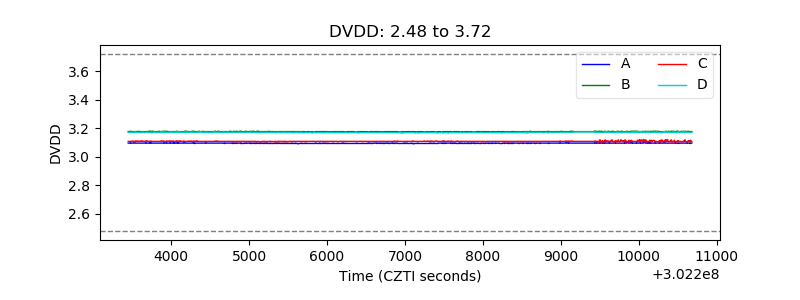 |
| Temperature 1 | 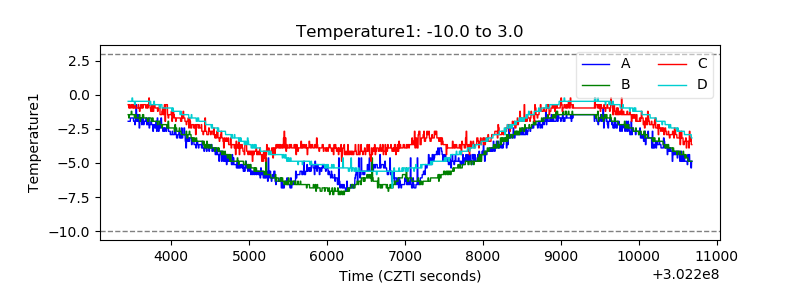 |
| Veto HV Monitor | 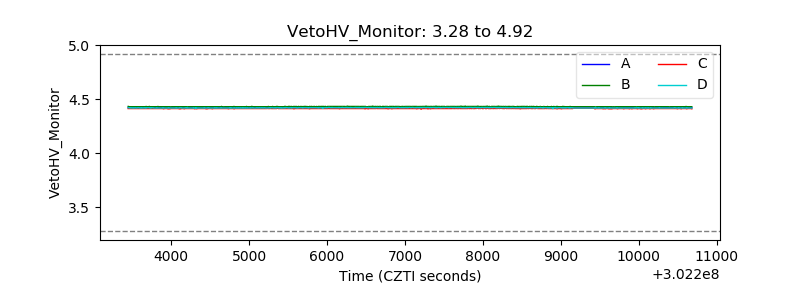 |
| Veto LLD | 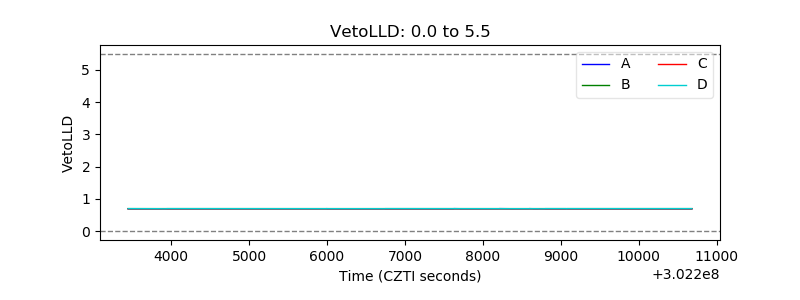 |
| Alpha Counter |  |
| _CPM_Rate | 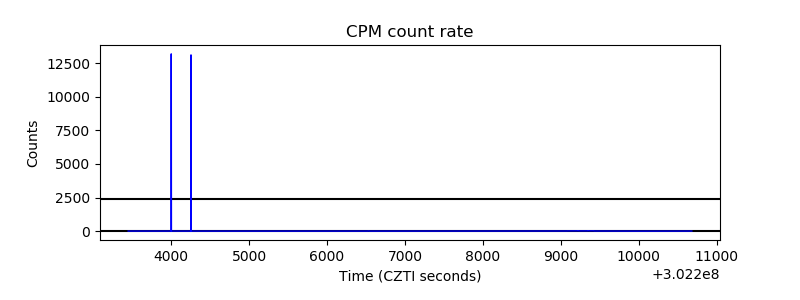 |
| CZT Counter | 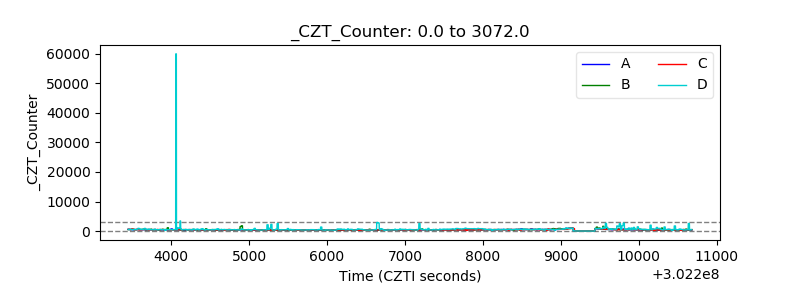 |
| +2.5 Volts monitor |  |
| +5 Volts monitor |  |
| _ROLL_ROT | 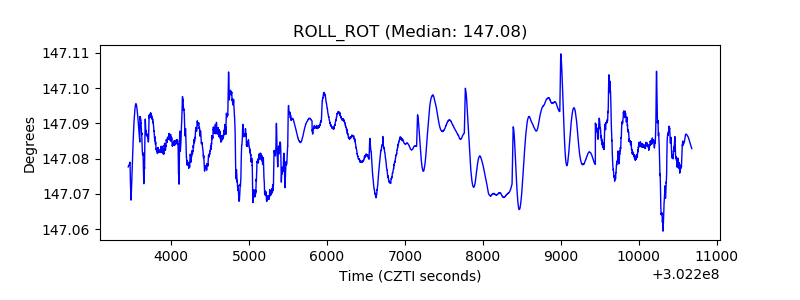 |
| _Roll_DEC | 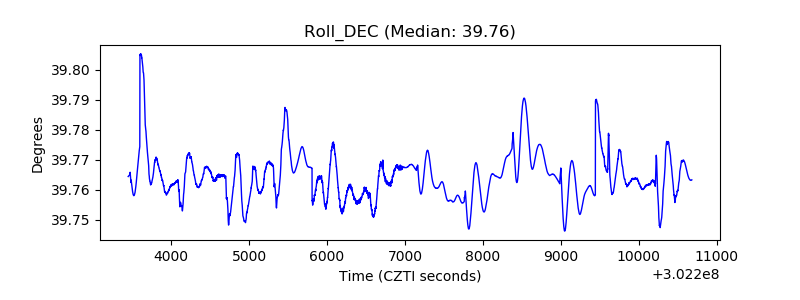 |
| _Roll_RA |  |
| Veto Counter | 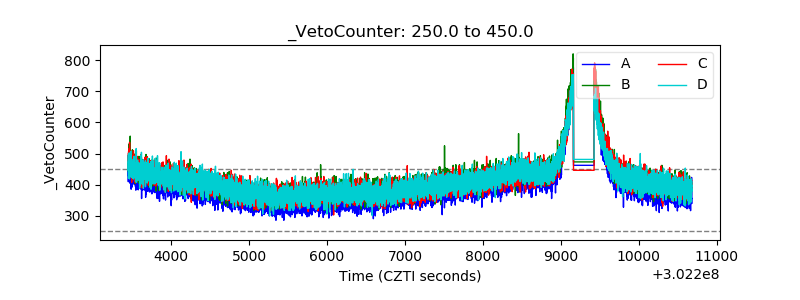 |