| Param | Original file | Final file |
|---|---|---|
| Filename | modeM0/AS1A05_101T10_9000003068cztM0_level2.fits | modeM0/AS1A05_101T10_9000003068cztM0_level2_quad_clean.evt |
| Size (bytes) | 163,693,440 | 215,015,040 |
| Size | 156.1 MB | 205.1 MB |
| Events in quadrant A | 999,214 | 1,399,150 |
| Events in quadrant B | 953,072 | 1,382,885 |
| Events in quadrant C | 961,348 | 1,308,316 |
| Events in quadrant D | 826,638 | 1,204,568 |
| Mode SS | |||
|---|---|---|---|
| Quadrant | BADHDUFLAG | Total packets | Discarded packets |
| A | 0 | 360 | 0 |
| B | 0 | 360 | 0 |
| C | 0 | 360 | 0 |
| D | 0 | 360 | 0 |
| Mode M9 | |||
|---|---|---|---|
| Quadrant | BADHDUFLAG | Total packets | Discarded packets |
| A | 0 | 13 | 0 |
| B | 0 | 13 | 0 |
| C | 0 | 13 | 0 |
| D | 0 | 13 | 0 |
| Mode M0 | |||
|---|---|---|---|
| Quadrant | BADHDUFLAG | Total packets | Discarded packets |
| A | 0 | 36265 | 0 |
| B | 0 | 36837 | 0 |
| C | 0 | 41171 | 0 |
| D | 0 | 50473 | 0 |
| Quadrant | Total seconds | Saturated seconds | Saturation percentage |
|---|---|---|---|
| A | 17651 | 70 | 0.396578% |
| B | 17651 | 120 | 0.679848% |
| C | 17651 | 570 | 3.229279% |
| D | 17651 | 1061 | 6.010991% |
Noise dominated data is calculated using 1-second bins in cleaned event files. If a bin has >2000 counts, and if more than 50% of those come from <1% of pixels, then it is considered to be noise-dominated and hence unusable.
| Quadrant | # 1 sec bins | Bins with >0 counts | Bins with >2000 counts | High rate bins dominated by noise | Noise dominated (total time) | Noise dominated (detector-on time) | Marked lightcurve |
|---|---|---|---|---|---|---|---|
| A | 19071 | 17651 | 0 | 0 | 0.00% | 0.00% | 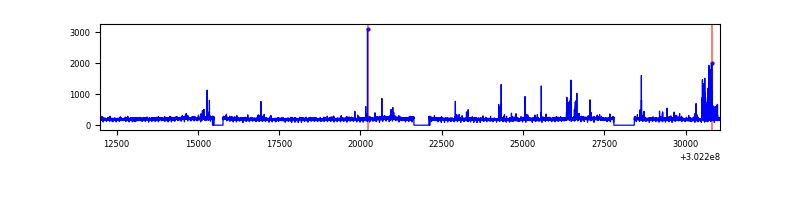 |
| B | 19071 | 17651 | 0 | 0 | 0.00% | 0.00% | 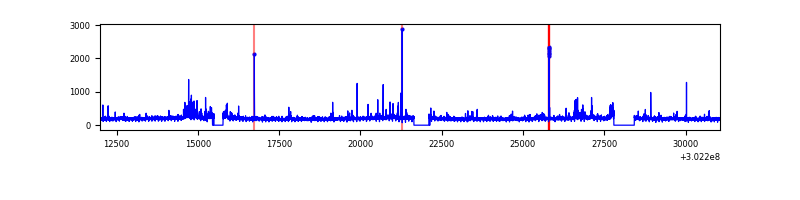 |
| C | 19071 | 17650 | 0 | 0 | 0.00% | 0.00% | 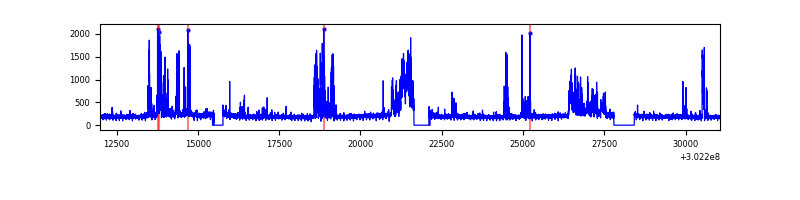 |
| D | 19071 | 17612 | 0 | 0 | 0.00% | 0.00% | 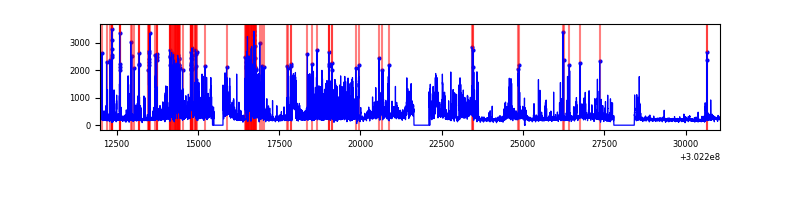 |
Top three noisy pixels from each quadrant. If the there are fewer than three noisy pixels in the level2.evt file, extra rows are filled as -1
| Pixel properties | Quadrant properties | ||||||
|---|---|---|---|---|---|---|---|
| Quadrant | DetID | PixID | Counts | Sigma | Mean | Median | Sigma |
| A | 0 | 29 | 975 | 10.94 | 259 | 243 | 66.9 |
| A | 9 | 19 | 778 | 7.99 | 259 | 243 | 66.9 |
| A | 0 | 30 | 764 | 7.79 | 259 | 243 | 66.9 |
| B | 2 | 9 | 812 | 11.08 | 251 | 240 | 51.6 |
| B | 3 | 17 | 689 | 8.7 | 251 | 240 | 51.6 |
| B | 2 | 8 | 668 | 8.29 | 251 | 240 | 51.6 |
| C | 1 | 80 | 761 | 7.76 | 253 | 236 | 67.6 |
| C | 12 | 241 | 733 | 7.35 | 253 | 236 | 67.6 |
| C | 1 | 81 | 726 | 7.24 | 253 | 236 | 67.6 |
| D | 10 | 189 | 608 | 6.05 | 235 | 213 | 65.3 |
| D | 3 | 14 | 593 | 5.82 | 235 | 213 | 65.3 |
| D | 7 | 3 | 581 | 5.64 | 235 | 213 | 65.3 |
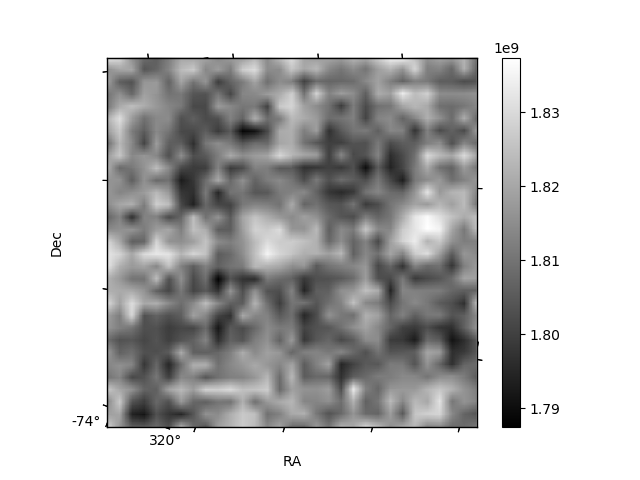
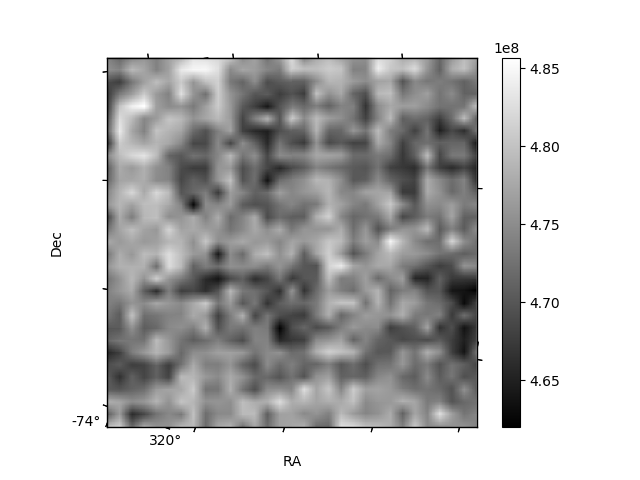
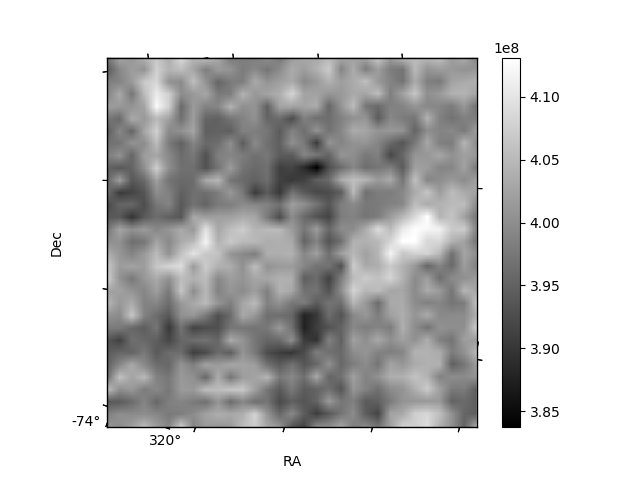
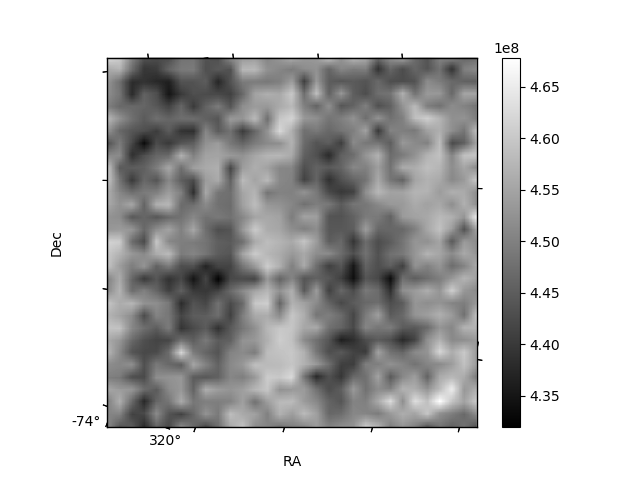
Histogram calculated using DETX and DETY for each event in the final _common_clean file
| Quadrant A | 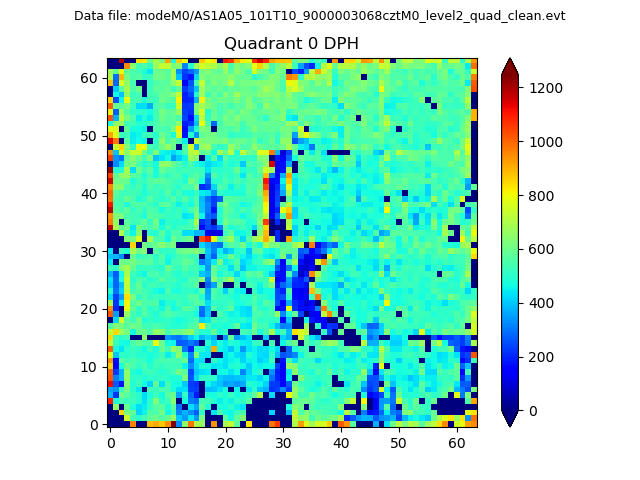 |
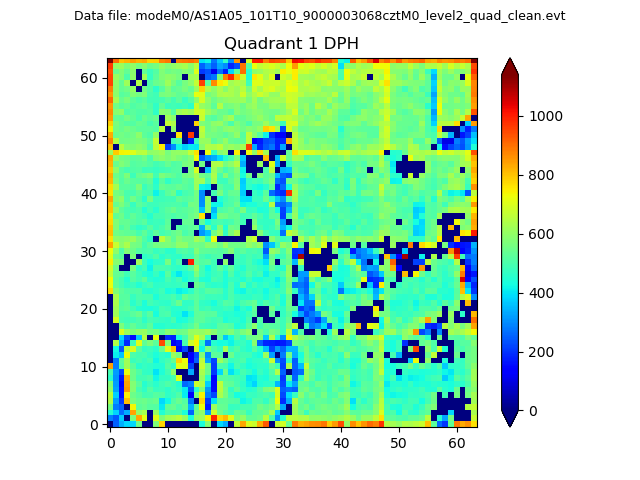 |
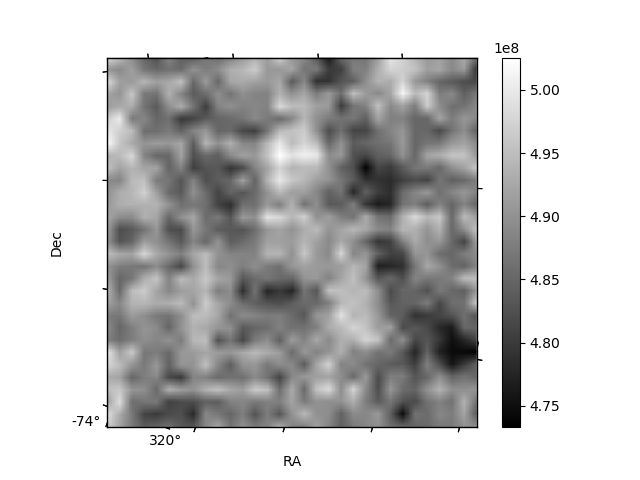
Quadrant B |
|---|---|---|---|
| Quadrant D | 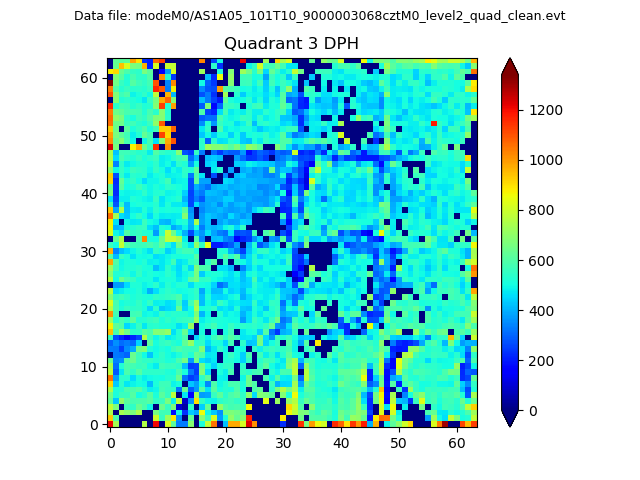 |
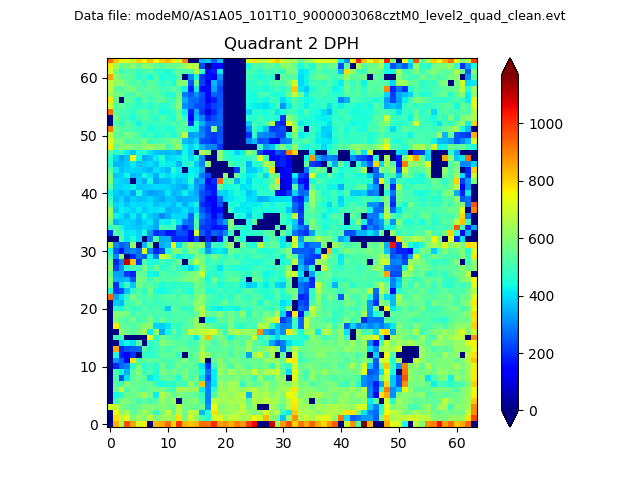 |
Quadrant C |
| Plot type | Count rate plots | Images |
|---|---|---|
| Comparison with Poisson distribution Blue bars denote a histogram of data divided into 1 sec bins. Red curve is a Poisson curve with rate = median count rate of data. |
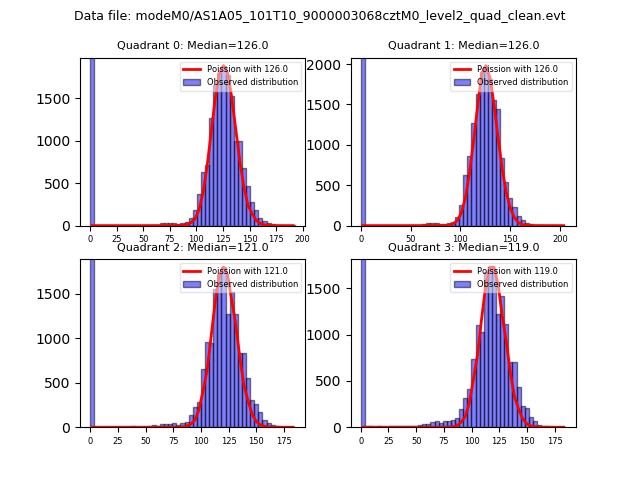 |
 |
| Quadrant-wise count rates Data is divided into 100 sec bins |
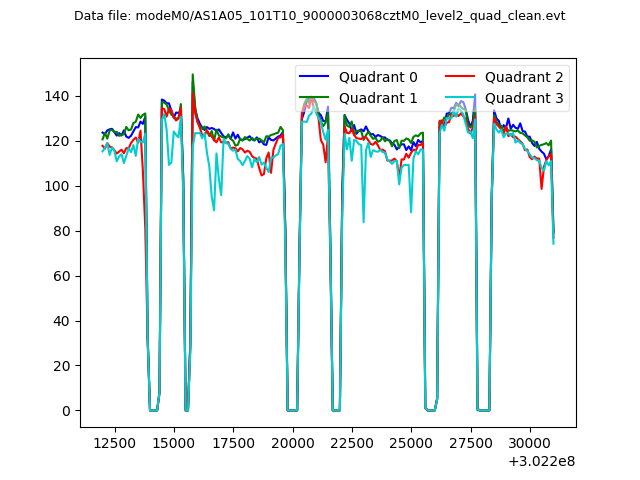 |
|
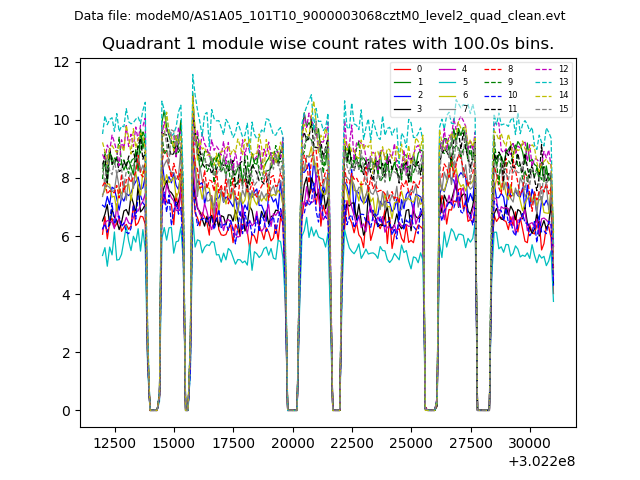
| Module-wise count rates for Quadrant A Data is divided into 100 sec bins |
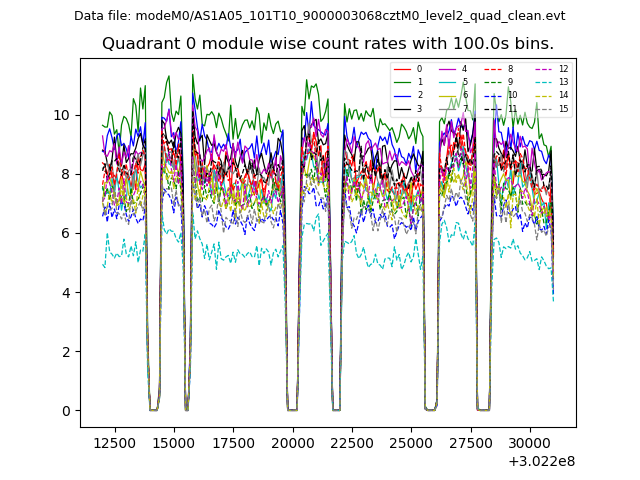 |
 |
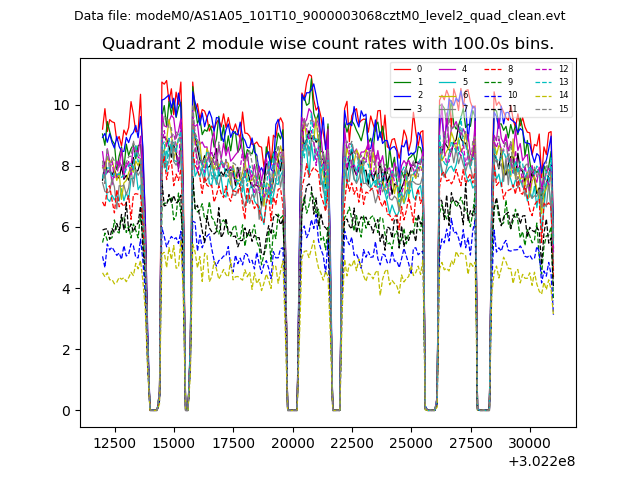
| Module-wise count rates for Quadrant B Data is divided into 100 sec bins |
 |
 |
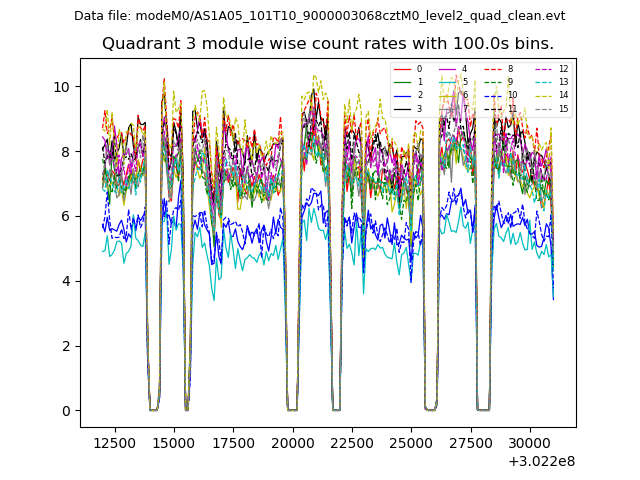
| Module-wise count rates for Quadrant C Data is divided into 100 sec bins |
 |
 |
| Module-wise count rates for Quadrant D Data is divided into 100 sec bins |
 |
 |
| Parameter | Plot |
|---|---|
| CZT HV Monitor | 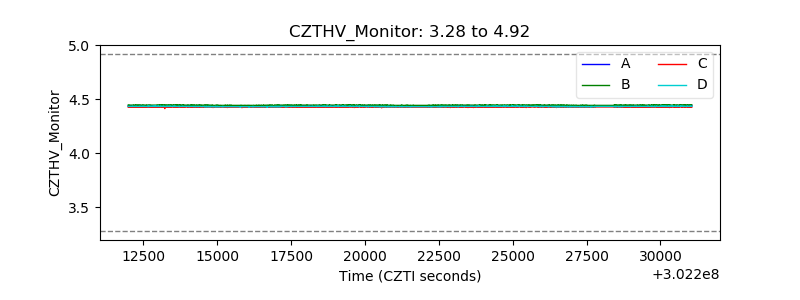 |
| D_VDD | 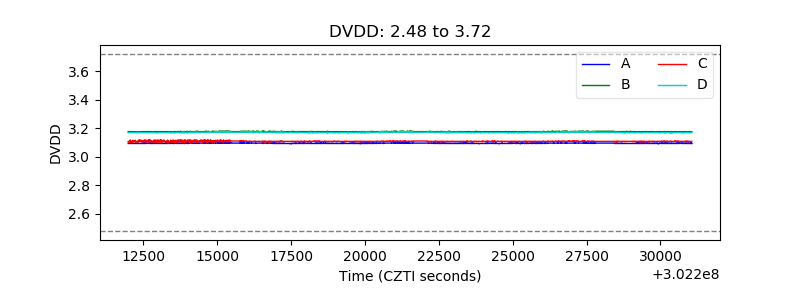 |
| Temperature 1 | 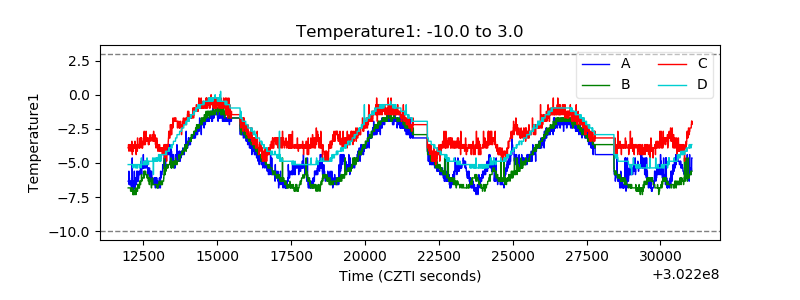 |
| Veto HV Monitor | 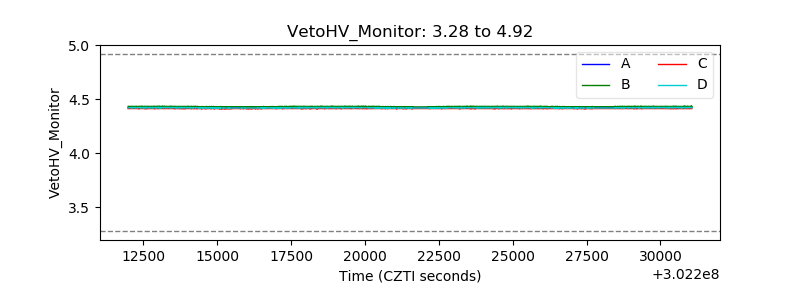 |
| Veto LLD | 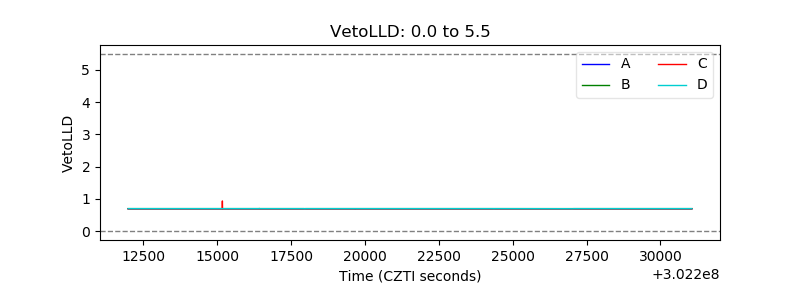 |
| Alpha Counter | 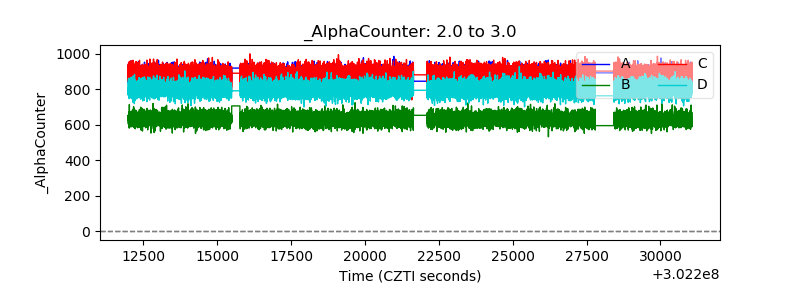 |
| _CPM_Rate | 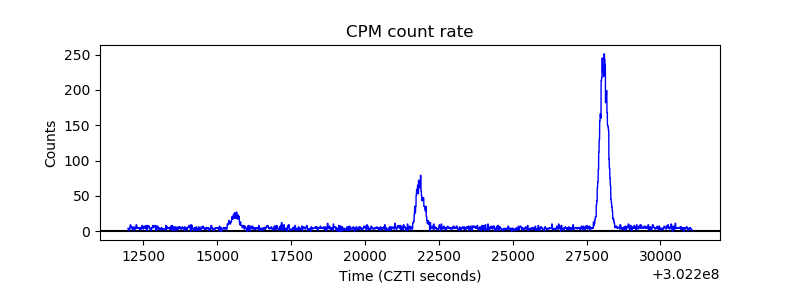 |
| CZT Counter | 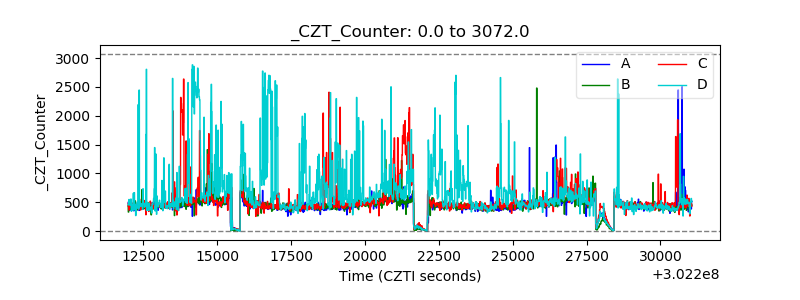 |
| +2.5 Volts monitor | 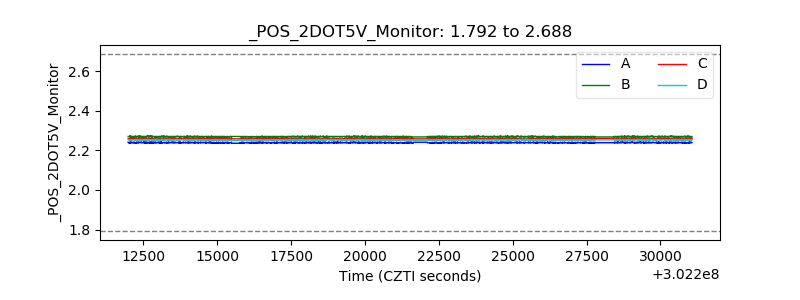 |
| +5 Volts monitor | 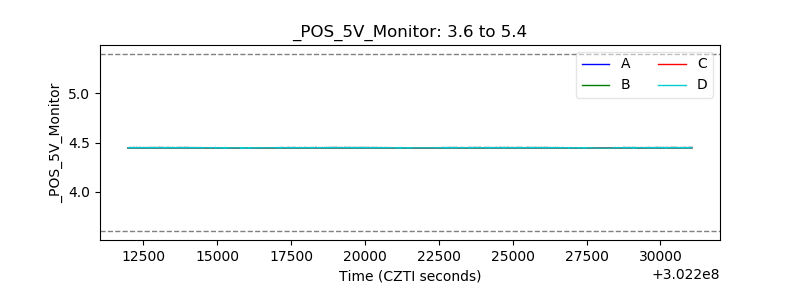 |
| _ROLL_ROT | 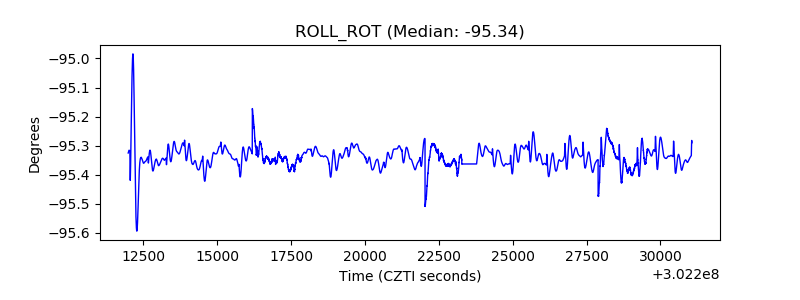 |
| _Roll_DEC | 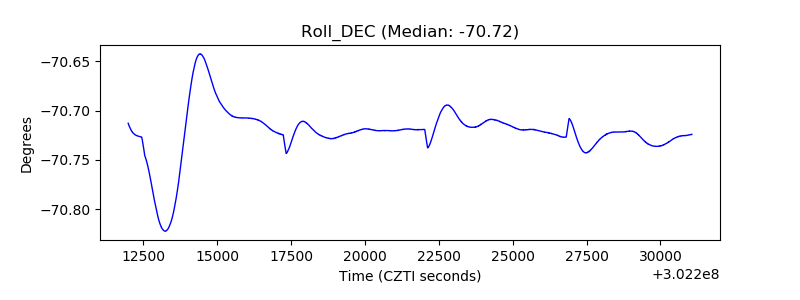 |
| _Roll_RA | 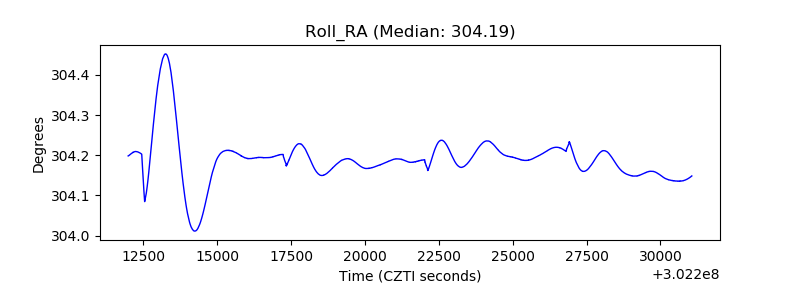 |
| Veto Counter | 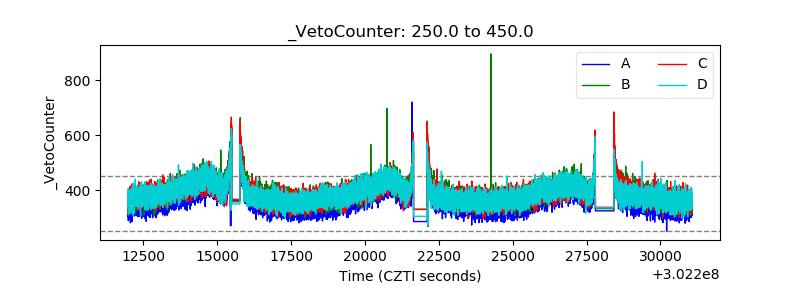 |