| Param | Original file | Final file |
|---|---|---|
| Filename | modeM0/AS1A05_101T10_9000003068_20747cztM0_level2.evt | modeM0/AS1A05_101T10_9000003068_20747cztM0_level2_quad_clean.evt |
| Size (bytes) | 414,982,080 | 84,107,520 |
| Size | 395.8 MB | 80.2 MB |
| Events in quadrant A | 2,323,174 | 567,371 |
| Events in quadrant B | 2,475,872 | 566,947 |
| Events in quadrant C | 2,826,753 | 542,209 |
| Events in quadrant D | 4,601,074 | 518,986 |
| Mode SS | |||
|---|---|---|---|
| Quadrant | BADHDUFLAG | Total packets | Discarded packets |
| A | 0 | 104 | 0 |
| B | 0 | 104 | 0 |
| C | 0 | 104 | 0 |
| D | 0 | 104 | 0 |
| Mode M9 | |||
|---|---|---|---|
| Quadrant | BADHDUFLAG | Total packets | Discarded packets |
| A | 0 | 2 | 0 |
| B | 0 | 2 | 0 |
| C | 0 | 2 | 0 |
| D | 0 | 2 | 0 |
| Mode M0 | |||
|---|---|---|---|
| Quadrant | BADHDUFLAG | Total packets | Discarded packets |
| A | 0 | 10247 | 2 |
| B | 0 | 10712 | 3 |
| C | 0 | 11700 | 2 |
| D | 0 | 17147 | 2 |
| Quadrant | Total seconds | Saturated seconds | Saturation percentage |
|---|---|---|---|
| A | 5005 | 13 | 0.259740% |
| B | 5004 | 40 | 0.799361% |
| C | 5004 | 207 | 4.136691% |
| D | 5004 | 743 | 14.848122% |
Noise dominated data is calculated using 1-second bins in cleaned event files. If a bin has >2000 counts, and if more than 50% of those come from <1% of pixels, then it is considered to be noise-dominated and hence unusable.
| Quadrant | # 1 sec bins | Bins with >0 counts | Bins with >2000 counts | High rate bins dominated by noise | Noise dominated (total time) | Noise dominated (detector-on time) | Marked lightcurve |
|---|---|---|---|---|---|---|---|
| A | 5315 | 5007 | 0 | 0 | 0.00% | 0.00% | 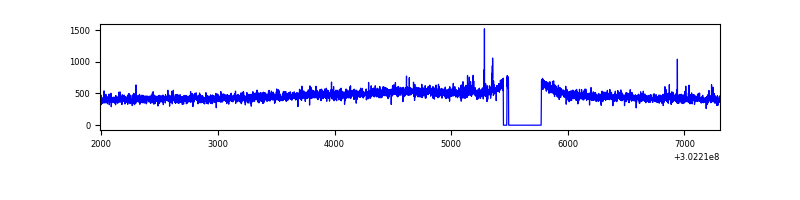 |
| B | 5314 | 5006 | 5 | 5 | 0.09% | 0.10% | 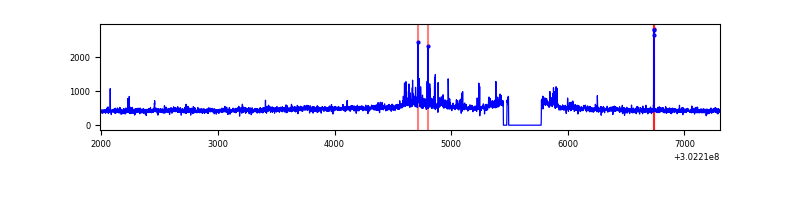 |
| C | 5314 | 5006 | 87 | 87 | 1.64% | 1.74% | 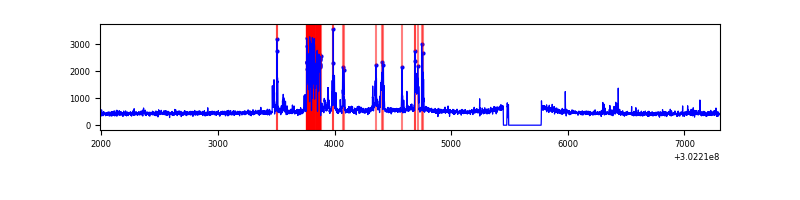 |
| D | 5314 | 5006 | 594 | 594 | 11.18% | 11.87% |  |
Top three noisy pixels from each quadrant. If the there are fewer than three noisy pixels in the level2.evt file, extra rows are filled as -1
| Pixel properties | Quadrant properties | ||||||
|---|---|---|---|---|---|---|---|
| Quadrant | DetID | PixID | Counts | Sigma | Mean | Median | Sigma |
| A | 5 | 16 | 12599 | 98.64 | 600 | 587 | 121.8 |
| A | 0 | 226 | 5265 | 38.41 | 600 | 587 | 121.8 |
| A | 3 | 137 | 5044 | 36.6 | 600 | 587 | 121.8 |
| B | 7 | 220 | 73018 | 634.67 | 597 | 581 | 114.1 |
| B | 0 | 190 | 22108 | 188.61 | 597 | 581 | 114.1 |
| B | 12 | 111 | 13630 | 114.33 | 597 | 581 | 114.1 |
| C | 9 | 54 | 481636 | 3588.66 | 571 | 574 | 134.1 |
| C | 14 | 238 | 88539 | 656.21 | 571 | 574 | 134.1 |
| C | 3 | 233 | 12772 | 90.99 | 571 | 574 | 134.1 |
| D | 5 | 222 | 1603283 | 12042.0 | 545 | 530 | 133.1 |
| D | 1 | 52 | 701661 | 5267.82 | 545 | 530 | 133.1 |
| D | 1 | 20 | 190230 | 1425.28 | 545 | 530 | 133.1 |
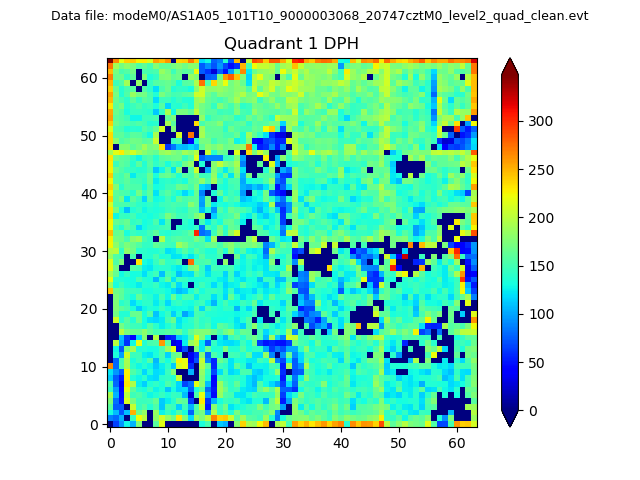
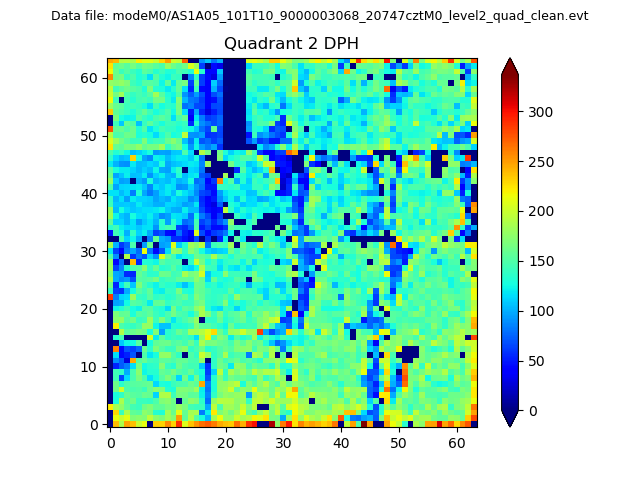
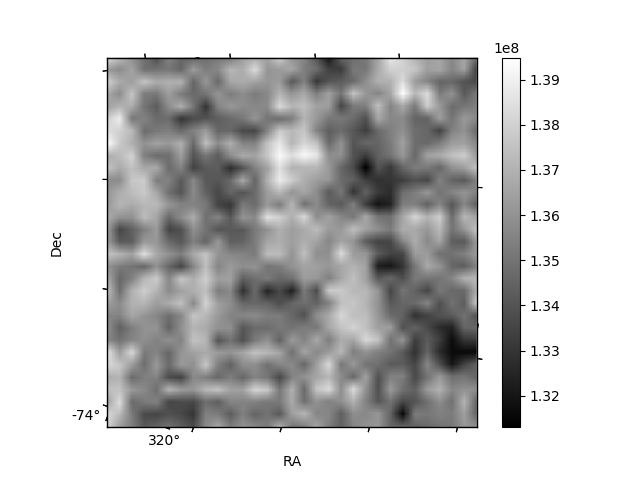
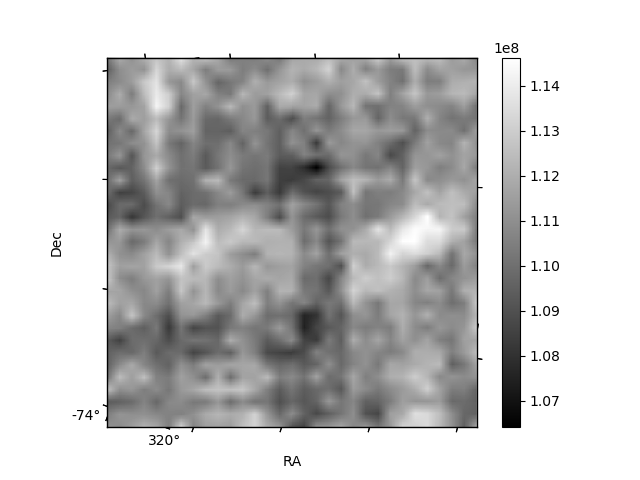
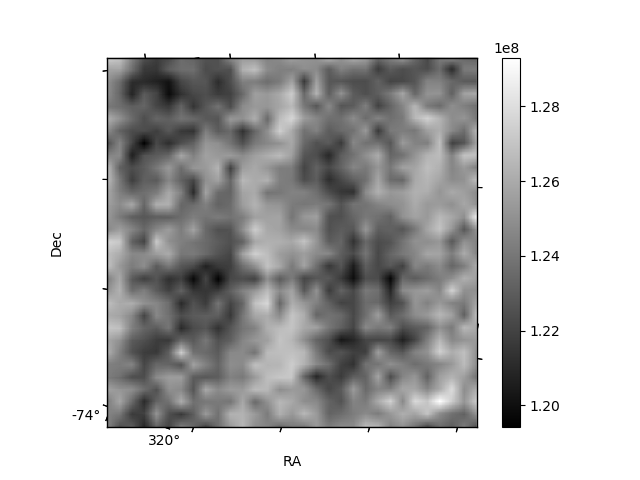
Histogram calculated using DETX and DETY for each event in the final _common_clean file
| Quadrant A |  |
 |
Quadrant B |
|---|---|---|---|
| Quadrant D | 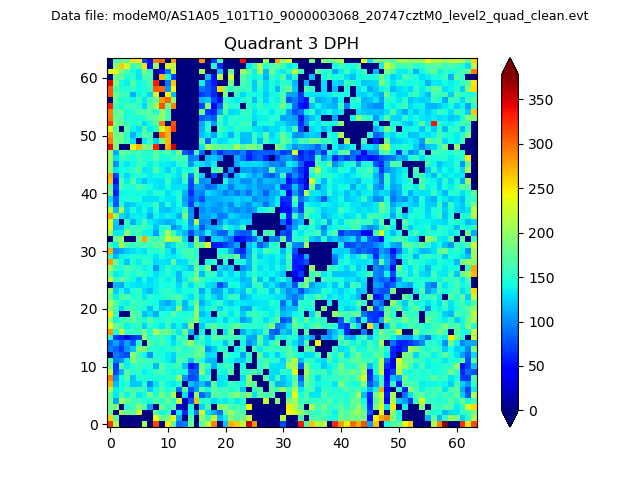 |
 |
Quadrant C |
| Plot type | Count rate plots | Images |
|---|---|---|
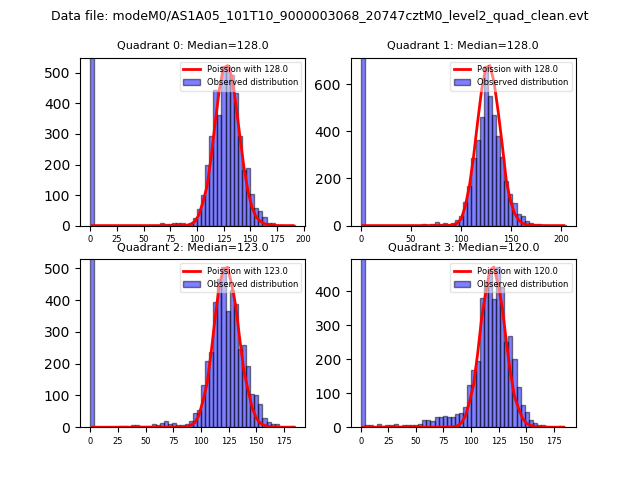
| Comparison with Poisson distribution Blue bars denote a histogram of data divided into 1 sec bins. Red curve is a Poisson curve with rate = median count rate of data. |
 |
 |
| Quadrant-wise count rates Data is divided into 100 sec bins |
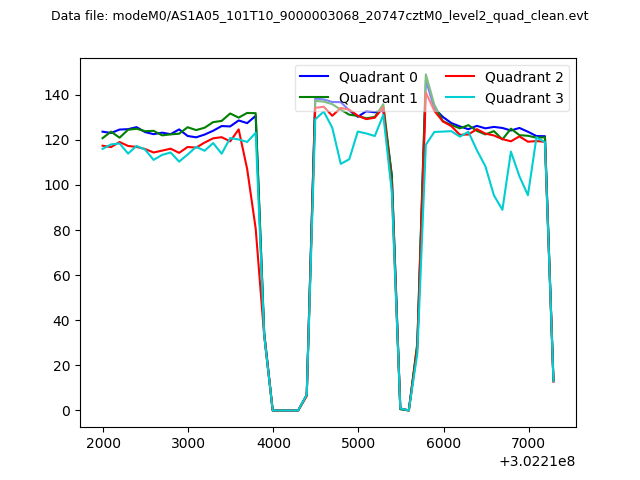 |
|
| Module-wise count rates for Quadrant A Data is divided into 100 sec bins |
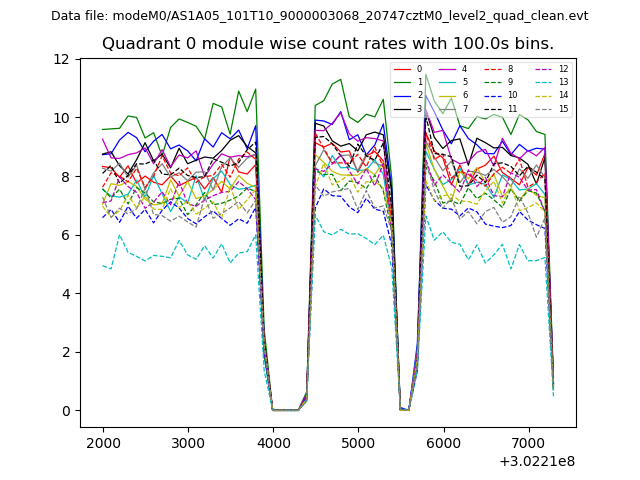 |
 |
| Module-wise count rates for Quadrant B Data is divided into 100 sec bins |
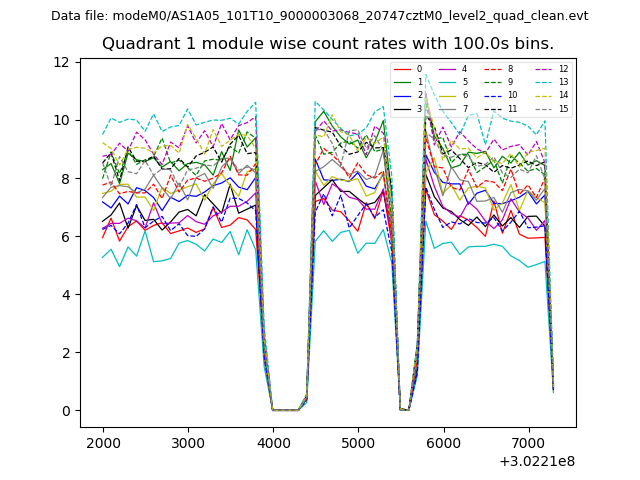 |
 |
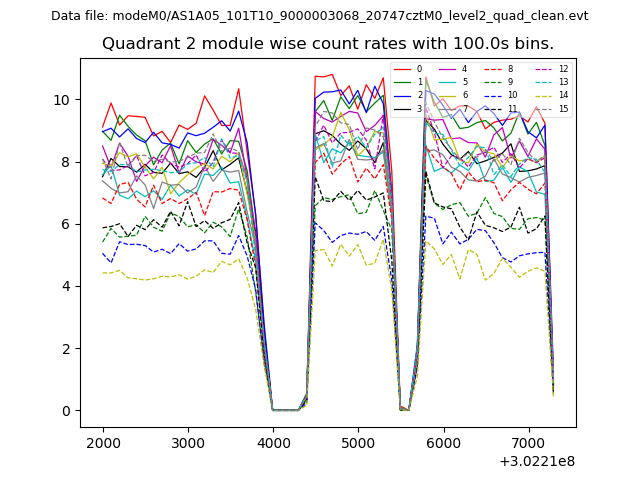
| Module-wise count rates for Quadrant C Data is divided into 100 sec bins |
 |
 |
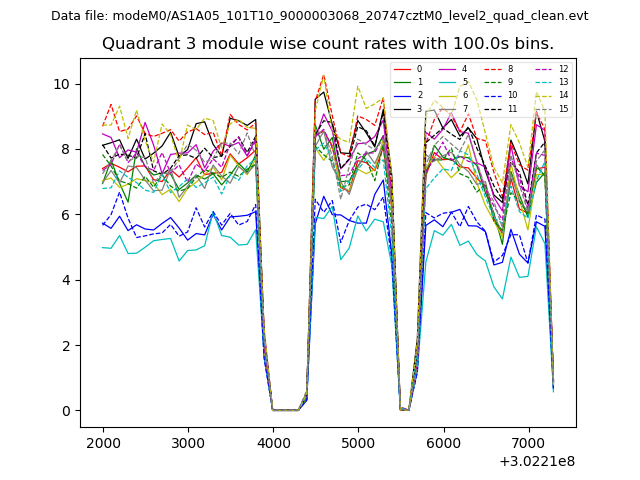
| Module-wise count rates for Quadrant D Data is divided into 100 sec bins |
 |
 |
| Parameter | Plot |
|---|---|
| CZT HV Monitor | 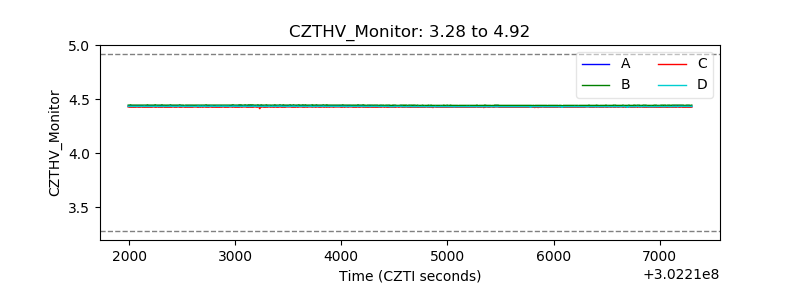 |
| D_VDD | 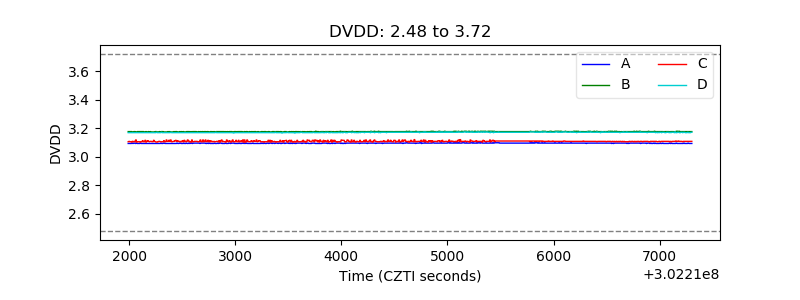 |
| Temperature 1 | 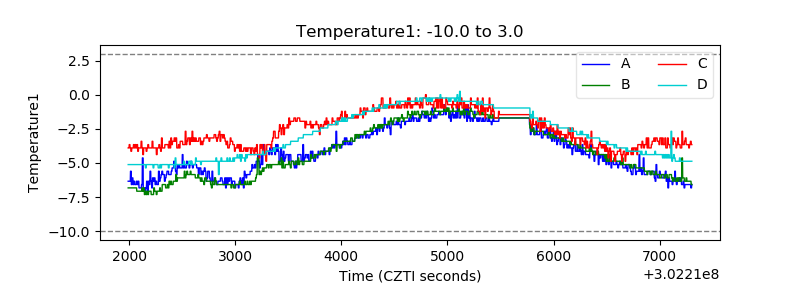 |
| Veto HV Monitor | 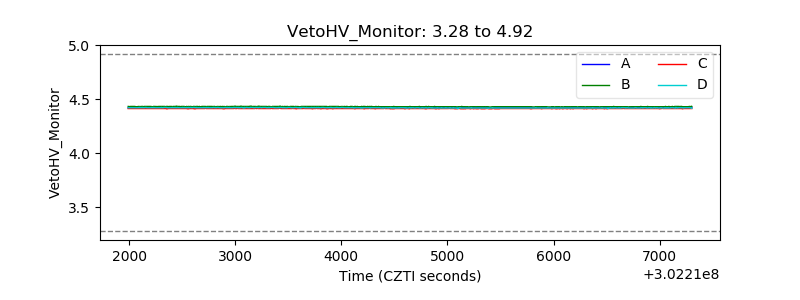 |
| Veto LLD |  |
| Alpha Counter | 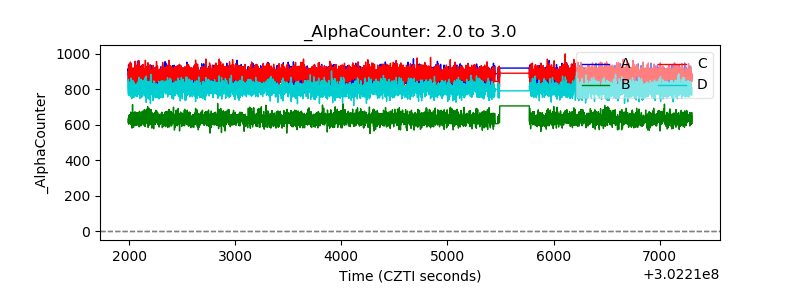 |
| _CPM_Rate | 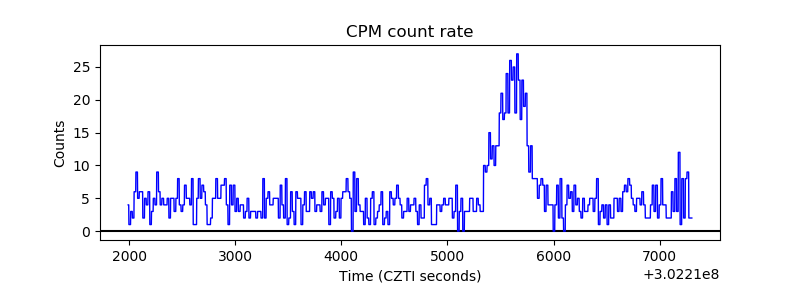 |
| CZT Counter | 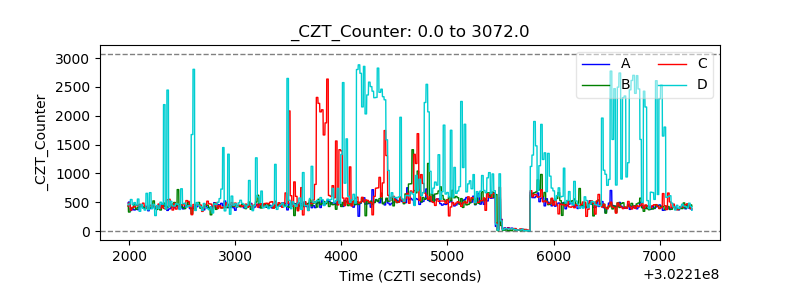 |
| +2.5 Volts monitor |  |
| +5 Volts monitor |  |
| _ROLL_ROT |  |
| _Roll_DEC | 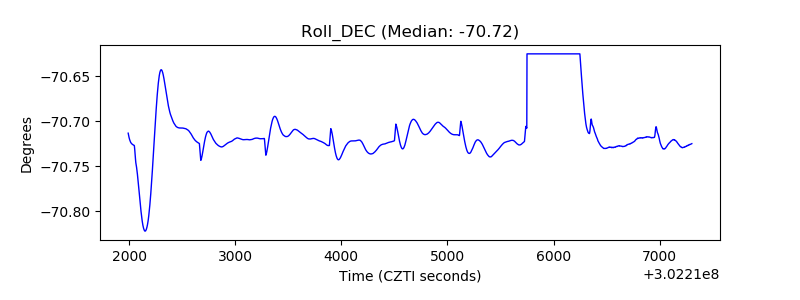 |
| _Roll_RA | 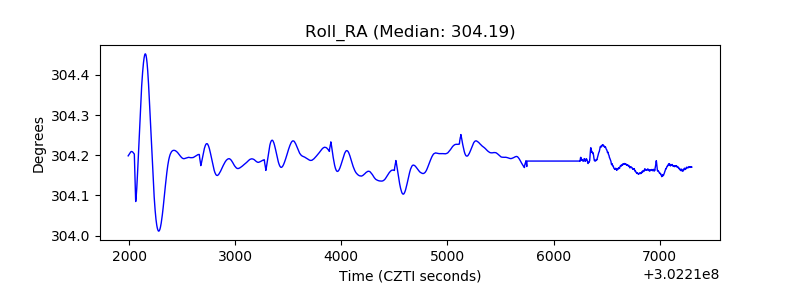 |
| Veto Counter | 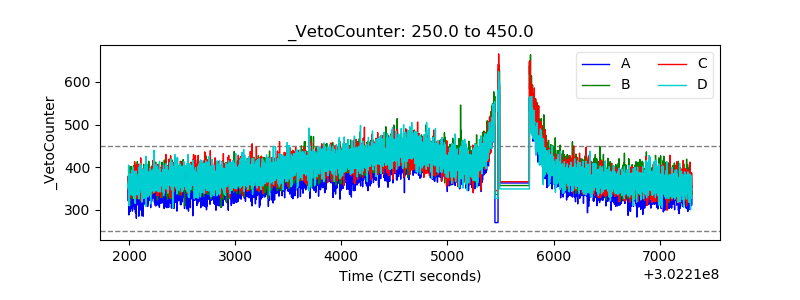 |