| Param | Original file | Final file |
|---|---|---|
| Filename | modeM0/AS1A05_101T10_9000003068_20748cztM0_level2.evt | modeM0/AS1A05_101T10_9000003068_20748cztM0_level2_quad_clean.evt |
| Size (bytes) | 589,415,040 | 127,736,640 |
| Size | 562.1 MB | 121.8 MB |
| Events in quadrant A | 3,350,256 | 863,322 |
| Events in quadrant B | 3,467,337 | 859,792 |
| Events in quadrant C | 4,192,463 | 830,819 |
| Events in quadrant D | 6,337,362 | 798,132 |
| Mode SS | |||
|---|---|---|---|
| Quadrant | BADHDUFLAG | Total packets | Discarded packets |
| A | 0 | 152 | 0 |
| B | 0 | 152 | 0 |
| C | 0 | 152 | 0 |
| D | 0 | 152 | 0 |
| Mode M9 | |||
|---|---|---|---|
| Quadrant | BADHDUFLAG | Total packets | Discarded packets |
| A | 0 | 6 | 0 |
| B | 0 | 7 | 0 |
| C | 0 | 7 | 0 |
| D | 0 | 7 | 0 |
| Mode M0 | |||
|---|---|---|---|
| Quadrant | BADHDUFLAG | Total packets | Discarded packets |
| A | 0 | 15115 | 2 |
| B | 0 | 15310 | 2 |
| C | 0 | 17471 | 2 |
| D | 0 | 24002 | 2 |
| Quadrant | Total seconds | Saturated seconds | Saturation percentage |
|---|---|---|---|
| A | 7424 | 29 | 0.390625% |
| B | 7424 | 46 | 0.619612% |
| C | 7424 | 264 | 3.556034% |
| D | 7424 | 504 | 6.788793% |
Noise dominated data is calculated using 1-second bins in cleaned event files. If a bin has >2000 counts, and if more than 50% of those come from <1% of pixels, then it is considered to be noise-dominated and hence unusable.
| Quadrant | # 1 sec bins | Bins with >0 counts | Bins with >2000 counts | High rate bins dominated by noise | Noise dominated (total time) | Noise dominated (detector-on time) | Marked lightcurve |
|---|---|---|---|---|---|---|---|
| A | 7904 | 7426 | 1 | 1 | 0.01% | 0.01% | 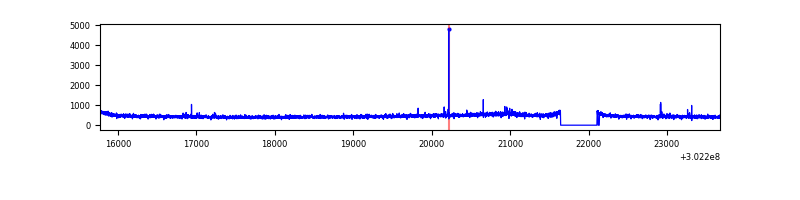 |
| B | 7904 | 7426 | 7 | 7 | 0.09% | 0.09% | 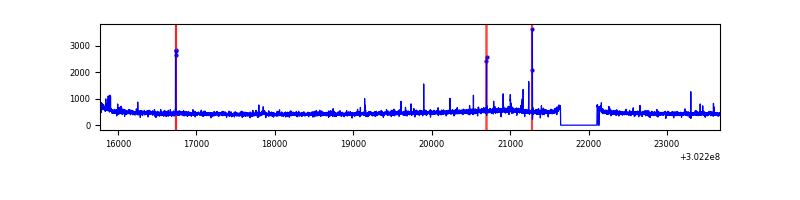 |
| C | 7904 | 7426 | 91 | 91 | 1.15% | 1.23% | 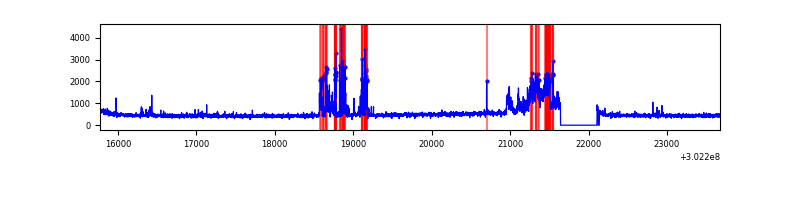 |
| D | 7904 | 7426 | 409 | 409 | 5.17% | 5.51% | 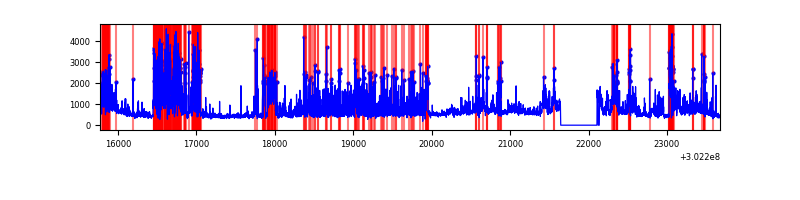 |
Top three noisy pixels from each quadrant. If the there are fewer than three noisy pixels in the level2.evt file, extra rows are filled as -1
| Pixel properties | Quadrant properties | ||||||
|---|---|---|---|---|---|---|---|
| Quadrant | DetID | PixID | Counts | Sigma | Mean | Median | Sigma |
| A | 5 | 16 | 20177 | 111.42 | 866 | 847 | 173.5 |
| A | 0 | 226 | 7488 | 38.28 | 866 | 847 | 173.5 |
| A | 3 | 137 | 7247 | 36.89 | 866 | 847 | 173.5 |
| B | 0 | 190 | 20590 | 120.27 | 864 | 844 | 164.2 |
| B | 12 | 111 | 19788 | 115.39 | 864 | 844 | 164.2 |
| B | 11 | 111 | 17061 | 98.78 | 864 | 844 | 164.2 |
| C | 9 | 54 | 816882 | 4249.18 | 827 | 832 | 192.0 |
| C | 14 | 238 | 129489 | 669.92 | 827 | 832 | 192.0 |
| C | 3 | 233 | 16127 | 79.64 | 827 | 832 | 192.0 |
| D | 5 | 222 | 2255459 | 11373.03 | 821 | 797 | 198.2 |
| D | 1 | 52 | 452867 | 2280.34 | 821 | 797 | 198.2 |
| D | 12 | 227 | 237362 | 1193.29 | 821 | 797 | 198.2 |
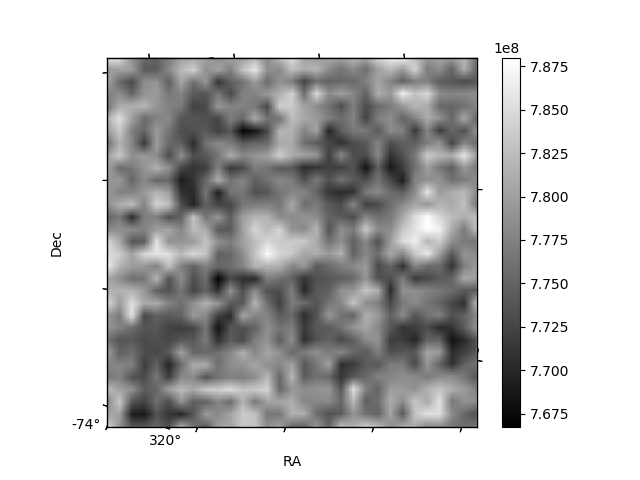
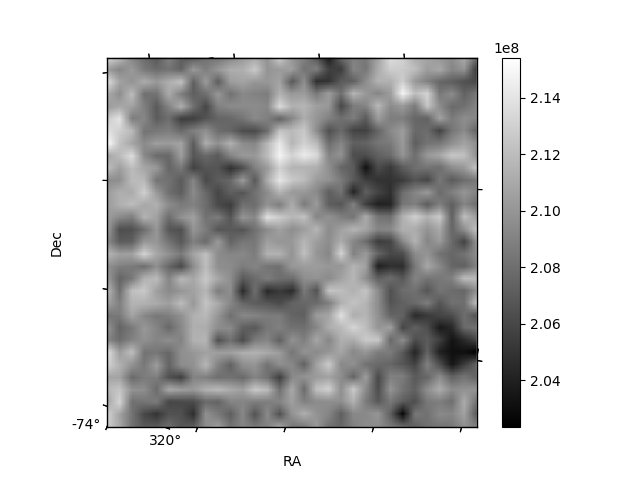
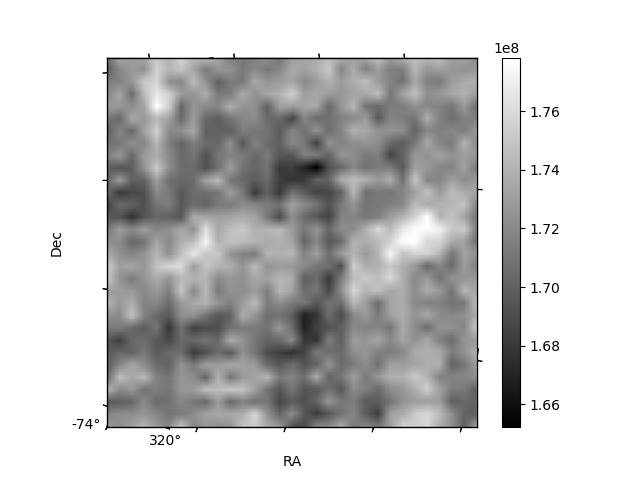
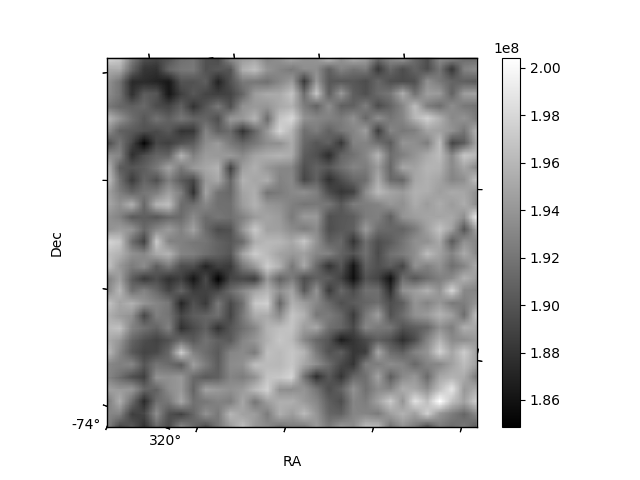
Histogram calculated using DETX and DETY for each event in the final _common_clean file
| Quadrant A | 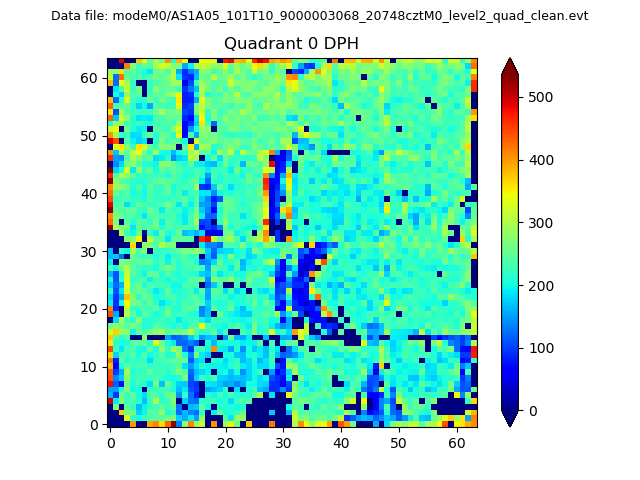 |
 |
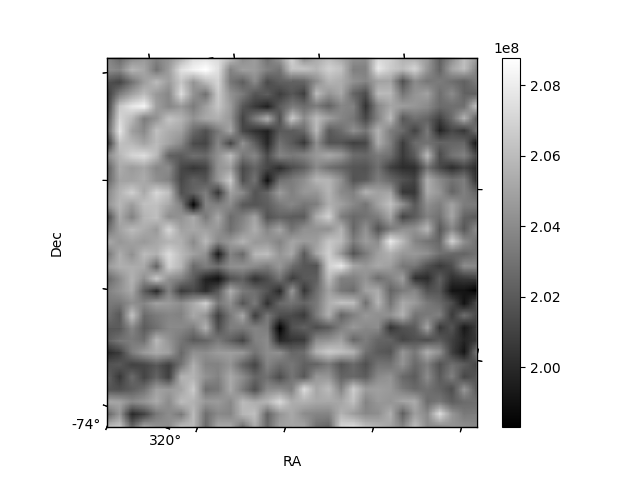
Quadrant B |
|---|---|---|---|
| Quadrant D | 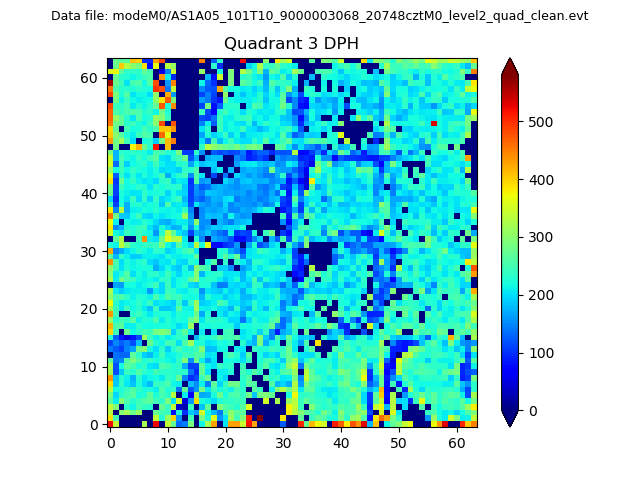 |
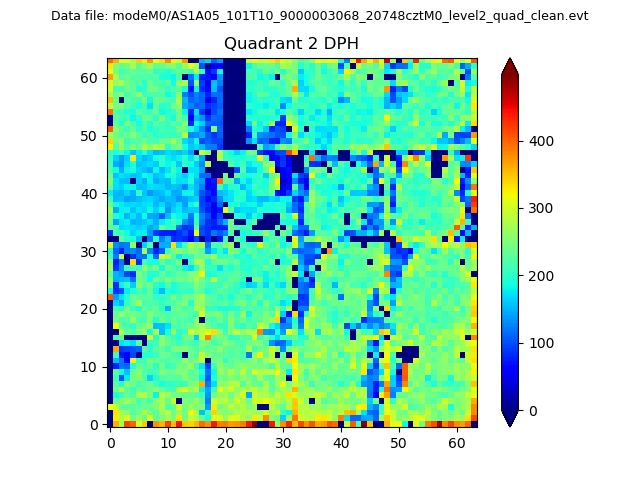 |
Quadrant C |
| Plot type | Count rate plots | Images |
|---|---|---|
| Comparison with Poisson distribution Blue bars denote a histogram of data divided into 1 sec bins. Red curve is a Poisson curve with rate = median count rate of data. |
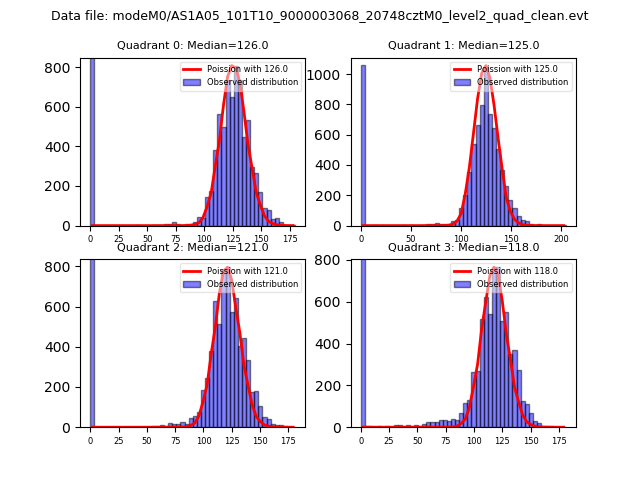 |
 |
| Quadrant-wise count rates Data is divided into 100 sec bins |
 |
|
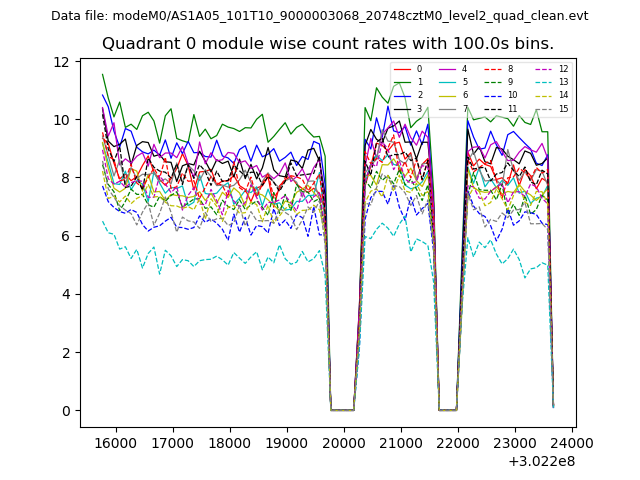
| Module-wise count rates for Quadrant A Data is divided into 100 sec bins |
 |
 |
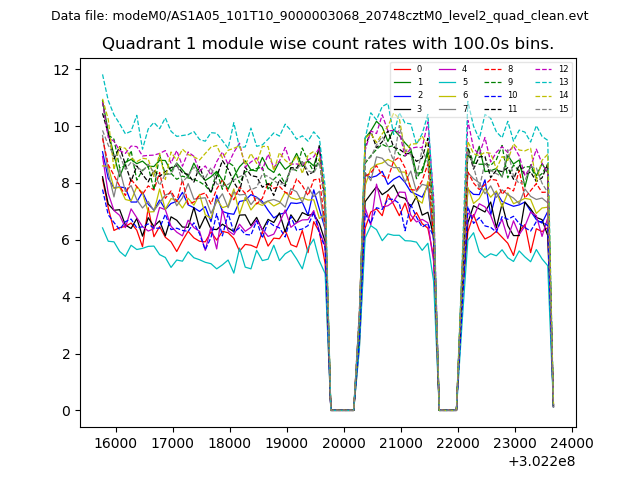
| Module-wise count rates for Quadrant B Data is divided into 100 sec bins |
 |
 |
| Module-wise count rates for Quadrant C Data is divided into 100 sec bins |
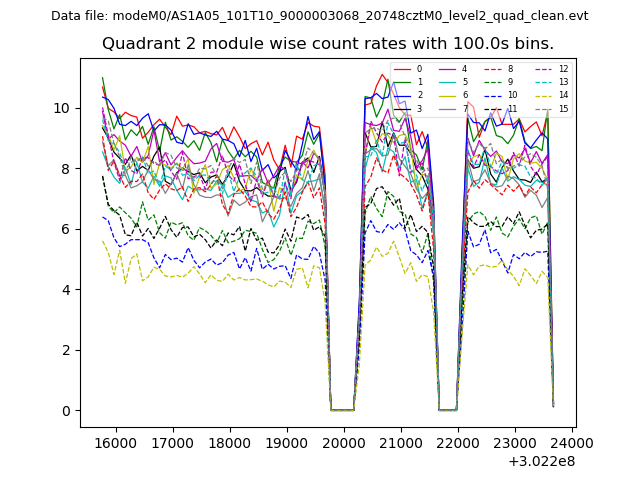 |
 |
| Module-wise count rates for Quadrant D Data is divided into 100 sec bins |
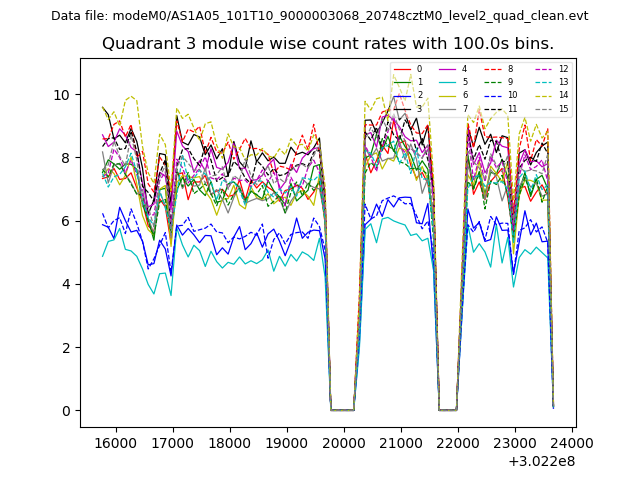 |
 |
| Parameter | Plot |
|---|---|
| CZT HV Monitor | 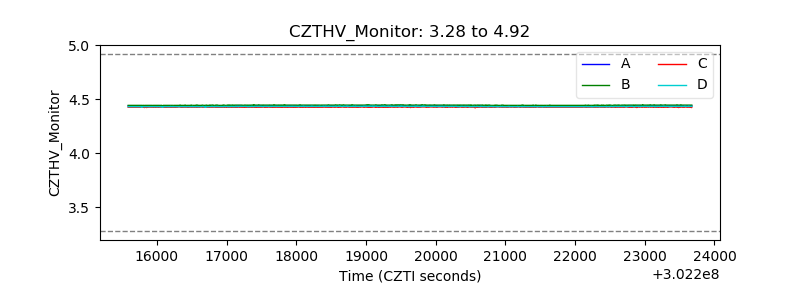 |
| D_VDD | 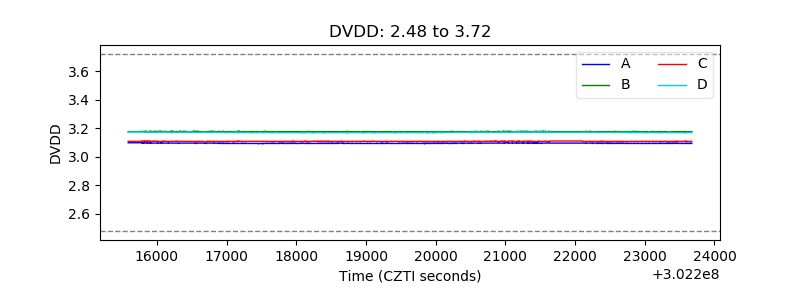 |
| Temperature 1 | 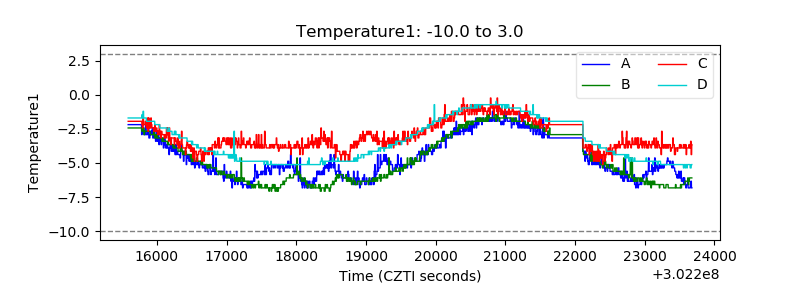 |
| Veto HV Monitor | 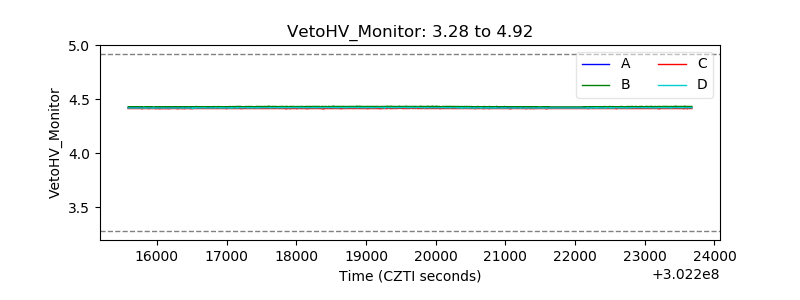 |
| Veto LLD | 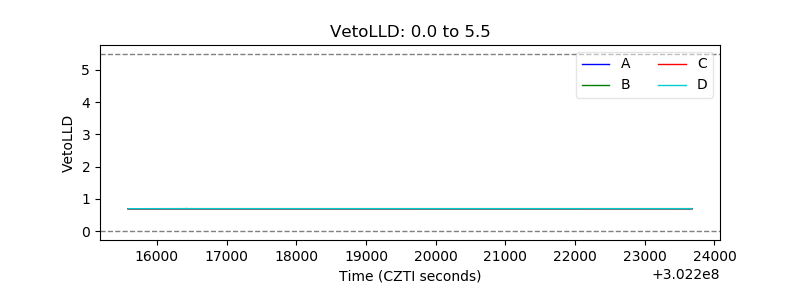 |
| Alpha Counter | 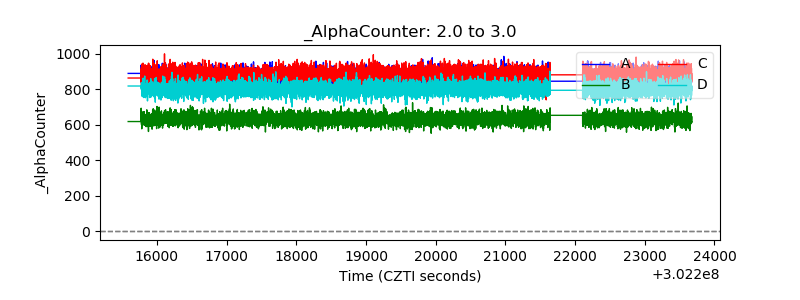 |
| _CPM_Rate | 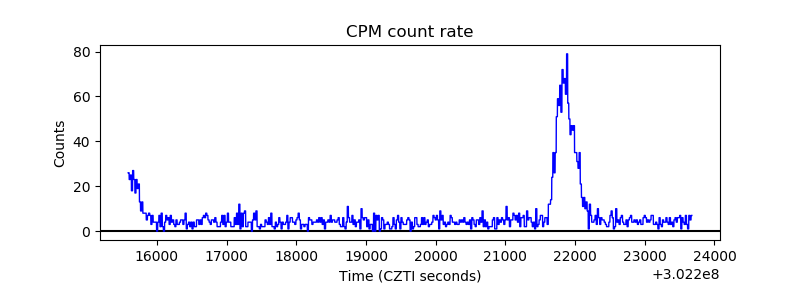 |
| CZT Counter | 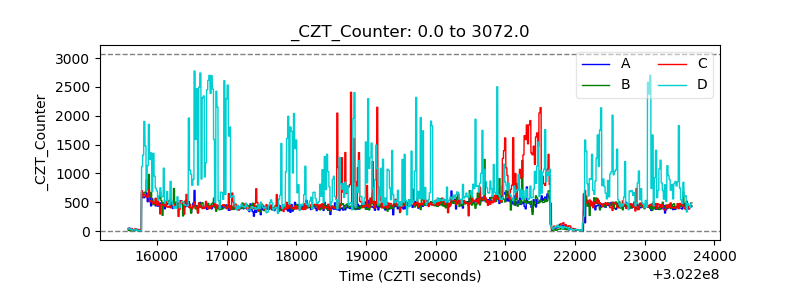 |
| +2.5 Volts monitor |  |
| +5 Volts monitor |  |
| _ROLL_ROT | 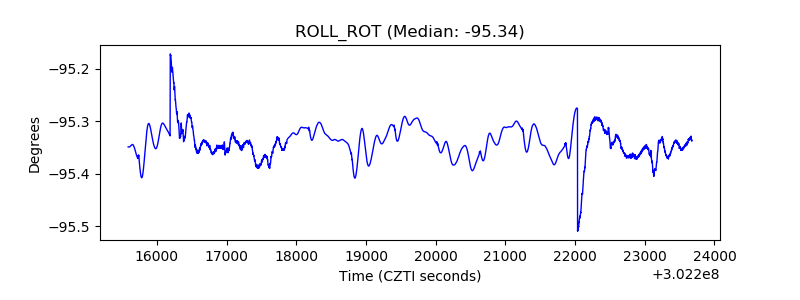 |
| _Roll_DEC | 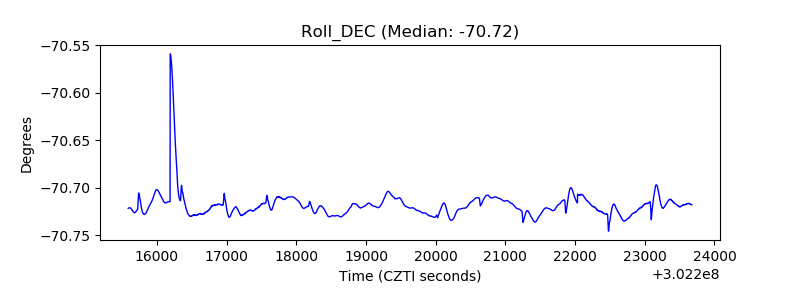 |
| _Roll_RA | 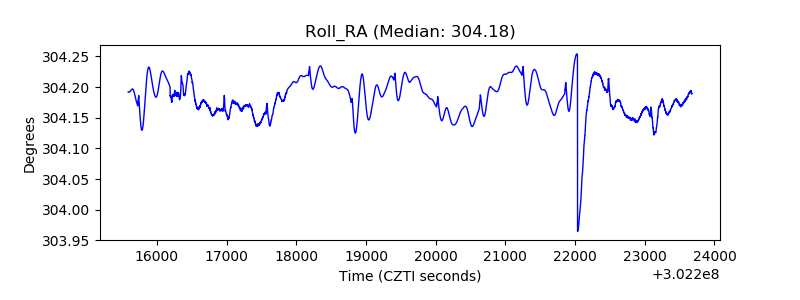 |
| Veto Counter | 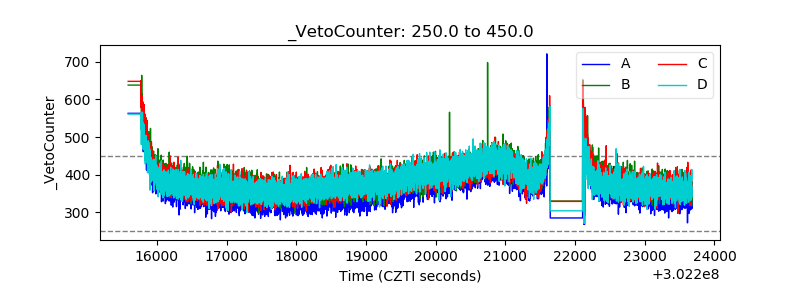 |