| Param | Original file | Final file |
|---|---|---|
| Filename | modeM0/AS1A05_101T10_9000003068_20750cztM0_level2.evt | modeM0/AS1A05_101T10_9000003068_20750cztM0_level2_quad_clean.evt |
| Size (bytes) | 578,041,920 | 143,403,840 |
| Size | 551.3 MB | 136.8 MB |
| Events in quadrant A | 3,842,610 | 963,600 |
| Events in quadrant B | 3,896,915 | 963,849 |
| Events in quadrant C | 4,272,212 | 930,117 |
| Events in quadrant D | 4,929,515 | 907,582 |
| Mode SS | |||
|---|---|---|---|
| Quadrant | BADHDUFLAG | Total packets | Discarded packets |
| A | 0 | 170 | 0 |
| B | 0 | 170 | 0 |
| C | 0 | 170 | 0 |
| D | 0 | 170 | 0 |
| Mode M9 | |||
|---|---|---|---|
| Quadrant | BADHDUFLAG | Total packets | Discarded packets |
| A | 0 | 11 | 0 |
| B | 0 | 11 | 0 |
| C | 0 | 11 | 0 |
| D | 0 | 11 | 0 |
| Mode M0 | |||
|---|---|---|---|
| Quadrant | BADHDUFLAG | Total packets | Discarded packets |
| A | 0 | 17236 | 2 |
| B | 0 | 17252 | 2 |
| C | 0 | 18379 | 2 |
| D | 0 | 20468 | 2 |
| Quadrant | Total seconds | Saturated seconds | Saturation percentage |
|---|---|---|---|
| A | 8324 | 44 | 0.528592% |
| B | 8324 | 64 | 0.768861% |
| C | 8324 | 130 | 1.561749% |
| D | 8325 | 186 | 2.234234% |
Noise dominated data is calculated using 1-second bins in cleaned event files. If a bin has >2000 counts, and if more than 50% of those come from <1% of pixels, then it is considered to be noise-dominated and hence unusable.
| Quadrant | # 1 sec bins | Bins with >0 counts | Bins with >2000 counts | High rate bins dominated by noise | Noise dominated (total time) | Noise dominated (detector-on time) | Marked lightcurve |
|---|---|---|---|---|---|---|---|
| A | 9434 | 8327 | 21 | 21 | 0.22% | 0.25% | 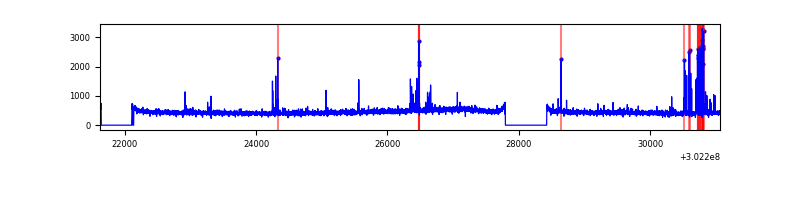 |
| B | 9434 | 8327 | 13 | 13 | 0.14% | 0.16% | 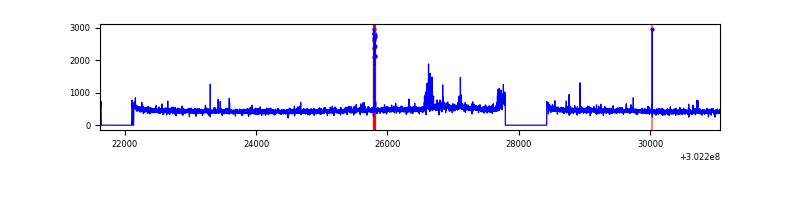 |
| C | 9434 | 8327 | 34 | 34 | 0.36% | 0.41% | 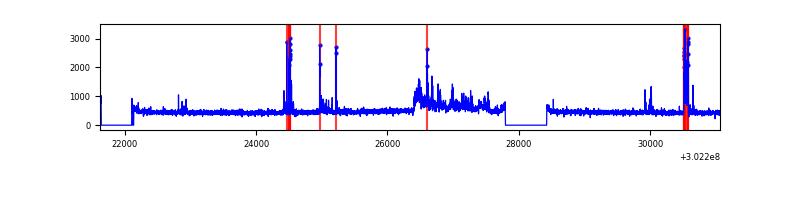 |
| D | 9435 | 8328 | 118 | 118 | 1.25% | 1.42% | 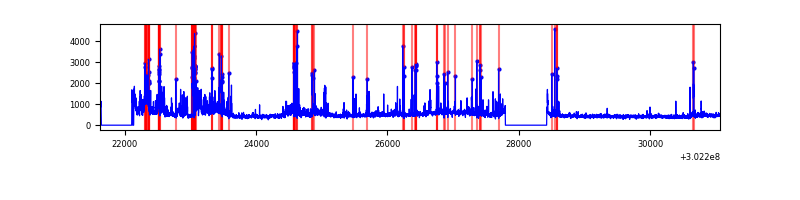 |
Top three noisy pixels from each quadrant. If the there are fewer than three noisy pixels in the level2.evt file, extra rows are filled as -1
| Pixel properties | Quadrant properties | ||||||
|---|---|---|---|---|---|---|---|
| Quadrant | DetID | PixID | Counts | Sigma | Mean | Median | Sigma |
| A | 5 | 16 | 169633 | 872.1 | 956 | 936 | 193.4 |
| A | 0 | 226 | 8178 | 37.44 | 956 | 936 | 193.4 |
| A | 3 | 137 | 7991 | 36.47 | 956 | 936 | 193.4 |
| B | 3 | 64 | 42579 | 231.02 | 953 | 927 | 180.3 |
| B | 0 | 197 | 40655 | 220.35 | 953 | 927 | 180.3 |
| B | 7 | 220 | 32705 | 176.25 | 953 | 927 | 180.3 |
| C | 9 | 54 | 473334 | 2193.68 | 922 | 926 | 215.3 |
| C | 14 | 238 | 144500 | 666.7 | 922 | 926 | 215.3 |
| C | 3 | 233 | 55783 | 254.73 | 922 | 926 | 215.3 |
| D | 1 | 52 | 627158 | 2809.21 | 922 | 896 | 222.9 |
| D | 5 | 222 | 445375 | 1993.79 | 922 | 896 | 222.9 |
| D | 1 | 20 | 220970 | 987.18 | 922 | 896 | 222.9 |
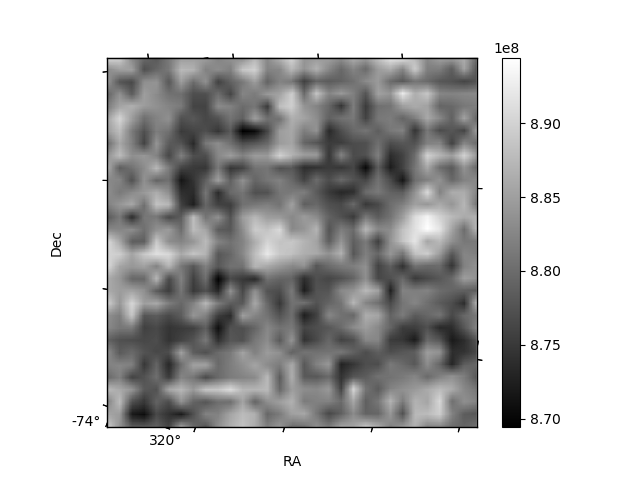
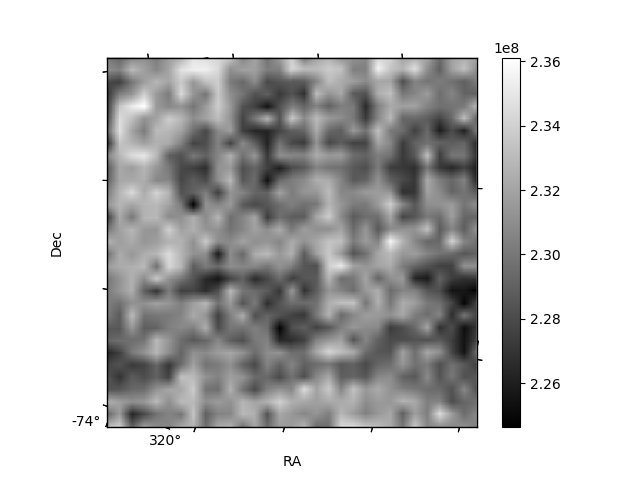
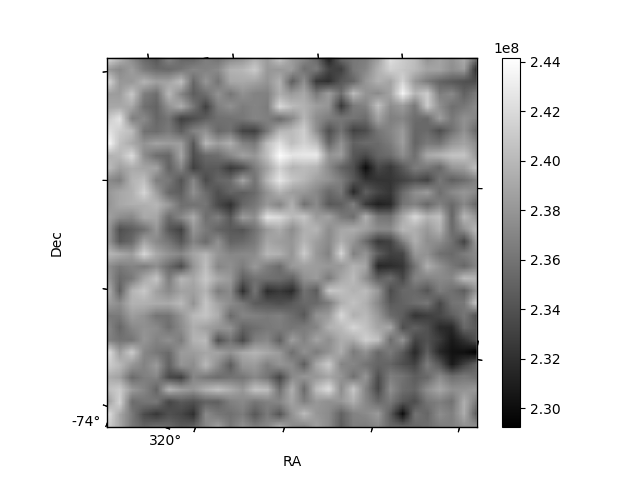
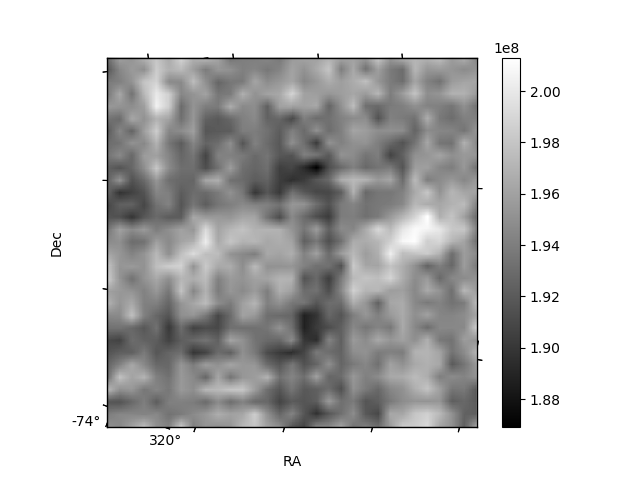
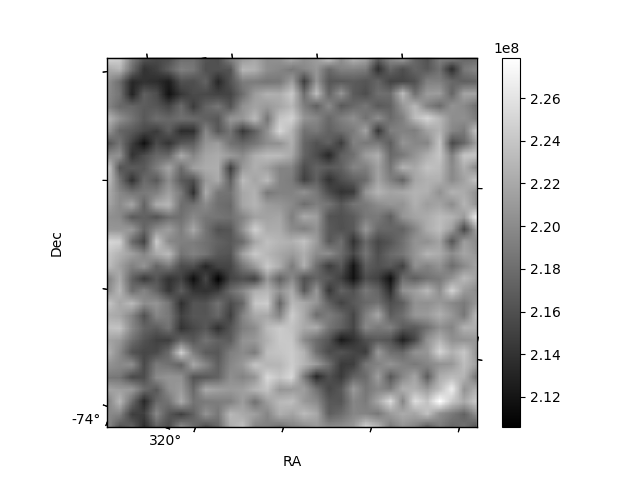
Histogram calculated using DETX and DETY for each event in the final _common_clean file
| Quadrant A | 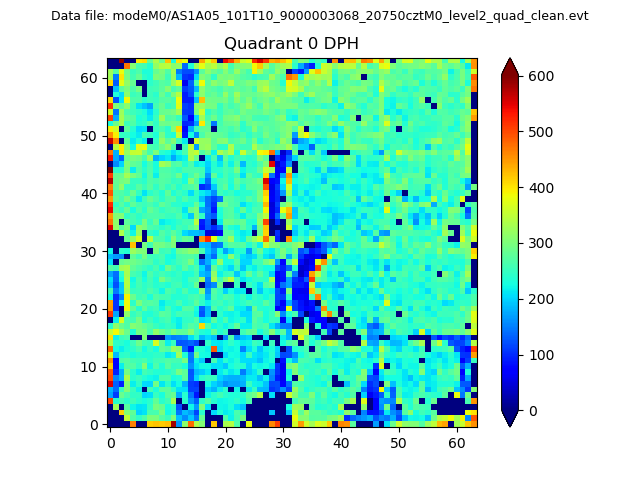 |
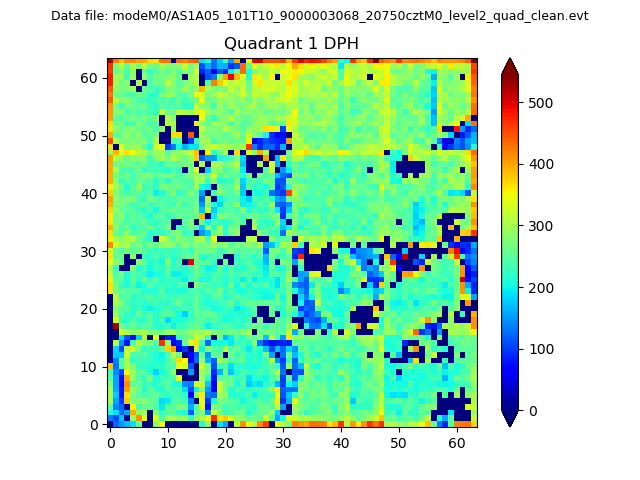 |
Quadrant B |
|---|---|---|---|
| Quadrant D | 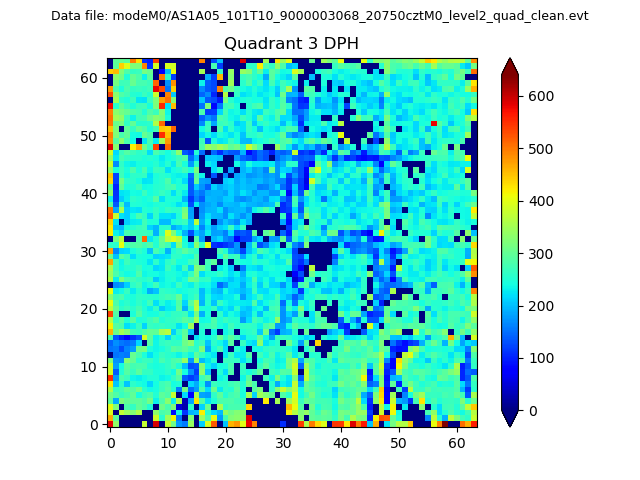 |
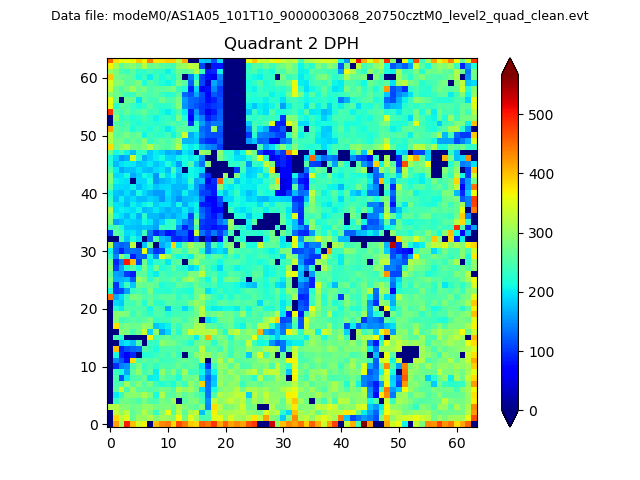 |
Quadrant C |
| Plot type | Count rate plots | Images |
|---|---|---|
| Comparison with Poisson distribution Blue bars denote a histogram of data divided into 1 sec bins. Red curve is a Poisson curve with rate = median count rate of data. |
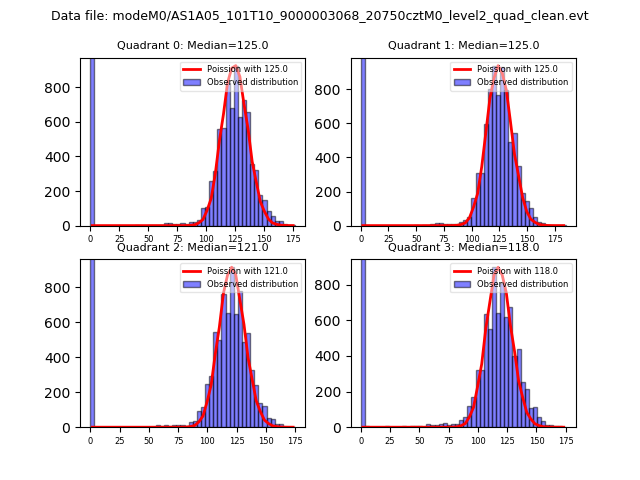 |
 |
| Quadrant-wise count rates Data is divided into 100 sec bins |
 |
|
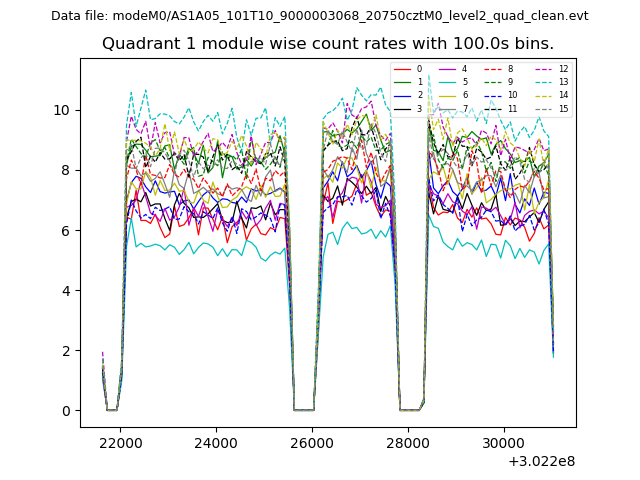
| Module-wise count rates for Quadrant A Data is divided into 100 sec bins |
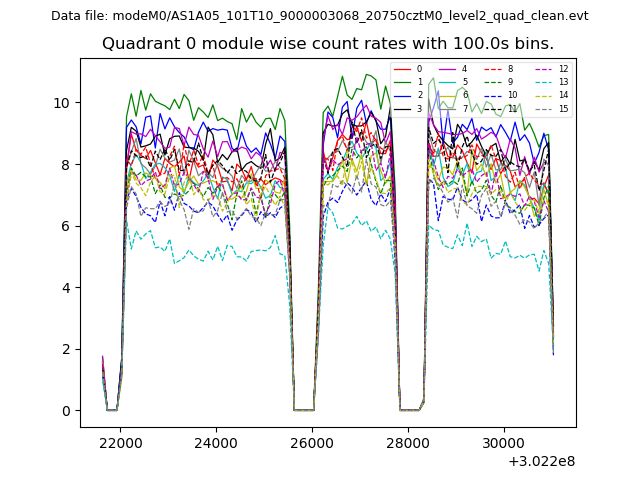 |
 |
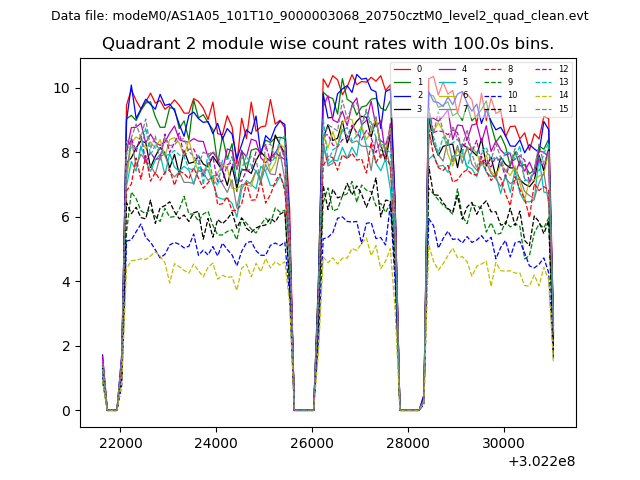
| Module-wise count rates for Quadrant B Data is divided into 100 sec bins |
 |
 |
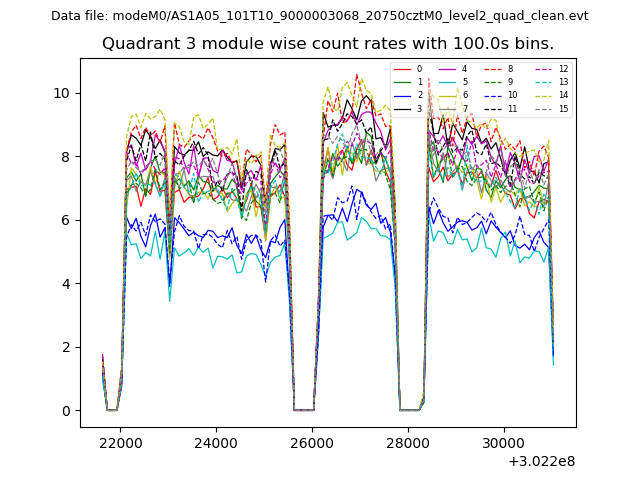
| Module-wise count rates for Quadrant C Data is divided into 100 sec bins |
 |
 |
| Module-wise count rates for Quadrant D Data is divided into 100 sec bins |
 |
 |
| Parameter | Plot |
|---|---|
| CZT HV Monitor | 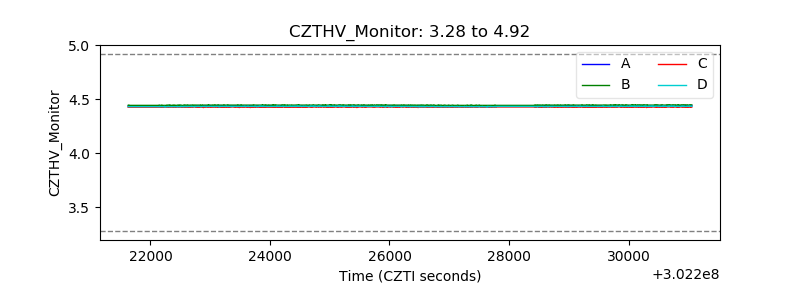 |
| D_VDD | 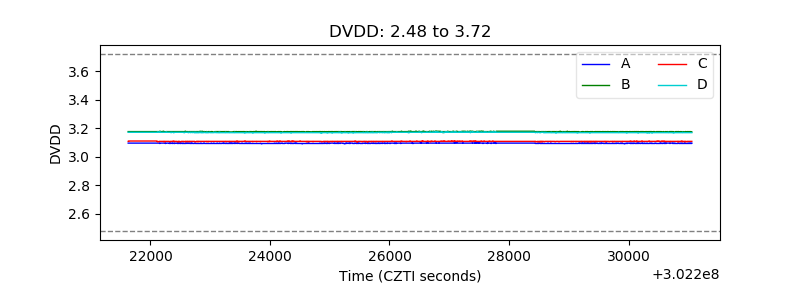 |
| Temperature 1 | 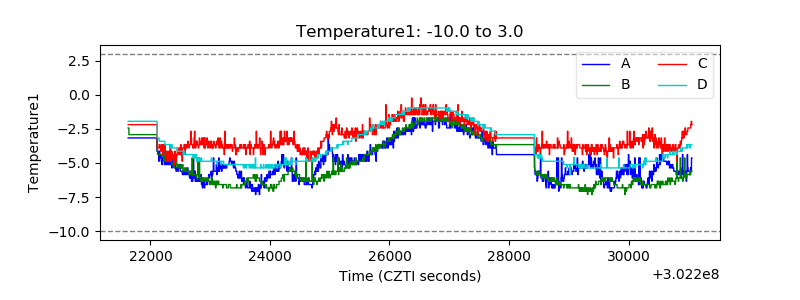 |
| Veto HV Monitor |  |
| Veto LLD | 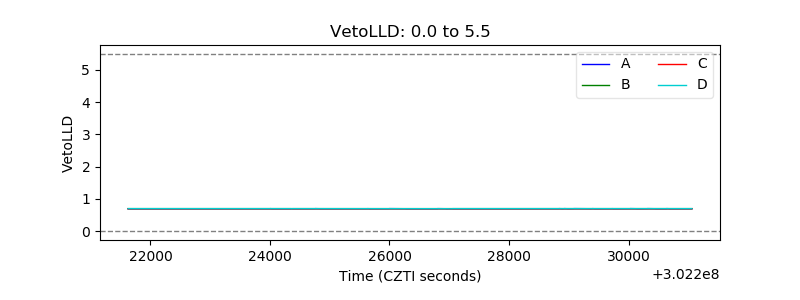 |
| Alpha Counter | 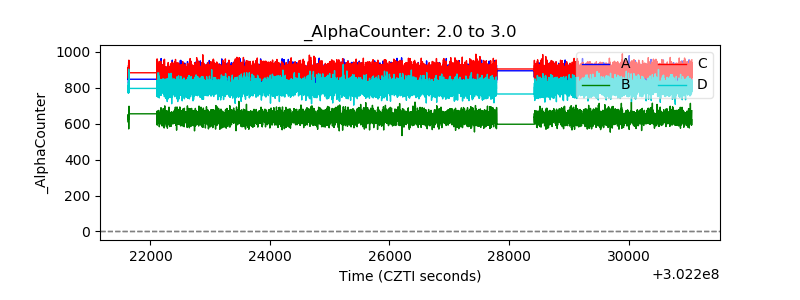 |
| _CPM_Rate | 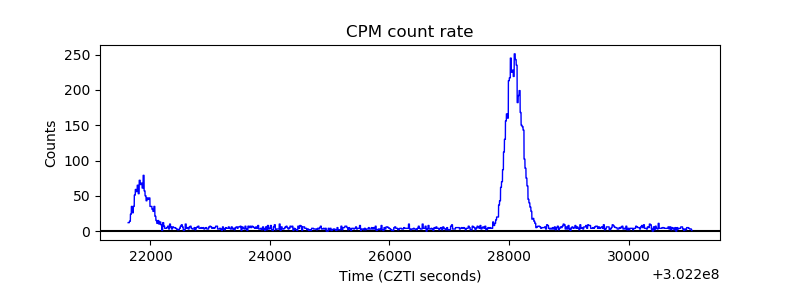 |
| CZT Counter | 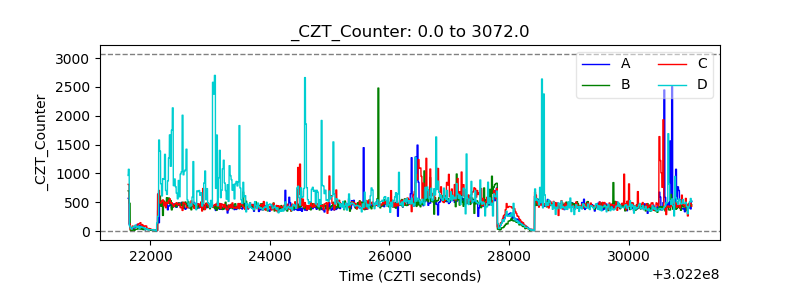 |
| +2.5 Volts monitor | 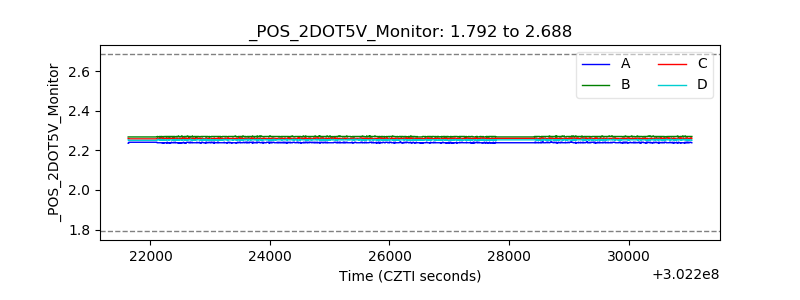 |
| +5 Volts monitor |  |
| _ROLL_ROT | 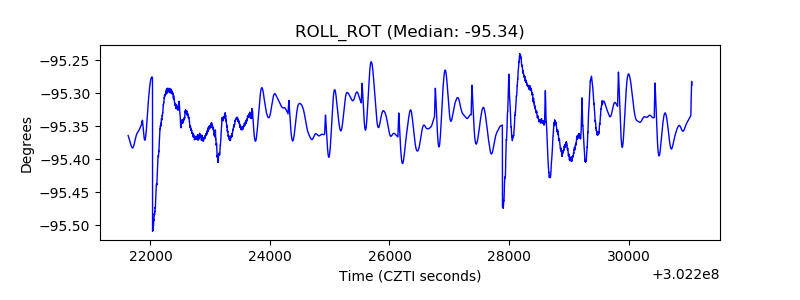 |
| _Roll_DEC | 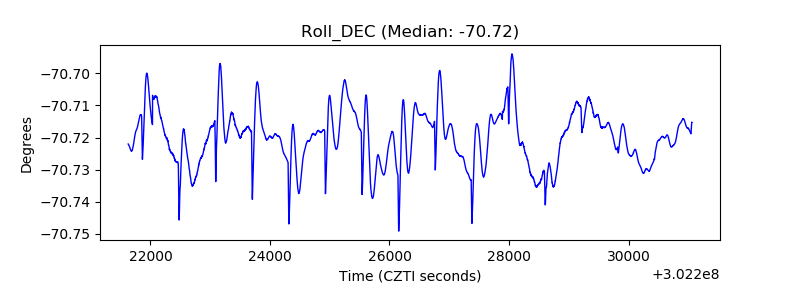 |
| _Roll_RA | 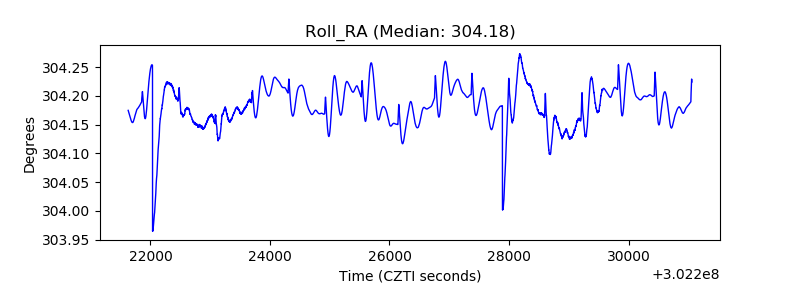 |
| Veto Counter | 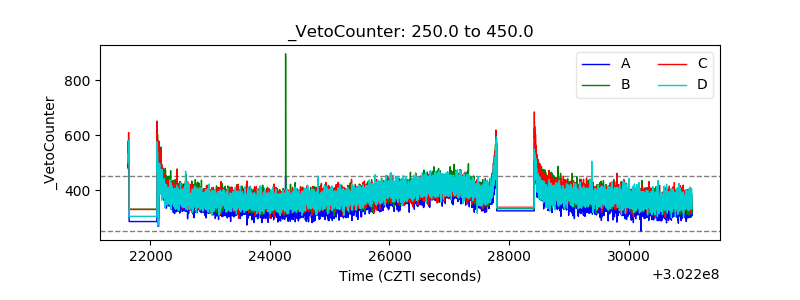 |