| Param | Original file | Final file |
|---|---|---|
| Filename | modeM0/AS1A05_013T01_9000003070cztM0_level2.fits | modeM0/AS1A05_013T01_9000003070cztM0_level2_quad_clean.evt |
| Size (bytes) | 4,038,762,240 | 3,621,499,200 |
| Size | 3.8 GB | 3.4 GB |
| Events in quadrant A | 25,603,636 | 22,291,304 |
| Events in quadrant B | 24,062,416 | 21,603,353 |
| Events in quadrant C | 24,744,616 | 21,036,568 |
| Events in quadrant D | 20,190,511 | 17,053,132 |
| Mode SS | |||
|---|---|---|---|
| Quadrant | BADHDUFLAG | Total packets | Discarded packets |
| A | 0 | 8251 | 0 |
| B | 0 | 8261 | 0 |
| C | 0 | 8262 | 0 |
| D | 0 | 8240 | 0 |
| Mode M0 | |||
|---|---|---|---|
| Quadrant | BADHDUFLAG | Total packets | Discarded packets |
| A | 0 | 850385 | 0 |
| B | 0 | 911435 | 0 |
| C | 0 | 854785 | 0 |
| D | 0 | 1380088 | 0 |
| Mode M9 | |||
|---|---|---|---|
| Quadrant | BADHDUFLAG | Total packets | Discarded packets |
| A | 0 | 677 | 0 |
| B | 0 | 677 | 0 |
| C | 0 | 679 | 0 |
| D | 0 | 675 | 0 |
| Quadrant | Total seconds | Saturated seconds | Saturation percentage |
|---|---|---|---|
| A | 404576 | 4068 | 1.005497% |
| B | 404412 | 7549 | 1.866661% |
| C | 404513 | 6177 | 1.527021% |
| D | 403701 | 50812 | 12.586543% |
Noise dominated data is calculated using 1-second bins in cleaned event files. If a bin has >2000 counts, and if more than 50% of those come from <1% of pixels, then it is considered to be noise-dominated and hence unusable.
| Quadrant | # 1 sec bins | Bins with >0 counts | Bins with >2000 counts | High rate bins dominated by noise | Noise dominated (total time) | Noise dominated (detector-on time) | Marked lightcurve |
|---|---|---|---|---|---|---|---|
| A | 499184 | 406486 | 0 | 0 | 0.00% | 0.00% |  |
| B | 499184 | 406281 | 0 | 0 | 0.00% | 0.00% |  |
| C | 499183 | 406439 | 0 | 0 | 0.00% | 0.00% |  |
| D | 499183 | 404550 | 0 | 0 | 0.00% | 0.00% |  |
Top three noisy pixels from each quadrant. If the there are fewer than three noisy pixels in the level2.evt file, extra rows are filled as -1
| Pixel properties | Quadrant properties | ||||||
|---|---|---|---|---|---|---|---|
| Quadrant | DetID | PixID | Counts | Sigma | Mean | Median | Sigma |
| A | 0 | 29 | 24600 | 11.34 | 6673 | 6293 | 1614.6 |
| A | 7 | 110 | 20114 | 8.56 | 6673 | 6293 | 1614.6 |
| A | 9 | 19 | 19381 | 8.11 | 6673 | 6293 | 1614.6 |
| B | 2 | 9 | 19380 | 10.89 | 6364 | 6098 | 1219.1 |
| B | 2 | 8 | 16306 | 8.37 | 6364 | 6098 | 1219.1 |
| B | 3 | 17 | 15675 | 7.86 | 6364 | 6098 | 1219.1 |
| C | 12 | 241 | 16699 | 6.44 | 6534 | 6142 | 1639.4 |
| C | 3 | 126 | 16665 | 6.42 | 6534 | 6142 | 1639.4 |
| C | 12 | 250 | 16495 | 6.31 | 6534 | 6142 | 1639.4 |
| D | 3 | 14 | 14364 | 5.99 | 5785 | 5296 | 1515.0 |
| D | 10 | 189 | 14301 | 5.94 | 5785 | 5296 | 1515.0 |
| D | 6 | 231 | 14137 | 5.84 | 5785 | 5296 | 1515.0 |
Histogram calculated using DETX and DETY for each event in the final _common_clean file
| Quadrant A |  |
 |
Quadrant B |
|---|---|---|---|
| Quadrant D | 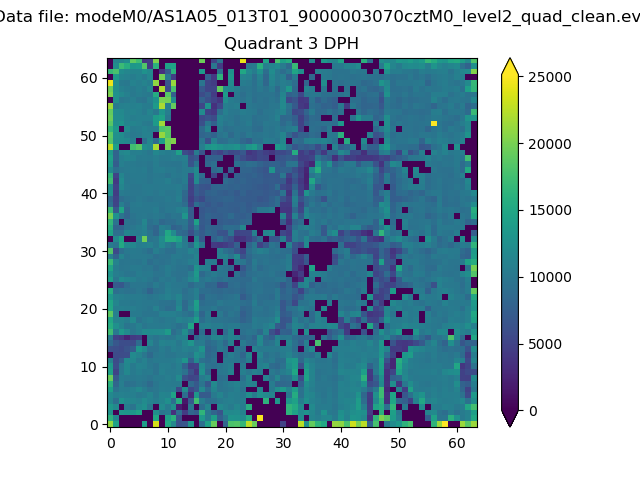 |
 |
Quadrant C |
| Plot type | Count rate plots | Images |
|---|---|---|
| Comparison with Poisson distribution Blue bars denote a histogram of data divided into 1 sec bins. Red curve is a Poisson curve with rate = median count rate of data. |
 |
 |
| Quadrant-wise count rates Data is divided into 100 sec bins |
 |
|
| Module-wise count rates for Quadrant A Data is divided into 100 sec bins |
 |
 |
| Module-wise count rates for Quadrant B Data is divided into 100 sec bins |
 |
 |
| Module-wise count rates for Quadrant C Data is divided into 100 sec bins |
 |
 |
| Module-wise count rates for Quadrant D Data is divided into 100 sec bins |
 |
 |
| Parameter | Plot |
|---|---|
| CZT HV Monitor |  |
| D_VDD |  |
| Temperature 1 |  |
| Veto HV Monitor |  |
| Veto LLD |  |
| Alpha Counter |  |
| _CPM_Rate |  |
| CZT Counter |  |
| +2.5 Volts monitor |  |
| +5 Volts monitor |  |
| _ROLL_ROT |  |
| _Roll_DEC |  |
| _Roll_RA |  |
| Veto Counter |  |