| Param | Original file | Final file |
|---|---|---|
| Filename | modeM0/AS1A05_013T01_9000003070_20750cztM0_level2.evt | modeM0/AS1A05_013T01_9000003070_20750cztM0_level2_quad_clean.evt |
| Size (bytes) | 253,843,200 | 44,651,520 |
| Size | 242.1 MB | 42.6 MB |
| Events in quadrant A | 1,788,592 | 281,611 |
| Events in quadrant B | 1,813,839 | 277,365 |
| Events in quadrant C | 1,816,370 | 268,880 |
| Events in quadrant D | 2,022,195 | 268,586 |
| Mode SS | |||
|---|---|---|---|
| Quadrant | BADHDUFLAG | Total packets | Discarded packets |
| A | 0 | 76 | 0 |
| B | 0 | 76 | 0 |
| C | 0 | 76 | 0 |
| D | 0 | 76 | 0 |
| Mode M0 | |||
|---|---|---|---|
| Quadrant | BADHDUFLAG | Total packets | Discarded packets |
| A | 0 | 7533 | 1 |
| B | 0 | 7577 | 1 |
| C | 0 | 7422 | 1 |
| D | 0 | 8269 | 1 |
| Mode M9 | |||
|---|---|---|---|
| Quadrant | BADHDUFLAG | Total packets | Discarded packets |
| A | 0 | 8 | 0 |
| B | 0 | 8 | 0 |
| C | 0 | 8 | 0 |
| D | 0 | 8 | 0 |
| Quadrant | Total seconds | Saturated seconds | Saturation percentage |
|---|---|---|---|
| A | 3599 | 17 | 0.472353% |
| B | 3599 | 28 | 0.777994% |
| C | 3599 | 39 | 1.083634% |
| D | 3599 | 68 | 1.889414% |
Noise dominated data is calculated using 1-second bins in cleaned event files. If a bin has >2000 counts, and if more than 50% of those come from <1% of pixels, then it is considered to be noise-dominated and hence unusable.
| Quadrant | # 1 sec bins | Bins with >0 counts | Bins with >2000 counts | High rate bins dominated by noise | Noise dominated (total time) | Noise dominated (detector-on time) | Marked lightcurve |
|---|---|---|---|---|---|---|---|
| A | 4419 | 3600 | 3 | 3 | 0.07% | 0.08% |  |
| B | 4419 | 3600 | 6 | 6 | 0.14% | 0.17% |  |
| C | 4419 | 3600 | 0 | 0 | 0.00% | 0.00% |  |
| D | 4419 | 3600 | 44 | 44 | 1.00% | 1.22% |  |
Top three noisy pixels from each quadrant. If the there are fewer than three noisy pixels in the level2.evt file, extra rows are filled as -1
| Pixel properties | Quadrant properties | ||||||
|---|---|---|---|---|---|---|---|
| Quadrant | DetID | PixID | Counts | Sigma | Mean | Median | Sigma |
| A | 5 | 16 | 75294 | 824.99 | 445 | 437 | 90.7 |
| A | 0 | 226 | 3837 | 37.47 | 445 | 437 | 90.7 |
| A | 3 | 137 | 3719 | 36.17 | 445 | 437 | 90.7 |
| B | 7 | 220 | 46985 | 548.05 | 439 | 428 | 85.0 |
| B | 0 | 197 | 21087 | 243.19 | 439 | 428 | 85.0 |
| B | 12 | 111 | 10066 | 113.45 | 439 | 428 | 85.0 |
| C | 3 | 233 | 85492 | 853.18 | 421 | 423 | 99.7 |
| C | 14 | 238 | 65274 | 650.41 | 421 | 423 | 99.7 |
| C | 7 | 247 | 17451 | 170.78 | 421 | 423 | 99.7 |
| D | 1 | 52 | 177227 | 1676.37 | 428 | 416 | 105.5 |
| D | 5 | 222 | 121306 | 1146.18 | 428 | 416 | 105.5 |
| D | 13 | 138 | 47525 | 446.65 | 428 | 416 | 105.5 |
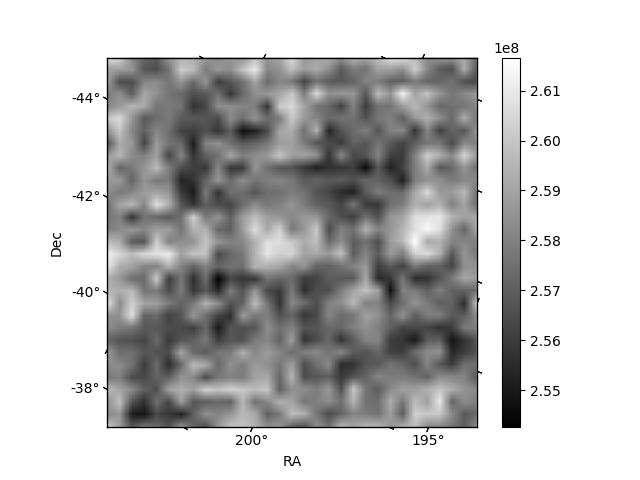
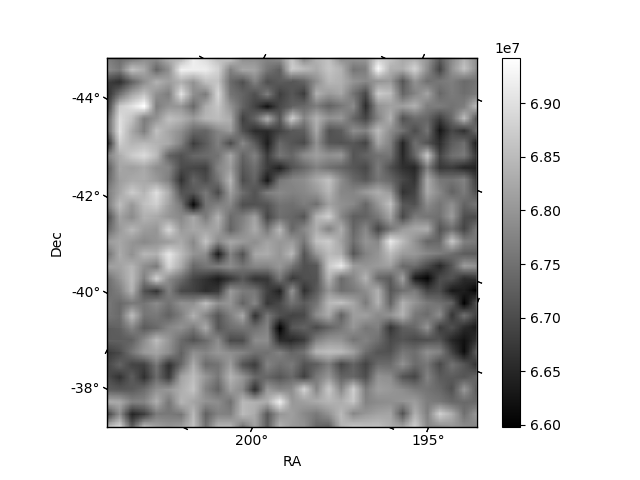
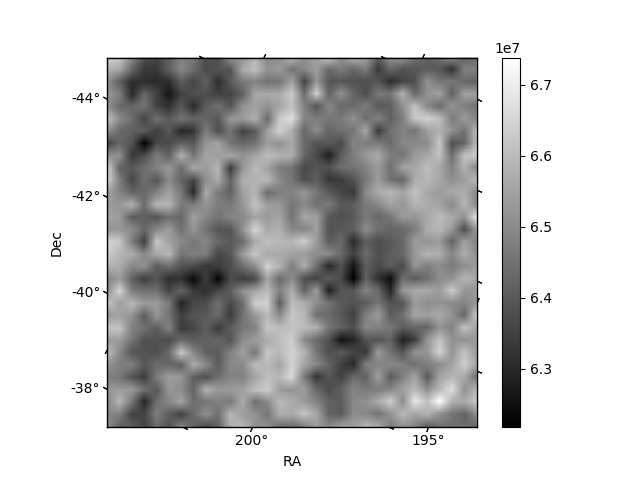
Histogram calculated using DETX and DETY for each event in the final _common_clean file
| Quadrant A | 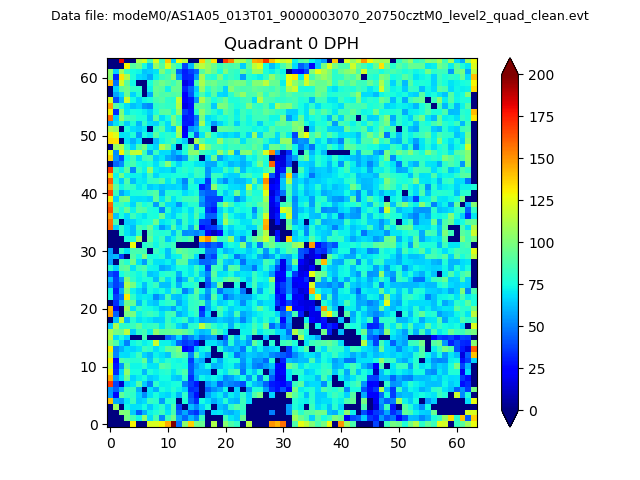 |
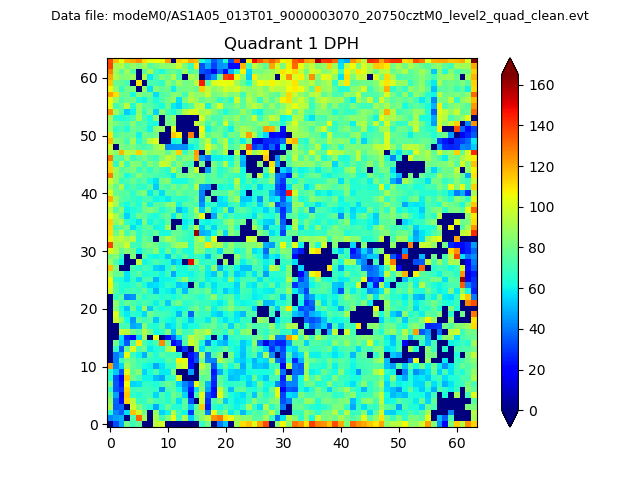 |
Quadrant B |
|---|---|---|---|
| Quadrant D | 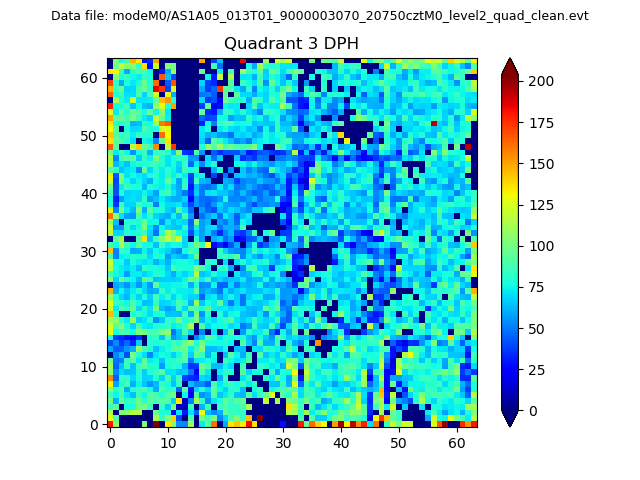 |
 |
Quadrant C |
| Plot type | Count rate plots | Images |
|---|---|---|
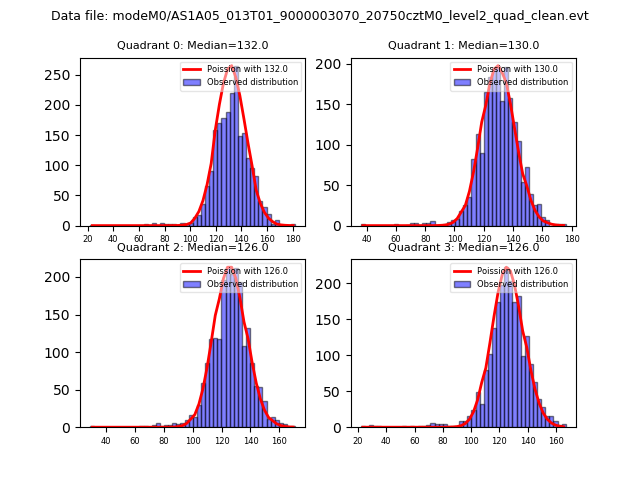
| Comparison with Poisson distribution Blue bars denote a histogram of data divided into 1 sec bins. Red curve is a Poisson curve with rate = median count rate of data. |
 |
 |
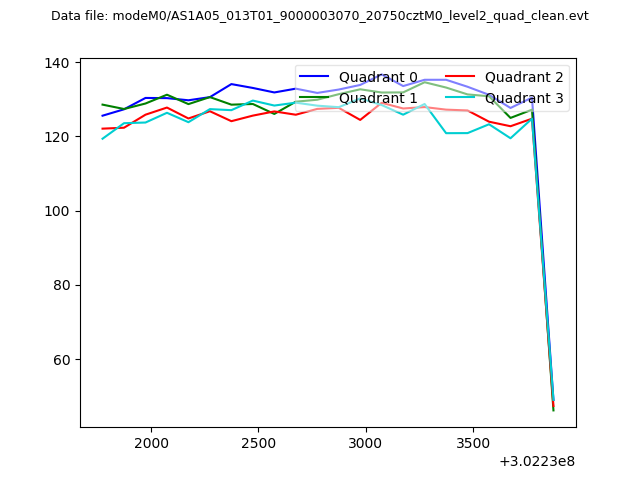
| Quadrant-wise count rates Data is divided into 100 sec bins |
 |
|
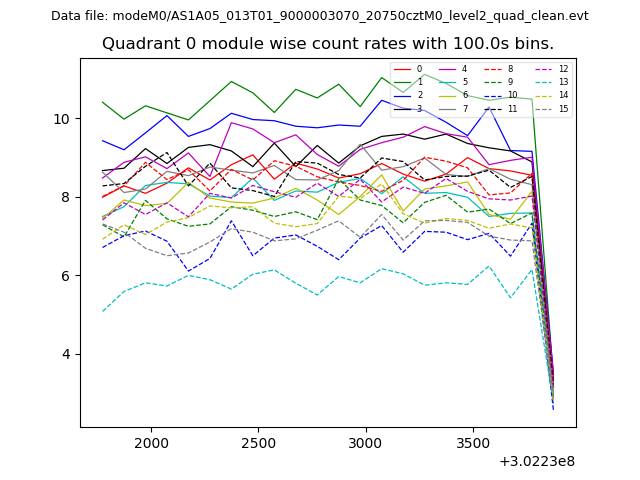
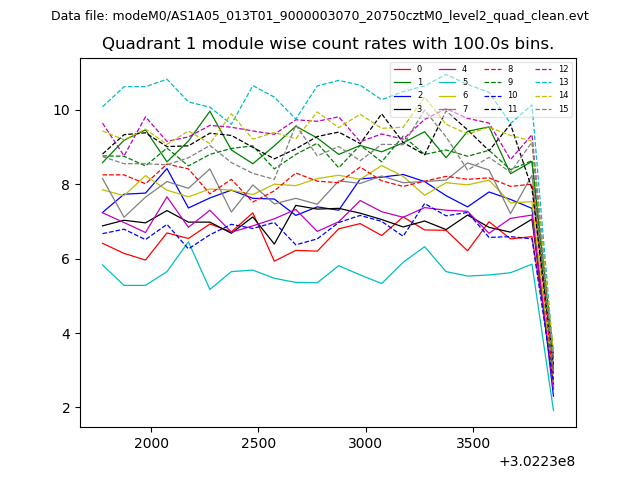
| Module-wise count rates for Quadrant A Data is divided into 100 sec bins |
 |
 |
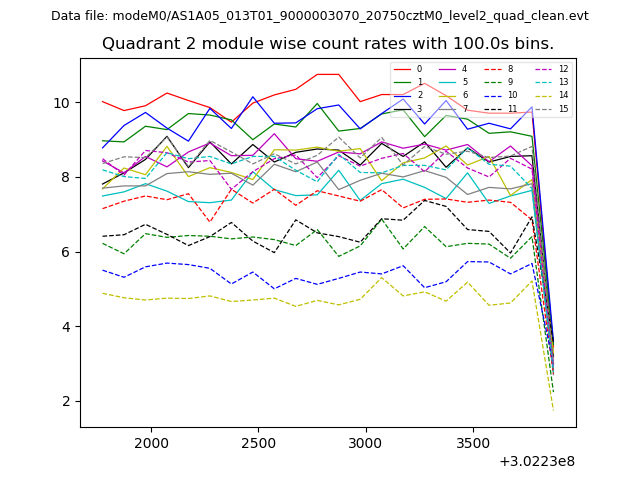
| Module-wise count rates for Quadrant B Data is divided into 100 sec bins |
 |
 |
| Module-wise count rates for Quadrant C Data is divided into 100 sec bins |
 |
 |
| Module-wise count rates for Quadrant D Data is divided into 100 sec bins |
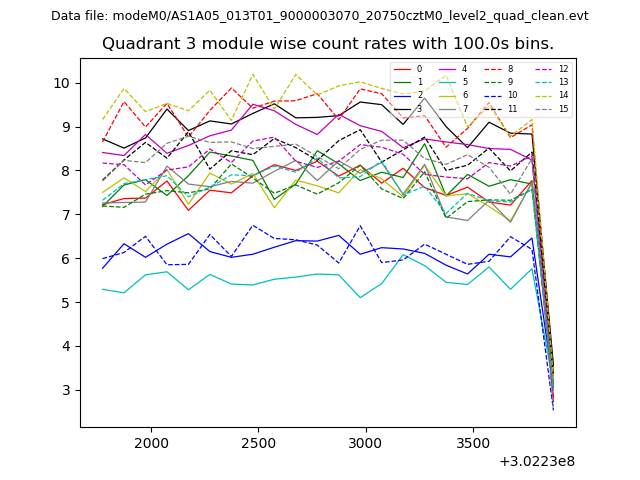 |
 |
| Parameter | Plot |
|---|---|
| CZT HV Monitor | 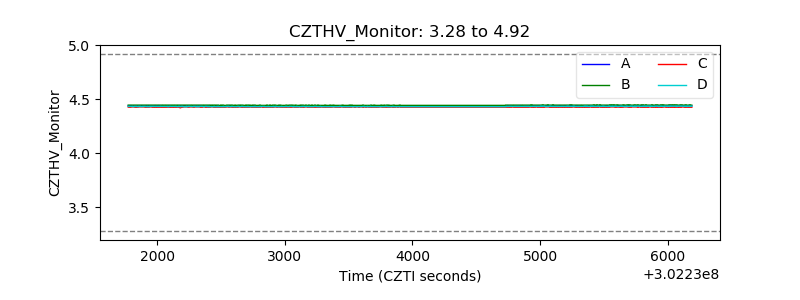 |
| D_VDD | 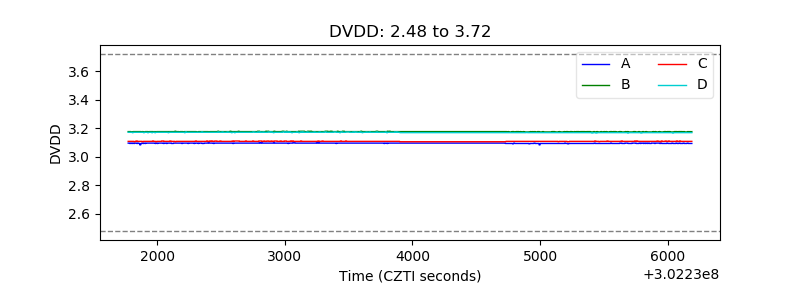 |
| Temperature 1 | 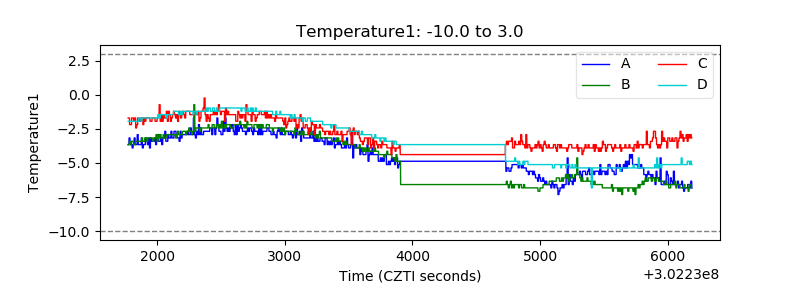 |
| Veto HV Monitor | 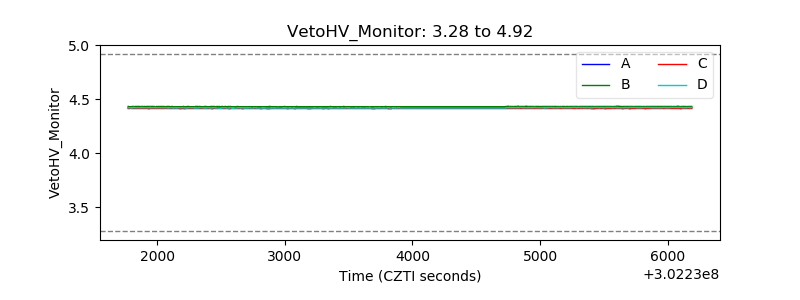 |
| Veto LLD | 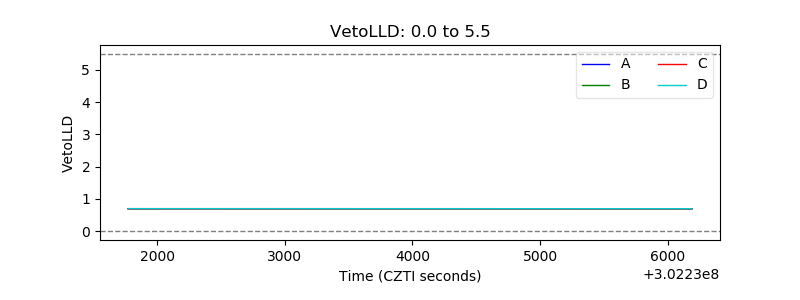 |
| Alpha Counter | 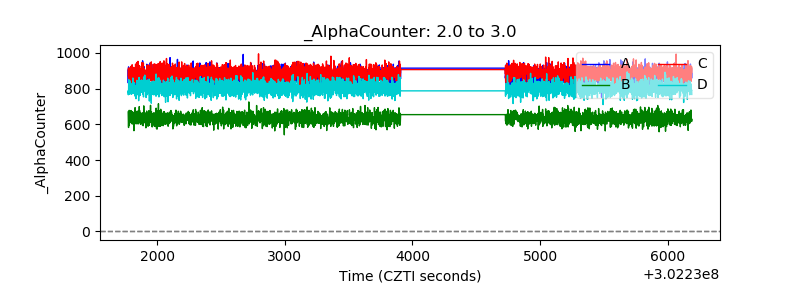 |
| _CPM_Rate | 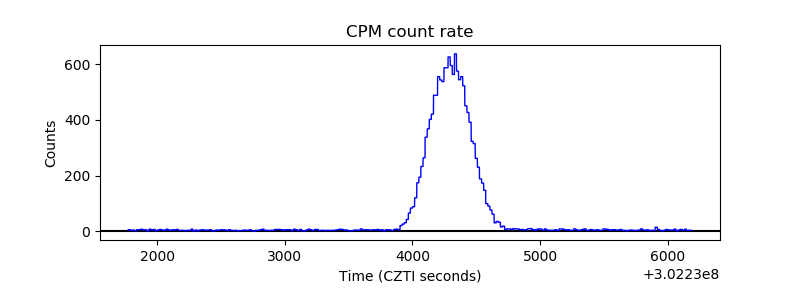 |
| CZT Counter | 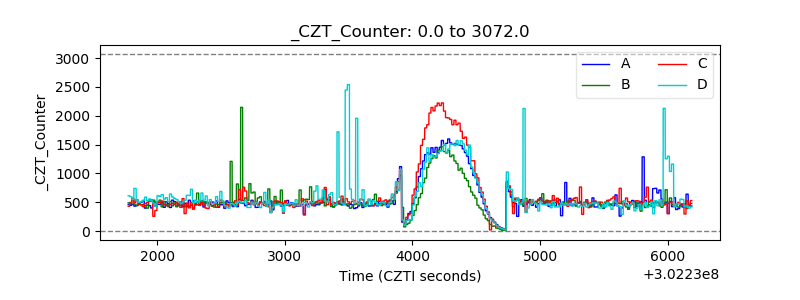 |
| +2.5 Volts monitor |  |
| +5 Volts monitor |  |
| _ROLL_ROT | 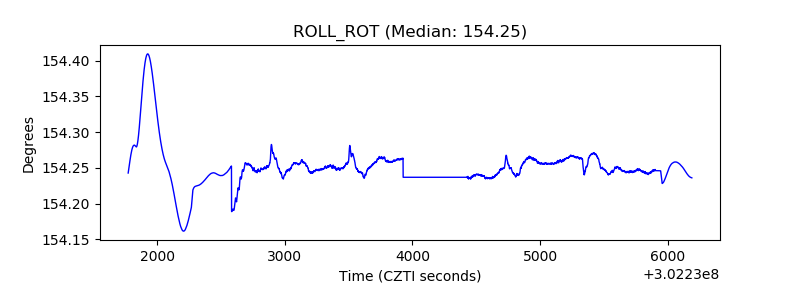 |
| _Roll_DEC |  |
| _Roll_RA | 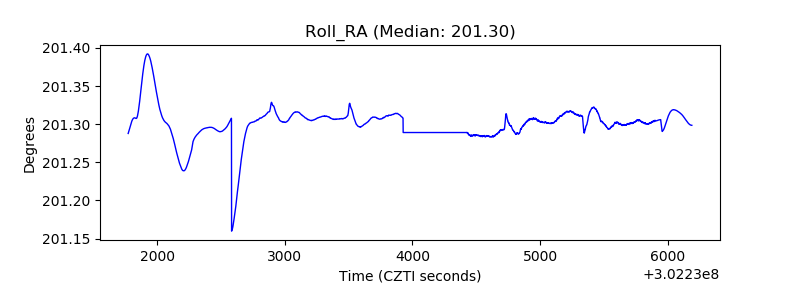 |
| Veto Counter | 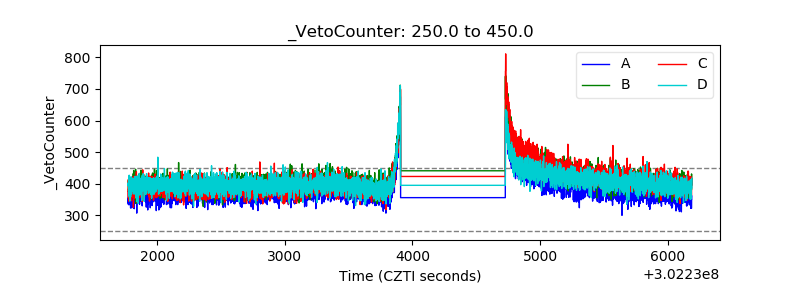 |