| Param | Original file | Final file |
|---|---|---|
| Filename | modeM0/AS1A05_013T01_9000003070_20751cztM0_level2.evt | modeM0/AS1A05_013T01_9000003070_20751cztM0_level2_quad_clean.evt |
| Size (bytes) | 259,522,560 | 37,929,600 |
| Size | 247.5 MB | 36.2 MB |
| Events in quadrant A | 1,622,796 | 237,619 |
| Events in quadrant B | 1,662,429 | 238,396 |
| Events in quadrant C | 1,668,221 | 229,459 |
| Events in quadrant D | 2,683,083 | 210,829 |
| Mode SS | |||
|---|---|---|---|
| Quadrant | BADHDUFLAG | Total packets | Discarded packets |
| A | 0 | 73 | 7 |
| B | 0 | 77 | 11 |
| C | 0 | 78 | 10 |
| D | 0 | 73 | 5 |
| Mode M0 | |||
|---|---|---|---|
| Quadrant | BADHDUFLAG | Total packets | Discarded packets |
| A | 0 | 7593 | 749 |
| B | 0 | 7684 | 750 |
| C | 0 | 7632 | 793 |
| D | 0 | 11831 | 1670 |
| Mode M9 | |||
|---|---|---|---|
| Quadrant | BADHDUFLAG | Total packets | Discarded packets |
| A | 0 | 11 | 1 |
| B | 0 | 10 | 0 |
| C | 0 | 11 | 1 |
| D | 0 | 10 | 0 |
| Quadrant | Total seconds | Saturated seconds | Saturation percentage |
|---|---|---|---|
| A | 3278 | 24 | 0.732154% |
| B | 3275 | 42 | 1.282443% |
| C | 3266 | 41 | 1.255358% |
| D | 3236 | 244 | 7.540173% |
Noise dominated data is calculated using 1-second bins in cleaned event files. If a bin has >2000 counts, and if more than 50% of those come from <1% of pixels, then it is considered to be noise-dominated and hence unusable.
| Quadrant | # 1 sec bins | Bins with >0 counts | Bins with >2000 counts | High rate bins dominated by noise | Noise dominated (total time) | Noise dominated (detector-on time) | Marked lightcurve |
|---|---|---|---|---|---|---|---|
| A | 5705 | 3325 | 2 | 2 | 0.04% | 0.06% | 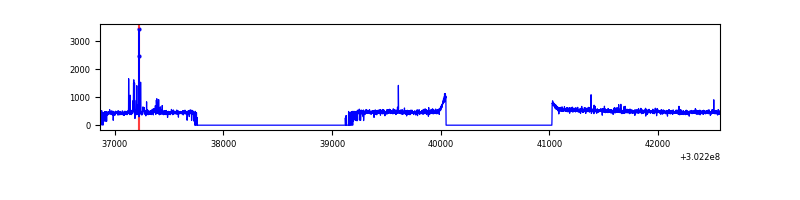 |
| B | 5699 | 3314 | 6 | 6 | 0.11% | 0.18% | 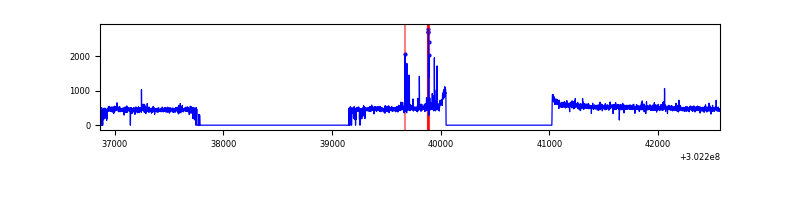 |
| C | 5703 | 3305 | 0 | 0 | 0.00% | 0.00% | 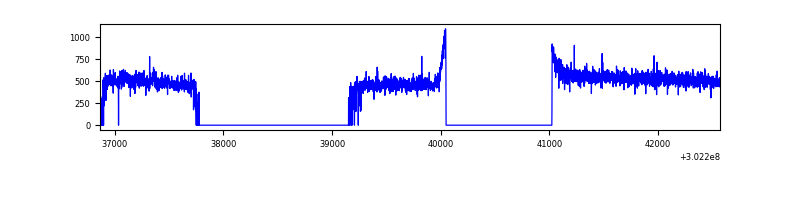 |
| D | 5697 | 3286 | 193 | 193 | 3.39% | 5.87% | 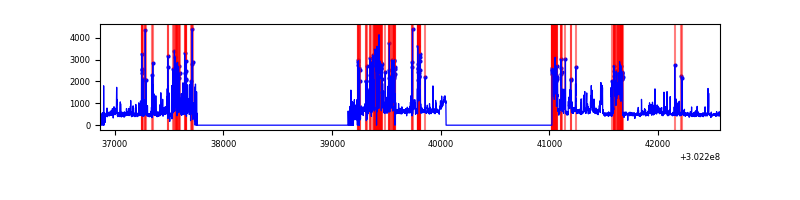 |
Top three noisy pixels from each quadrant. If the there are fewer than three noisy pixels in the level2.evt file, extra rows are filled as -1
| Pixel properties | Quadrant properties | ||||||
|---|---|---|---|---|---|---|---|
| Quadrant | DetID | PixID | Counts | Sigma | Mean | Median | Sigma |
| A | 5 | 16 | 41454 | 489.44 | 411 | 402 | 83.9 |
| A | 0 | 226 | 3513 | 37.08 | 411 | 402 | 83.9 |
| A | 3 | 137 | 3413 | 35.89 | 411 | 402 | 83.9 |
| B | 7 | 220 | 36449 | 450.81 | 409 | 398 | 80.0 |
| B | 0 | 183 | 13819 | 167.83 | 409 | 398 | 80.0 |
| B | 12 | 111 | 9456 | 113.27 | 409 | 398 | 80.0 |
| C | 14 | 238 | 61471 | 656.6 | 395 | 396 | 93.0 |
| C | 3 | 233 | 52290 | 557.9 | 395 | 396 | 93.0 |
| C | 7 | 247 | 6014 | 60.4 | 395 | 396 | 93.0 |
| D | 1 | 52 | 970995 | 10243.91 | 384 | 374 | 94.8 |
| D | 1 | 20 | 173639 | 1828.63 | 384 | 374 | 94.8 |
| D | 5 | 222 | 41684 | 435.98 | 384 | 374 | 94.8 |
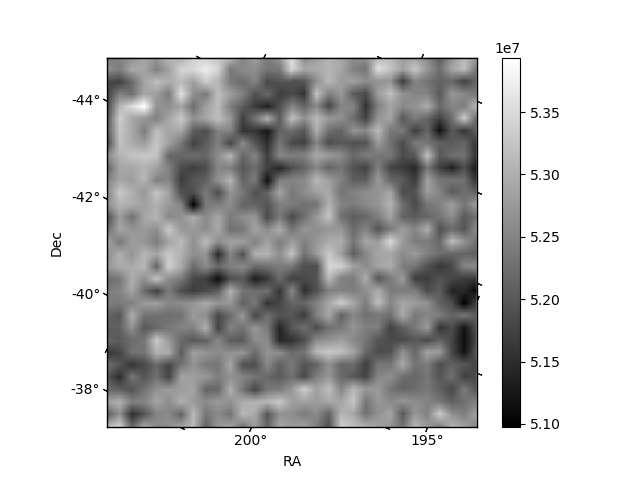
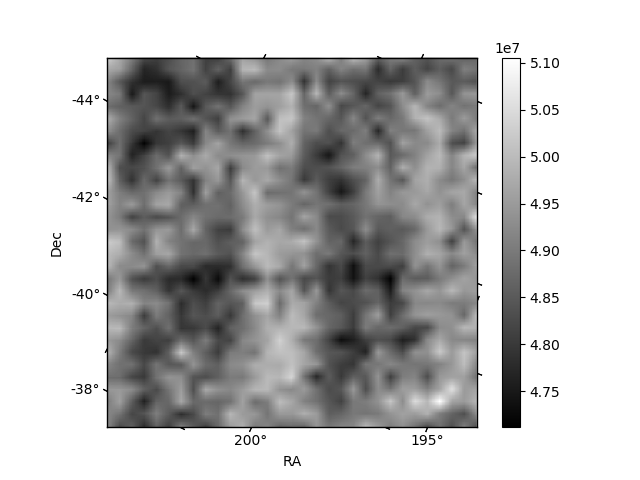
Histogram calculated using DETX and DETY for each event in the final _common_clean file
| Quadrant A |  |
 |
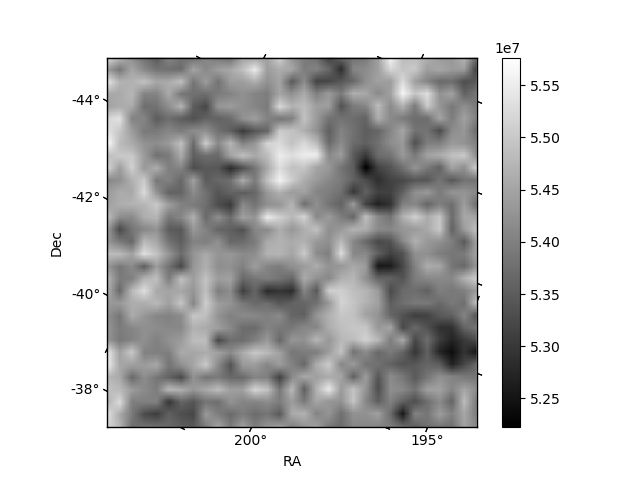
Quadrant B |
|---|---|---|---|
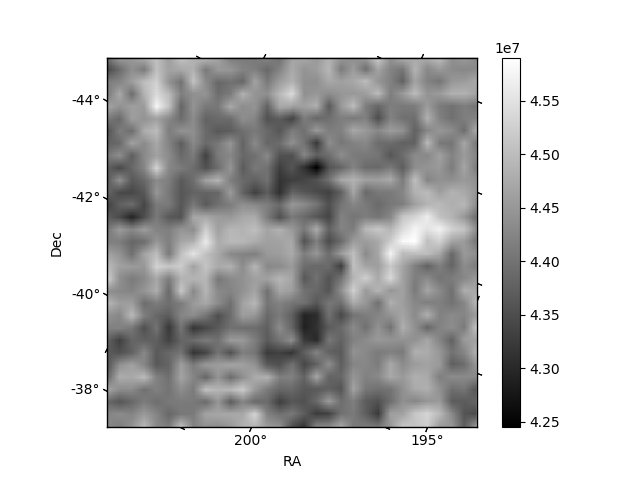
| Quadrant D |  |
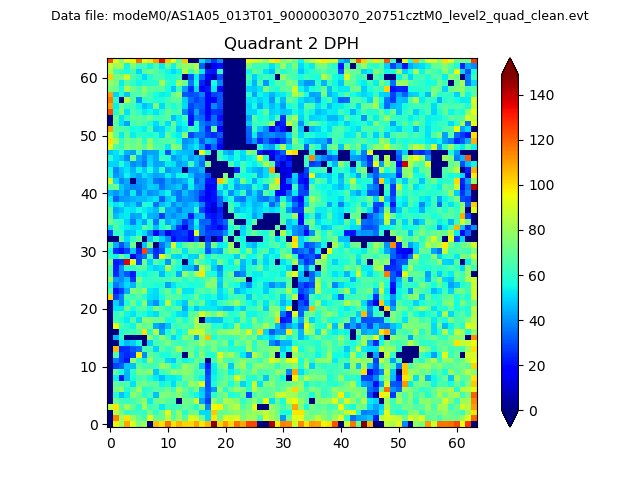 |
Quadrant C |
| Plot type | Count rate plots | Images |
|---|---|---|
| Comparison with Poisson distribution Blue bars denote a histogram of data divided into 1 sec bins. Red curve is a Poisson curve with rate = median count rate of data. |
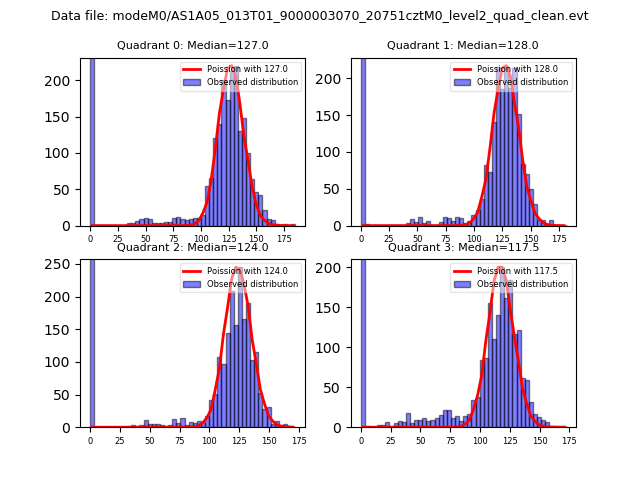 |
 |
| Quadrant-wise count rates Data is divided into 100 sec bins |
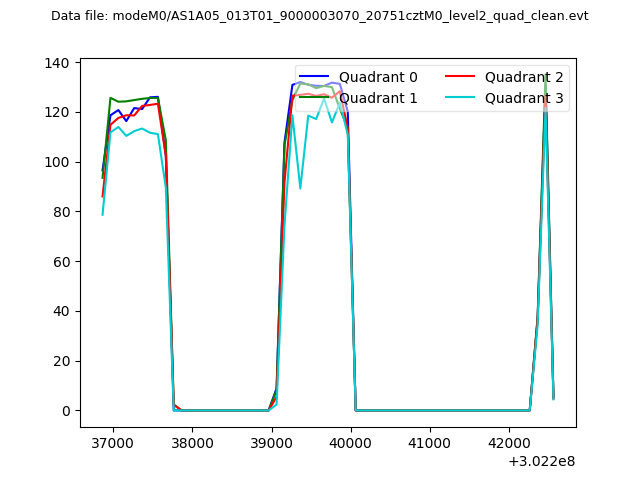 |
|
| Module-wise count rates for Quadrant A Data is divided into 100 sec bins |
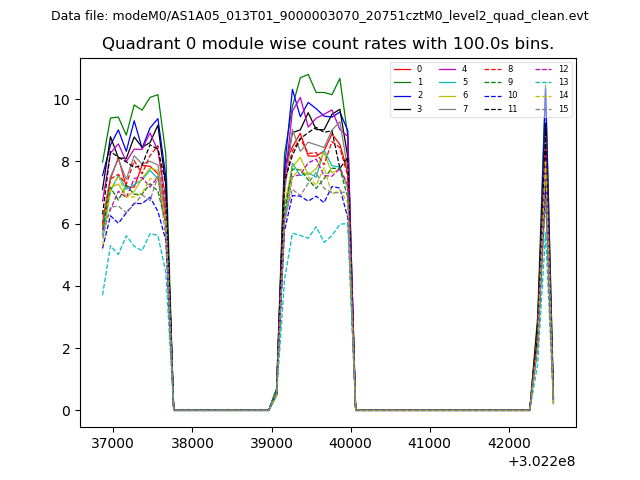 |
 |
| Module-wise count rates for Quadrant B Data is divided into 100 sec bins |
 |
 |
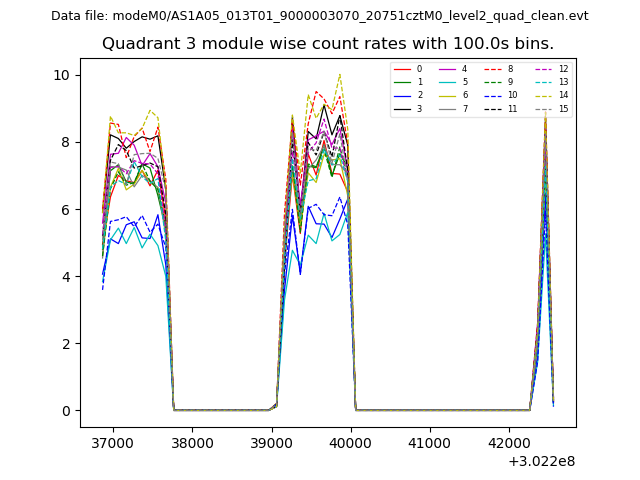
| Module-wise count rates for Quadrant C Data is divided into 100 sec bins |
 |
 |
| Module-wise count rates for Quadrant D Data is divided into 100 sec bins |
 |
 |
| Parameter | Plot |
|---|---|
| CZT HV Monitor |  |
| D_VDD | 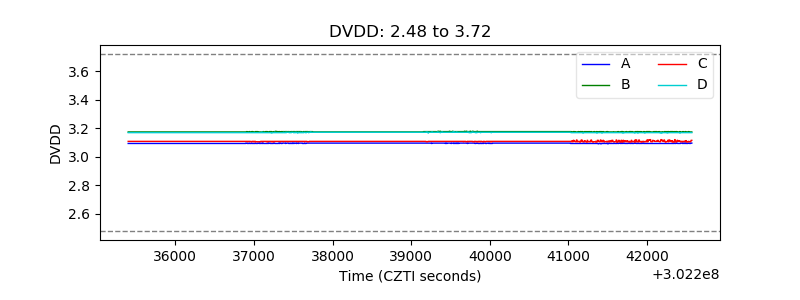 |
| Temperature 1 | 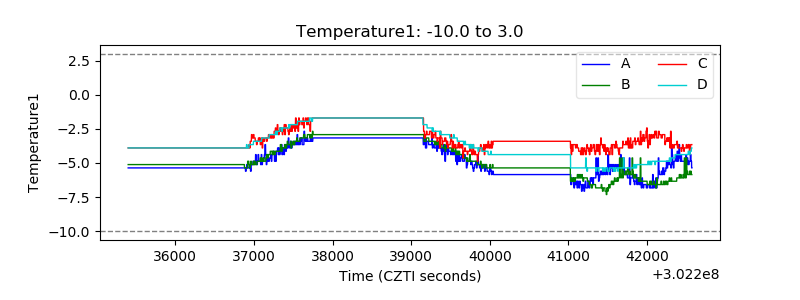 |
| Veto HV Monitor | 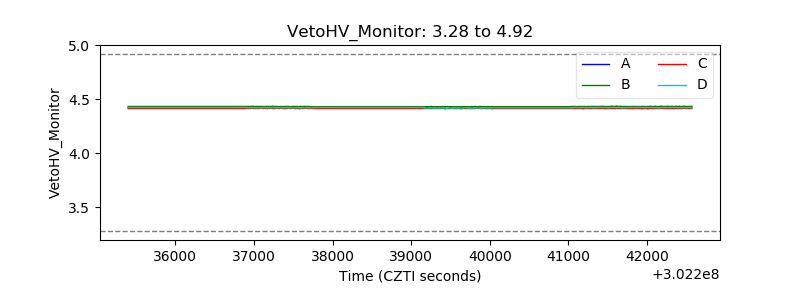 |
| Veto LLD | 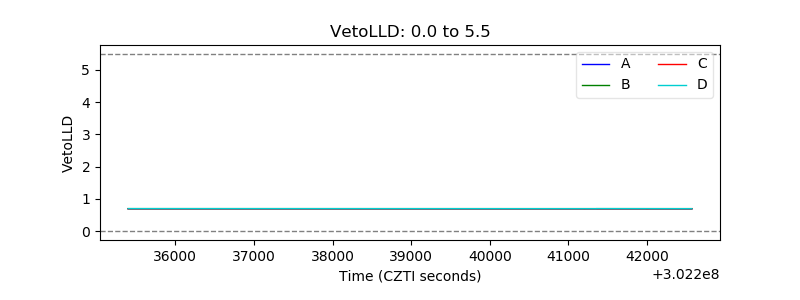 |
| Alpha Counter | 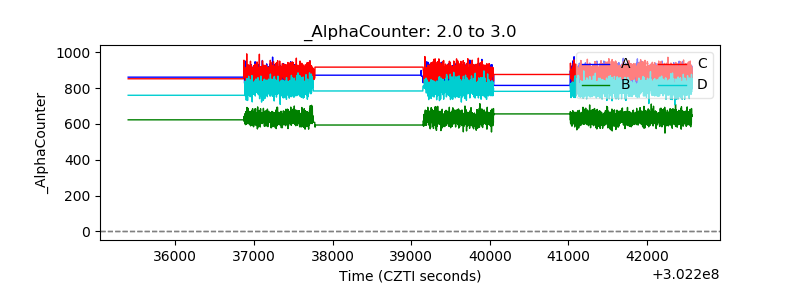 |
| _CPM_Rate | 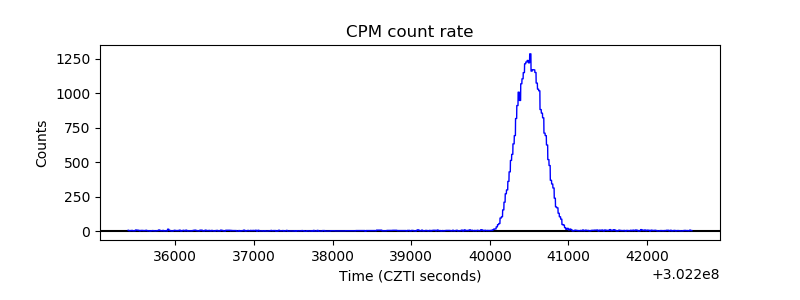 |
| CZT Counter | 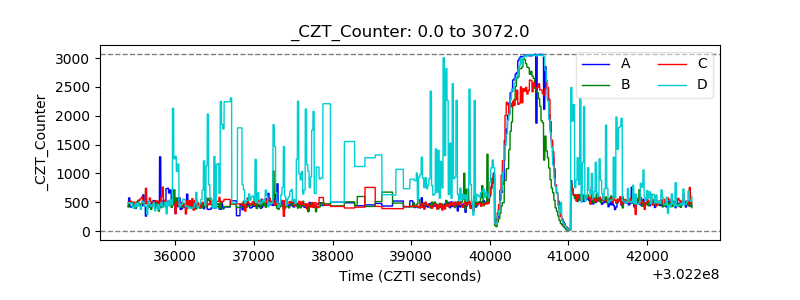 |
| +2.5 Volts monitor |  |
| +5 Volts monitor | 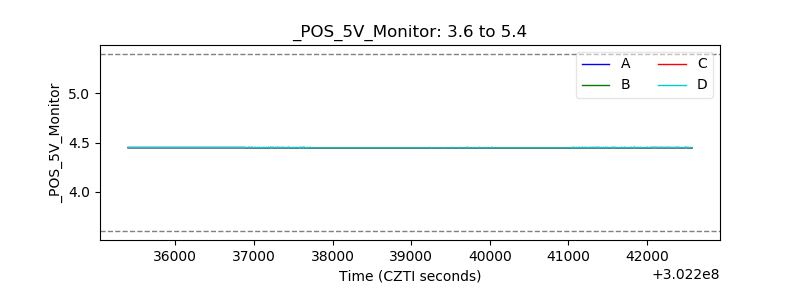 |
| _ROLL_ROT | 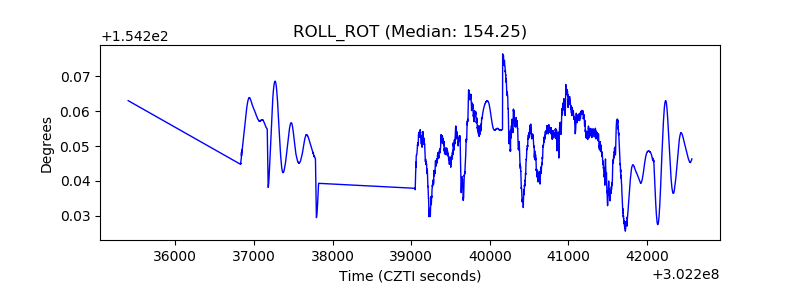 |
| _Roll_DEC | 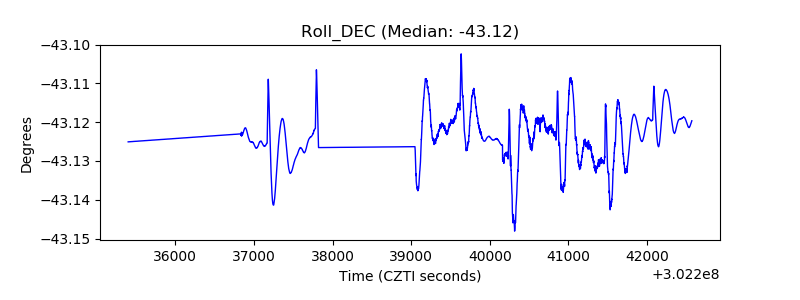 |
| _Roll_RA | 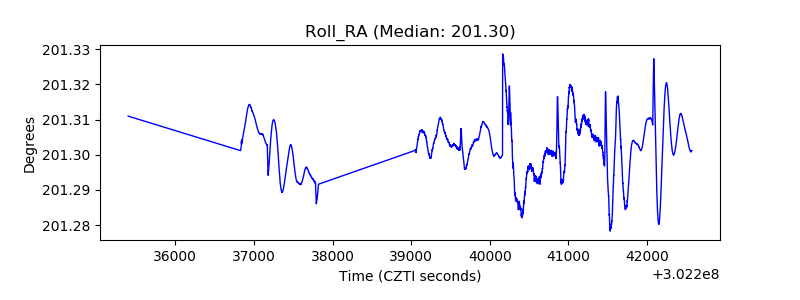 |
| Veto Counter | 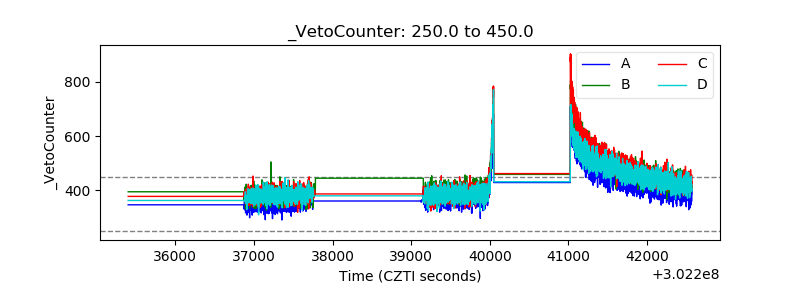 |