| Param | Original file | Final file |
|---|---|---|
| Filename | modeM0/AS1A05_013T01_9000003070_20754cztM0_level2.evt | modeM0/AS1A05_013T01_9000003070_20754cztM0_level2_quad_clean.evt |
| Size (bytes) | 1,295,988,480 | 245,344,320 |
| Size | 1.2 GB | 234.0 MB |
| Events in quadrant A | 8,317,139 | 1,618,998 |
| Events in quadrant B | 8,565,687 | 1,613,994 |
| Events in quadrant C | 8,472,021 | 1,562,699 |
| Events in quadrant D | 12,765,203 | 1,482,021 |
| Mode SS | |||
|---|---|---|---|
| Quadrant | BADHDUFLAG | Total packets | Discarded packets |
| A | 0 | 340 | 0 |
| B | 0 | 340 | 0 |
| C | 0 | 340 | 0 |
| D | 0 | 340 | 0 |
| Mode M0 | |||
|---|---|---|---|
| Quadrant | BADHDUFLAG | Total packets | Discarded packets |
| A | 0 | 35419 | 3 |
| B | 0 | 36024 | 3 |
| C | 0 | 35512 | 3 |
| D | 0 | 49137 | 5 |
| Mode M9 | |||
|---|---|---|---|
| Quadrant | BADHDUFLAG | Total packets | Discarded packets |
| A | 0 | 33 | 0 |
| B | 0 | 33 | 0 |
| C | 0 | 33 | 0 |
| D | 0 | 33 | 0 |
| Quadrant | Total seconds | Saturated seconds | Saturation percentage |
|---|---|---|---|
| A | 16725 | 139 | 0.831091% |
| B | 16725 | 194 | 1.159940% |
| C | 16725 | 227 | 1.357250% |
| D | 16724 | 1044 | 6.242526% |
Noise dominated data is calculated using 1-second bins in cleaned event files. If a bin has >2000 counts, and if more than 50% of those come from <1% of pixels, then it is considered to be noise-dominated and hence unusable.
| Quadrant | # 1 sec bins | Bins with >0 counts | Bins with >2000 counts | High rate bins dominated by noise | Noise dominated (total time) | Noise dominated (detector-on time) | Marked lightcurve |
|---|---|---|---|---|---|---|---|
| A | 20000 | 16727 | 17 | 17 | 0.09% | 0.10% | 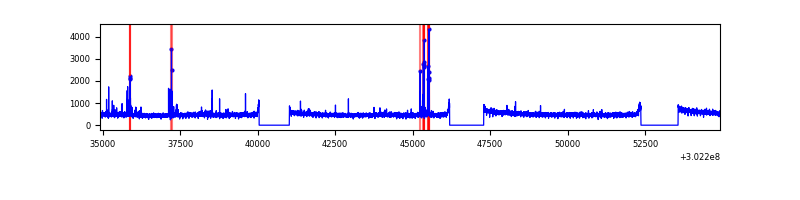 |
| B | 20000 | 16727 | 32 | 32 | 0.16% | 0.19% | 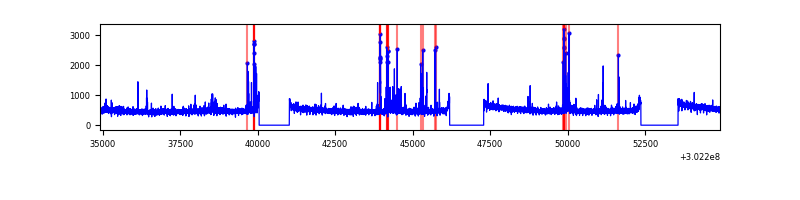 |
| C | 20000 | 16726 | 0 | 0 | 0.00% | 0.00% | 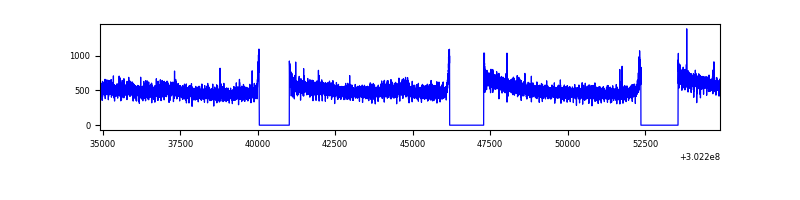 |
| D | 19999 | 16725 | 771 | 771 | 3.86% | 4.61% | 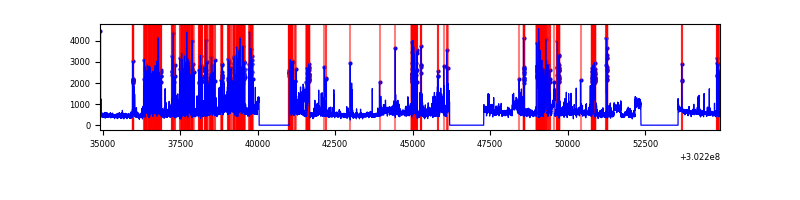 |
Top three noisy pixels from each quadrant. If the there are fewer than three noisy pixels in the level2.evt file, extra rows are filled as -1
| Pixel properties | Quadrant properties | ||||||
|---|---|---|---|---|---|---|---|
| Quadrant | DetID | PixID | Counts | Sigma | Mean | Median | Sigma |
| A | 5 | 16 | 187927 | 443.47 | 2115 | 2073 | 419.1 |
| A | 0 | 226 | 18415 | 38.99 | 2115 | 2073 | 419.1 |
| A | 3 | 137 | 16877 | 35.32 | 2115 | 2073 | 419.1 |
| B | 7 | 220 | 170848 | 435.4 | 2085 | 2035 | 387.7 |
| B | 0 | 197 | 79082 | 198.72 | 2085 | 2035 | 387.7 |
| B | 12 | 111 | 46583 | 114.9 | 2085 | 2035 | 387.7 |
| C | 14 | 238 | 321405 | 691.98 | 2020 | 2033 | 461.5 |
| C | 3 | 233 | 231856 | 497.96 | 2020 | 2033 | 461.5 |
| C | 7 | 247 | 19162 | 37.11 | 2020 | 2033 | 461.5 |
| D | 1 | 52 | 3110026 | 6508.51 | 2008 | 1961 | 477.5 |
| D | 1 | 20 | 1283007 | 2682.6 | 2008 | 1961 | 477.5 |
| D | 2 | 165 | 395698 | 824.51 | 2008 | 1961 | 477.5 |
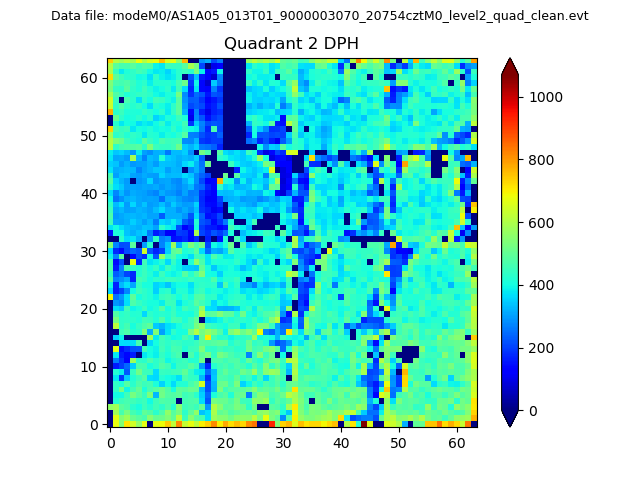
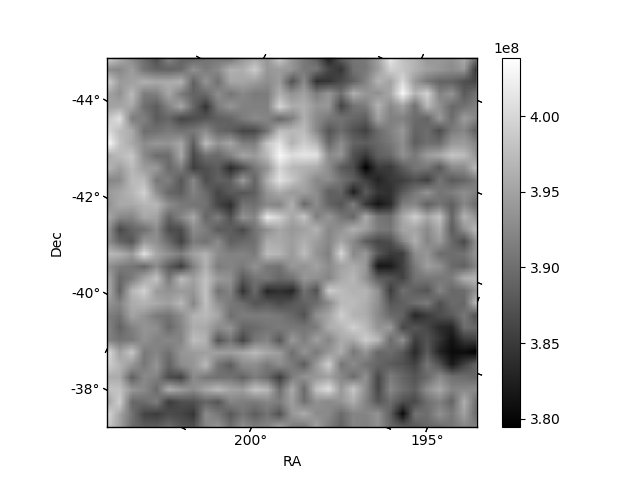
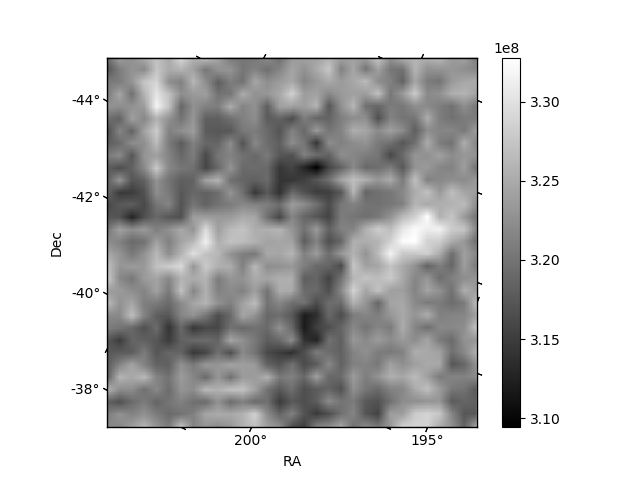
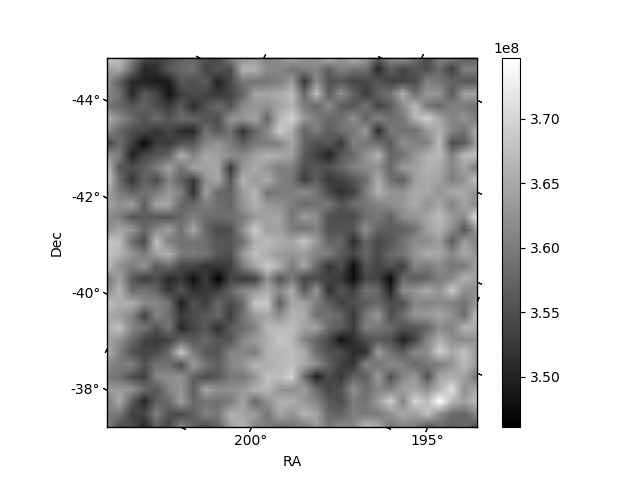
Histogram calculated using DETX and DETY for each event in the final _common_clean file
| Quadrant A | 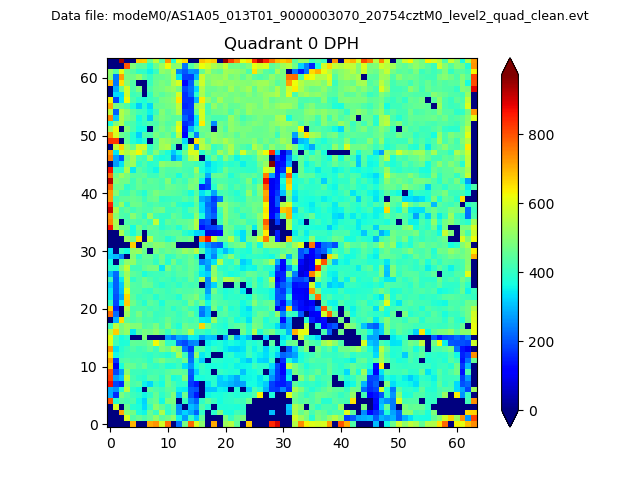 |
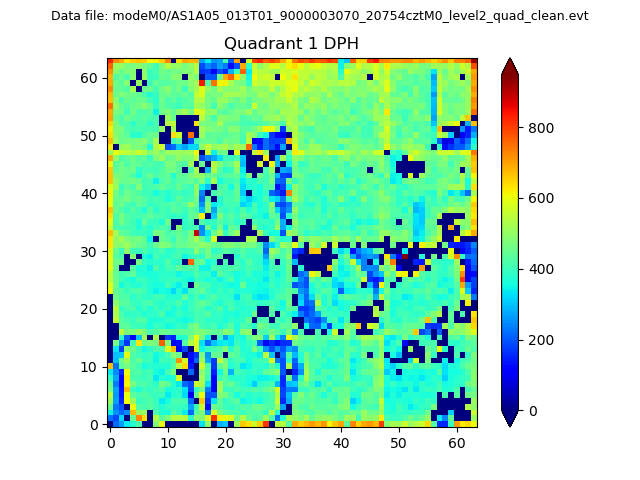 |
Quadrant B |
|---|---|---|---|
| Quadrant D | 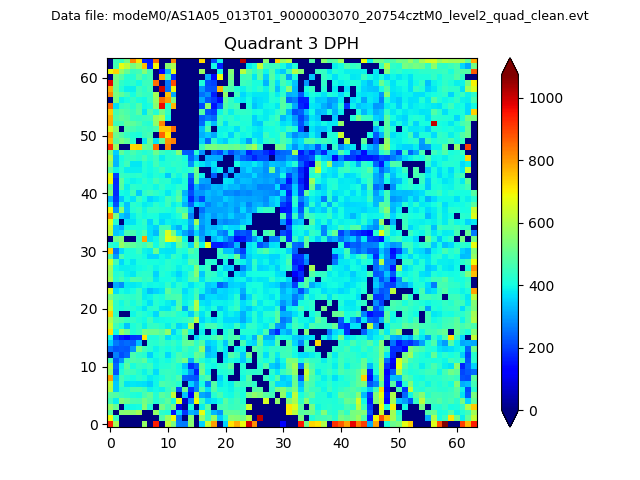 |
 |
Quadrant C |
| Plot type | Count rate plots | Images |
|---|---|---|
| Comparison with Poisson distribution Blue bars denote a histogram of data divided into 1 sec bins. Red curve is a Poisson curve with rate = median count rate of data. |
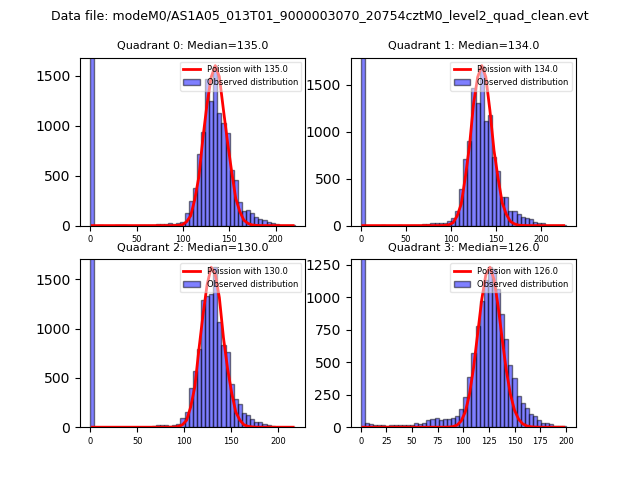 |
 |
| Quadrant-wise count rates Data is divided into 100 sec bins |
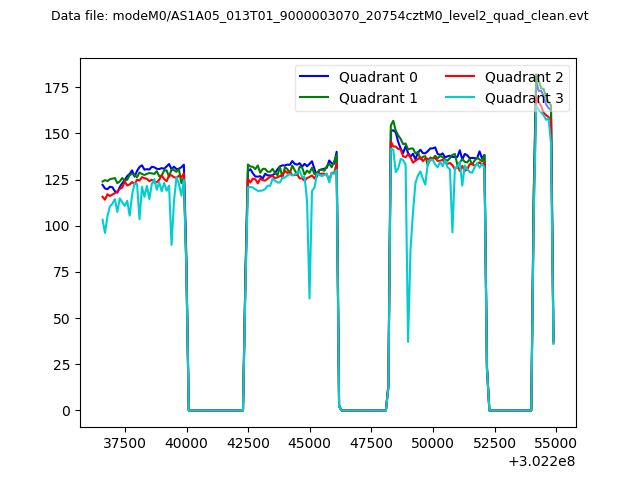 |
|
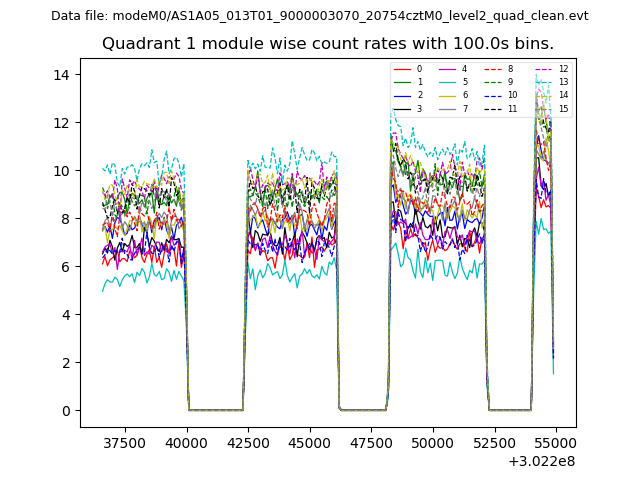
| Module-wise count rates for Quadrant A Data is divided into 100 sec bins |
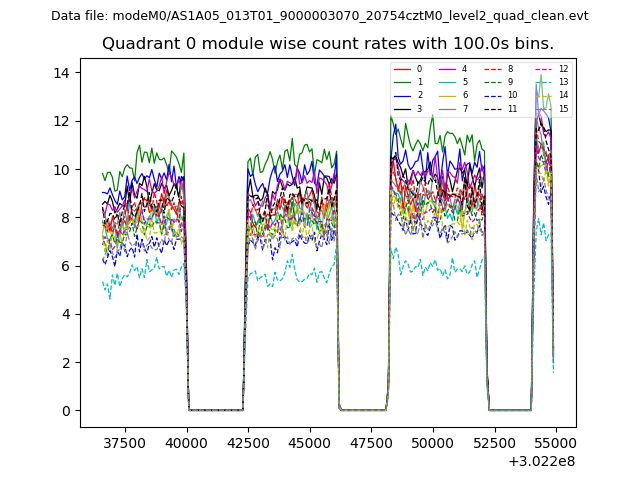 |
 |
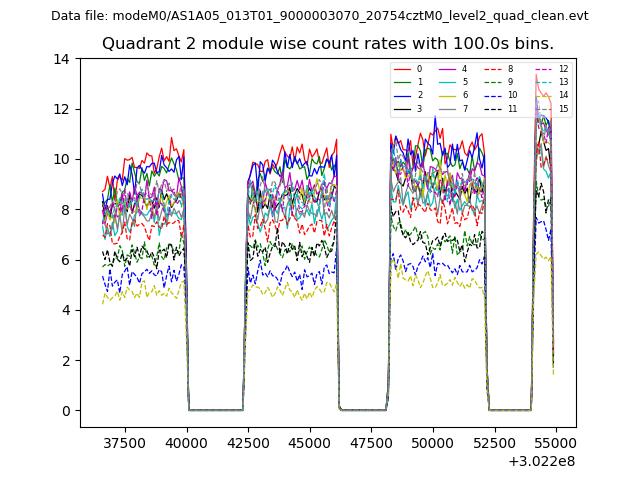
| Module-wise count rates for Quadrant B Data is divided into 100 sec bins |
 |
 |
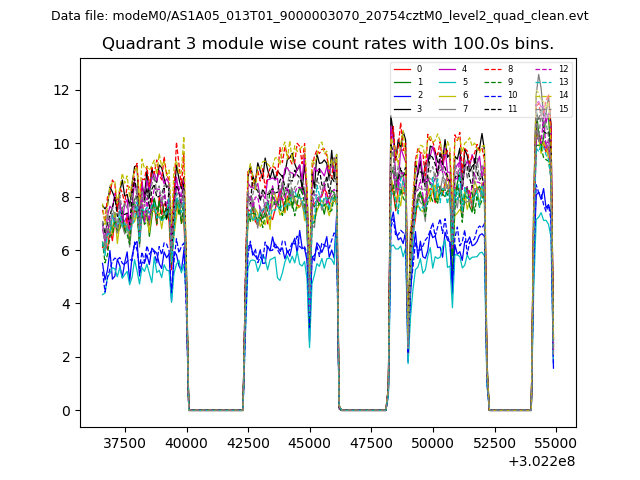
| Module-wise count rates for Quadrant C Data is divided into 100 sec bins |
 |
 |
| Module-wise count rates for Quadrant D Data is divided into 100 sec bins |
 |
 |
| Parameter | Plot |
|---|---|
| CZT HV Monitor |  |
| D_VDD | 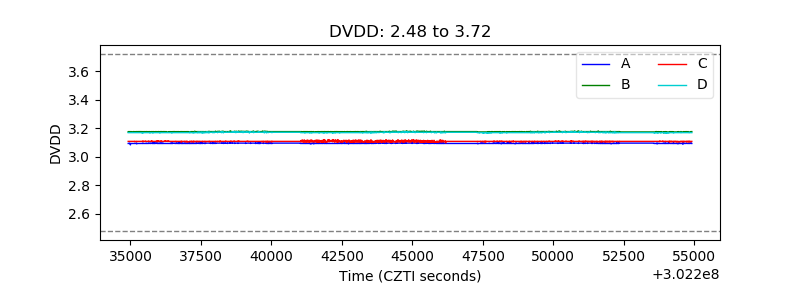 |
| Temperature 1 | 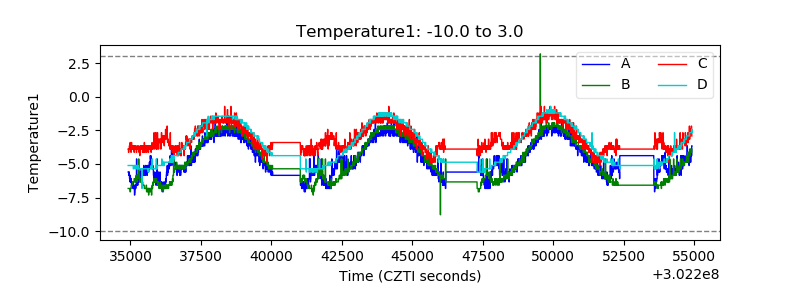 |
| Veto HV Monitor | 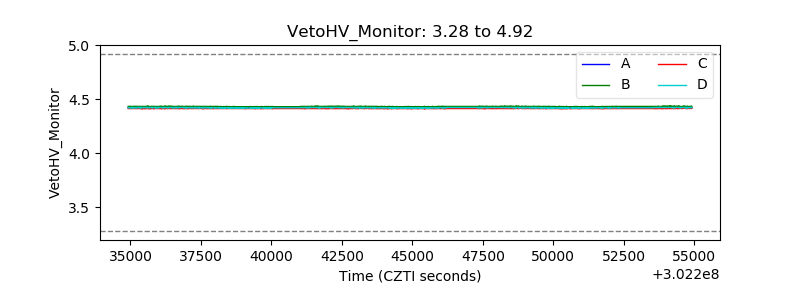 |
| Veto LLD | 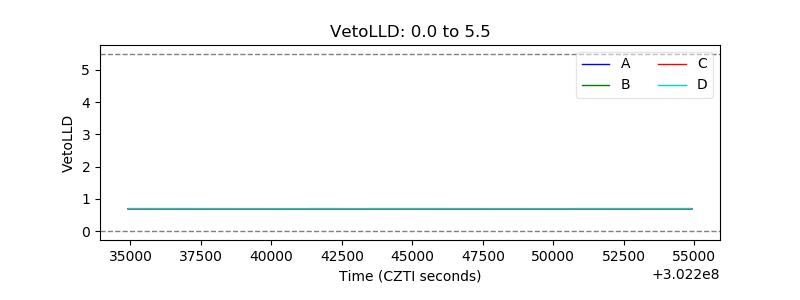 |
| Alpha Counter | 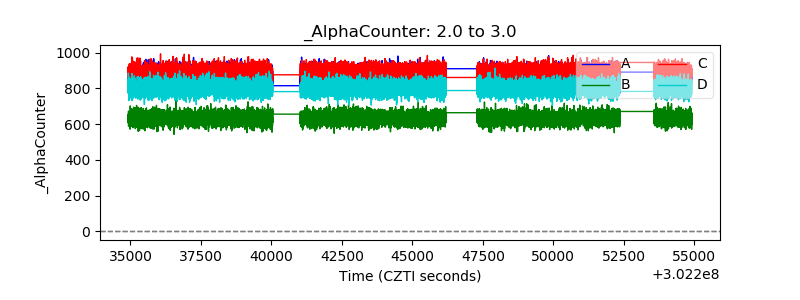 |
| _CPM_Rate | 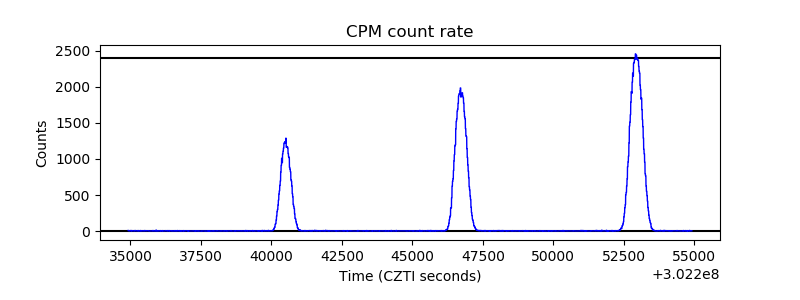 |
| CZT Counter | 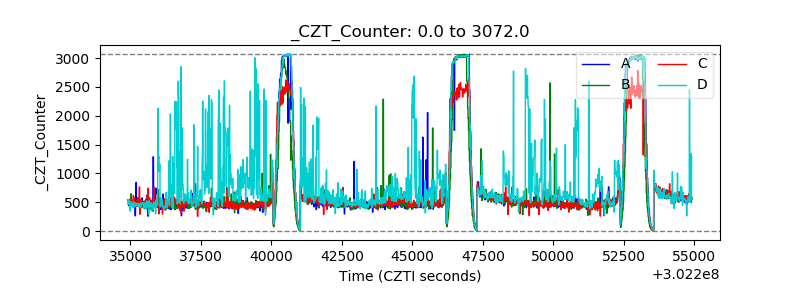 |
| +2.5 Volts monitor |  |
| +5 Volts monitor |  |
| _ROLL_ROT | 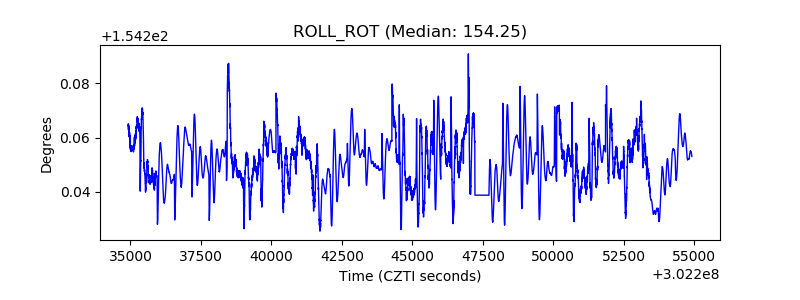 |
| _Roll_DEC | 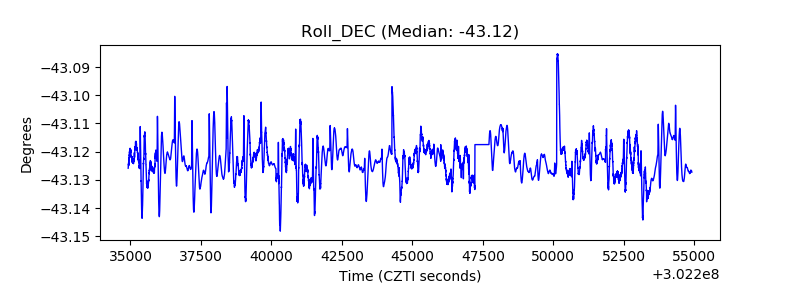 |
| _Roll_RA |  |
| Veto Counter | 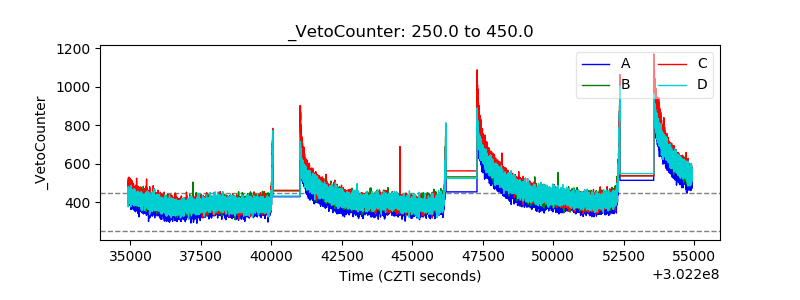 |