| Param | Original file | Final file |
|---|---|---|
| Filename | modeM0/AS1A05_013T01_9000003070_20756cztM0_level2.evt | modeM0/AS1A05_013T01_9000003070_20756cztM0_level2_quad_clean.evt |
| Size (bytes) | 486,861,120 | 126,901,440 |
| Size | 464.3 MB | 121.0 MB |
| Events in quadrant A | 3,445,833 | 881,832 |
| Events in quadrant B | 3,666,150 | 865,252 |
| Events in quadrant C | 3,387,360 | 830,675 |
| Events in quadrant D | 3,820,926 | 829,368 |
| Mode SS | |||
|---|---|---|---|
| Quadrant | BADHDUFLAG | Total packets | Discarded packets |
| A | 0 | 128 | 0 |
| B | 0 | 128 | 0 |
| C | 0 | 128 | 0 |
| D | 0 | 128 | 0 |
| Mode M0 | |||
|---|---|---|---|
| Quadrant | BADHDUFLAG | Total packets | Discarded packets |
| A | 0 | 14292 | 2 |
| B | 0 | 14943 | 2 |
| C | 0 | 14192 | 2 |
| D | 0 | 15617 | 2 |
| Mode M9 | |||
|---|---|---|---|
| Quadrant | BADHDUFLAG | Total packets | Discarded packets |
| A | 0 | 14 | 0 |
| B | 0 | 15 | 0 |
| C | 0 | 15 | 0 |
| D | 0 | 15 | 0 |
| Quadrant | Total seconds | Saturated seconds | Saturation percentage |
|---|---|---|---|
| A | 6250 | 109 | 1.744000% |
| B | 6250 | 151 | 2.416000% |
| C | 6250 | 155 | 2.480000% |
| D | 6250 | 105 | 1.680000% |
Noise dominated data is calculated using 1-second bins in cleaned event files. If a bin has >2000 counts, and if more than 50% of those come from <1% of pixels, then it is considered to be noise-dominated and hence unusable.
| Quadrant | # 1 sec bins | Bins with >0 counts | Bins with >2000 counts | High rate bins dominated by noise | Noise dominated (total time) | Noise dominated (detector-on time) | Marked lightcurve |
|---|---|---|---|---|---|---|---|
| A | 7570 | 6250 | 2 | 2 | 0.03% | 0.03% |  |
| B | 7570 | 6250 | 31 | 31 | 0.41% | 0.50% |  |
| C | 7570 | 6250 | 0 | 0 | 0.00% | 0.00% |  |
| D | 7570 | 6250 | 6 | 6 | 0.08% | 0.10% |  |
Top three noisy pixels from each quadrant. If the there are fewer than three noisy pixels in the level2.evt file, extra rows are filled as -1
| Pixel properties | Quadrant properties | ||||||
|---|---|---|---|---|---|---|---|
| Quadrant | DetID | PixID | Counts | Sigma | Mean | Median | Sigma |
| A | 5 | 16 | 23114 | 125.41 | 891 | 877 | 177.3 |
| A | 0 | 226 | 7857 | 39.37 | 891 | 877 | 177.3 |
| A | 12 | 194 | 6446 | 31.41 | 891 | 877 | 177.3 |
| B | 7 | 220 | 215374 | 1334.64 | 861 | 843 | 160.7 |
| B | 0 | 197 | 29696 | 179.5 | 861 | 843 | 160.7 |
| B | 0 | 189 | 21965 | 131.4 | 861 | 843 | 160.7 |
| C | 14 | 238 | 135446 | 706.71 | 833 | 841 | 190.5 |
| C | 13 | 61 | 5866 | 26.38 | 833 | 841 | 190.5 |
| C | 3 | 233 | 3135 | 12.04 | 833 | 841 | 190.5 |
| D | 12 | 227 | 167923 | 820.86 | 864 | 842 | 203.5 |
| D | 1 | 20 | 163094 | 797.13 | 864 | 842 | 203.5 |
| D | 1 | 52 | 119995 | 585.39 | 864 | 842 | 203.5 |
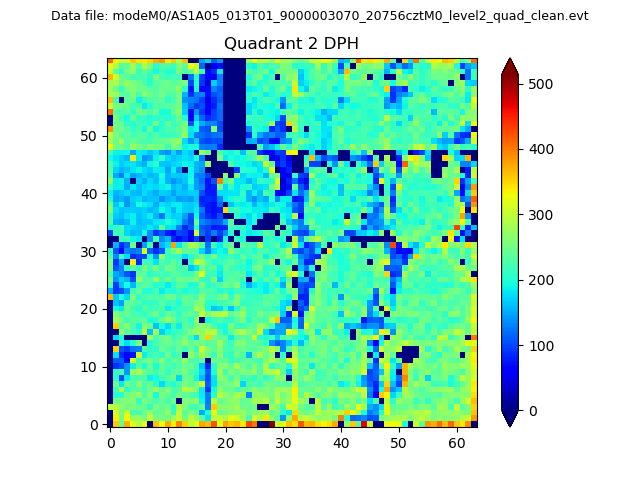
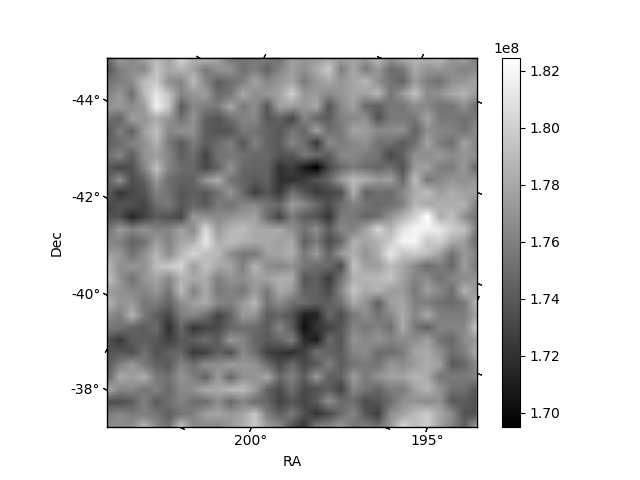
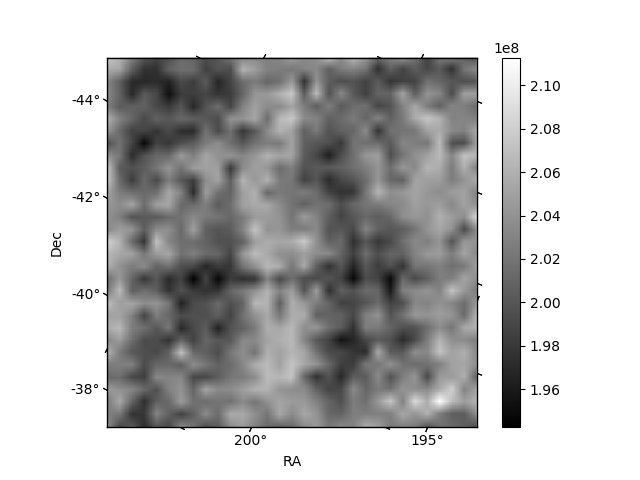
Histogram calculated using DETX and DETY for each event in the final _common_clean file
| Quadrant A | 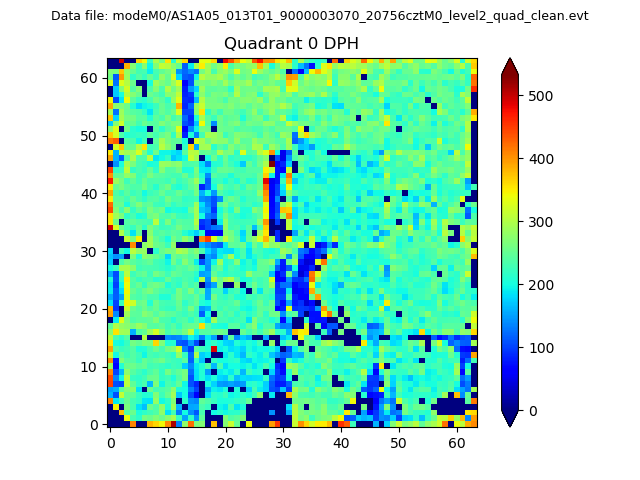 |
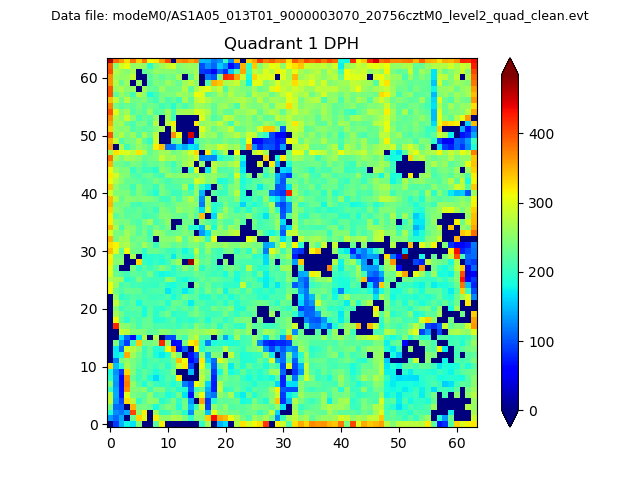 |
Quadrant B |
|---|---|---|---|
| Quadrant D | 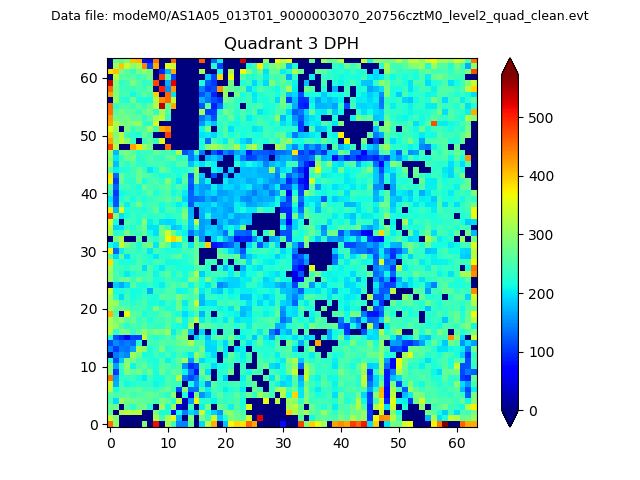 |
 |
Quadrant C |
| Plot type | Count rate plots | Images |
|---|---|---|
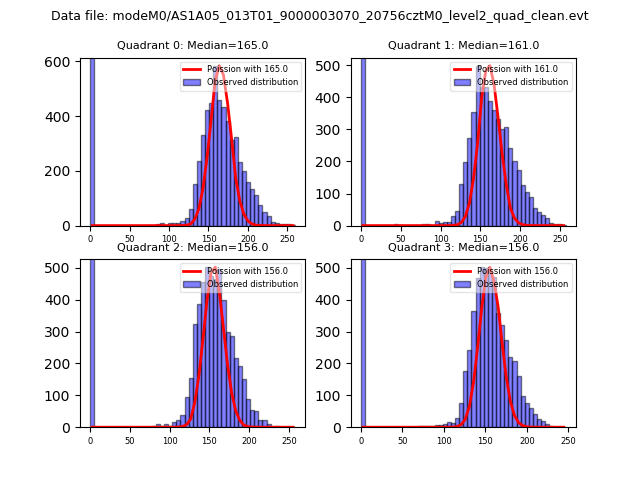
| Comparison with Poisson distribution Blue bars denote a histogram of data divided into 1 sec bins. Red curve is a Poisson curve with rate = median count rate of data. |
 |
 |
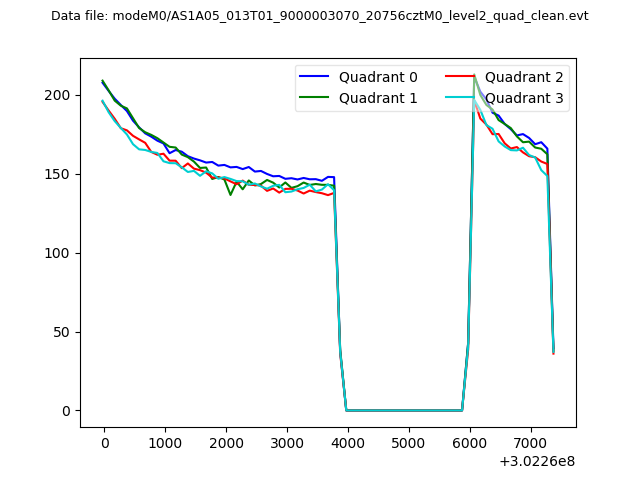
| Quadrant-wise count rates Data is divided into 100 sec bins |
 |
|
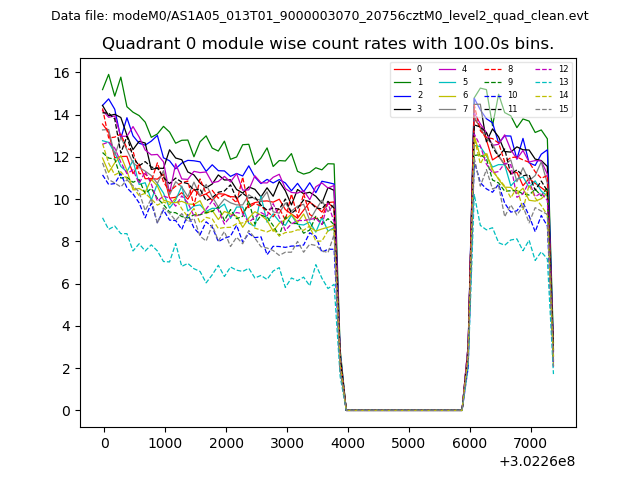
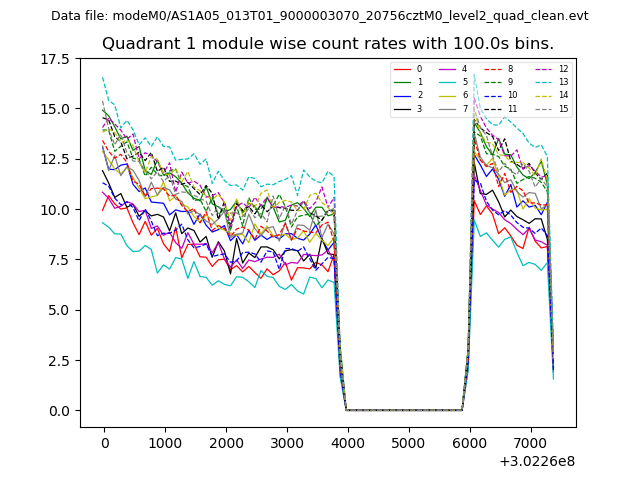
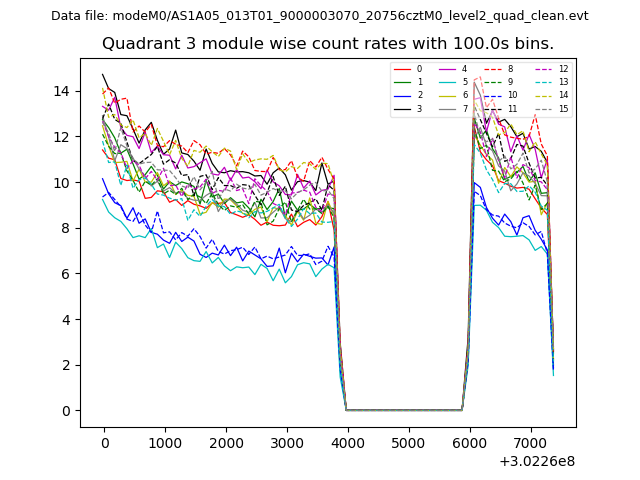
| Module-wise count rates for Quadrant A Data is divided into 100 sec bins |
 |
 |
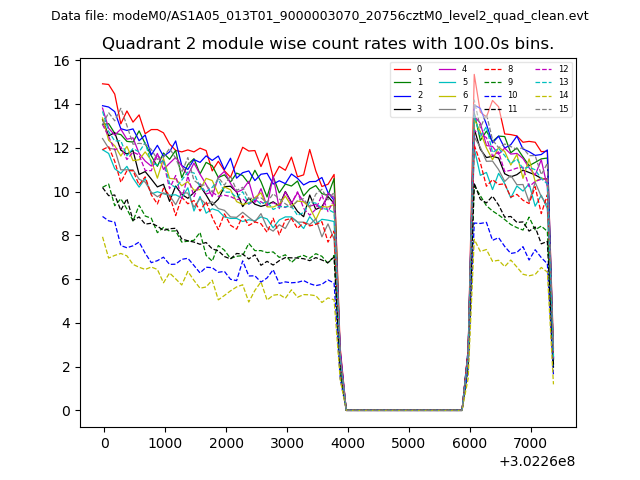
| Module-wise count rates for Quadrant B Data is divided into 100 sec bins |
 |
 |
| Module-wise count rates for Quadrant C Data is divided into 100 sec bins |
 |
 |
| Module-wise count rates for Quadrant D Data is divided into 100 sec bins |
 |
 |
| Parameter | Plot |
|---|---|
| CZT HV Monitor | 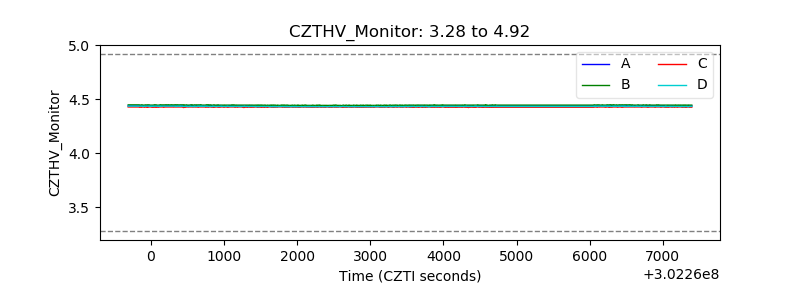 |
| D_VDD | 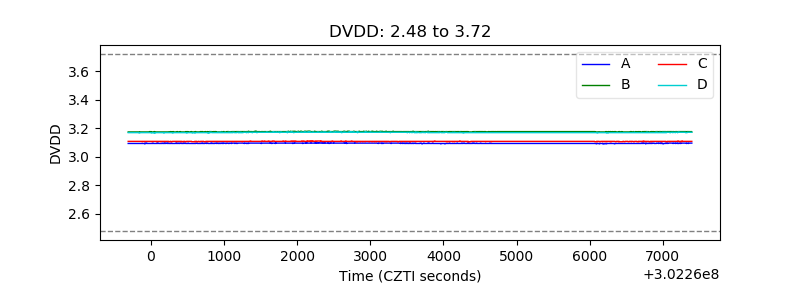 |
| Temperature 1 | 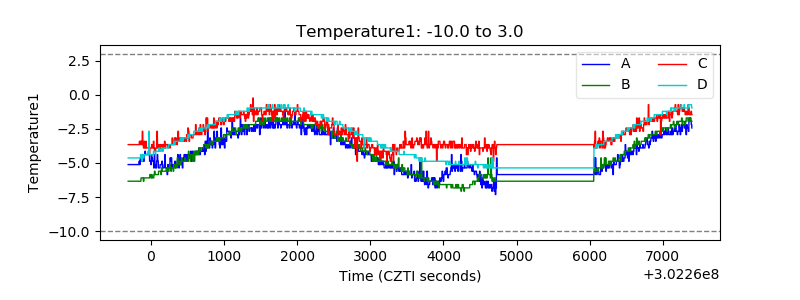 |
| Veto HV Monitor | 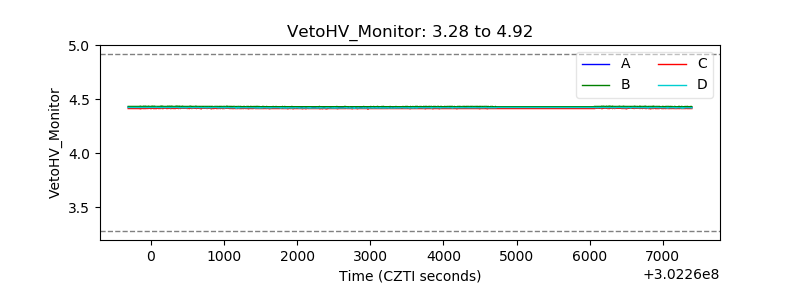 |
| Veto LLD |  |
| Alpha Counter | 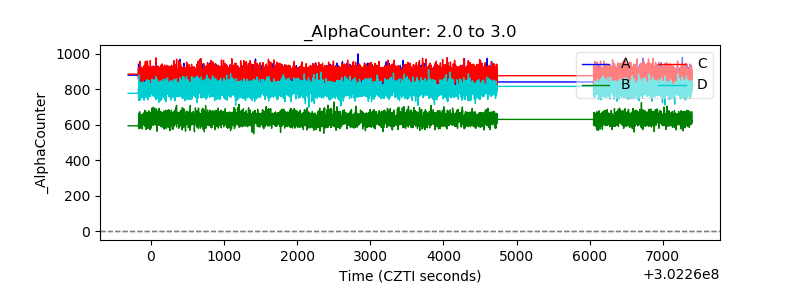 |
| _CPM_Rate | 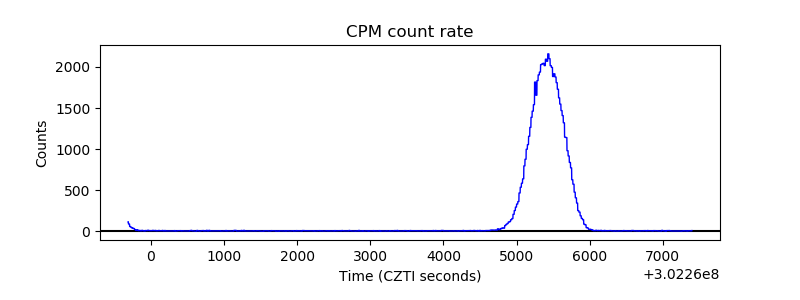 |
| CZT Counter | 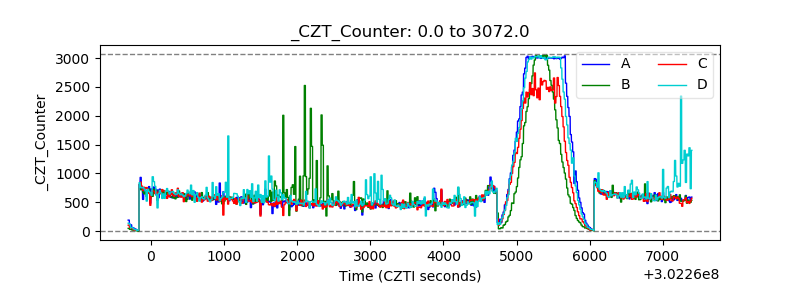 |
| +2.5 Volts monitor |  |
| +5 Volts monitor |  |
| _ROLL_ROT | 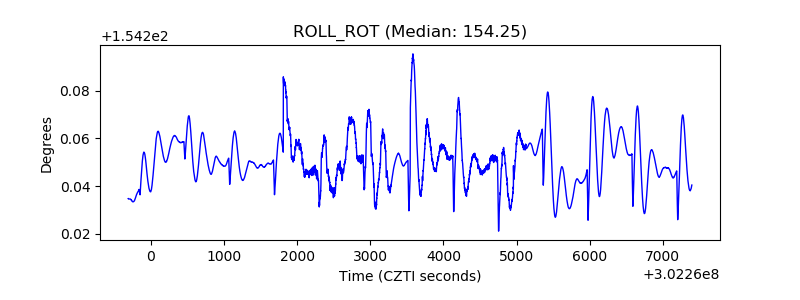 |
| _Roll_DEC | 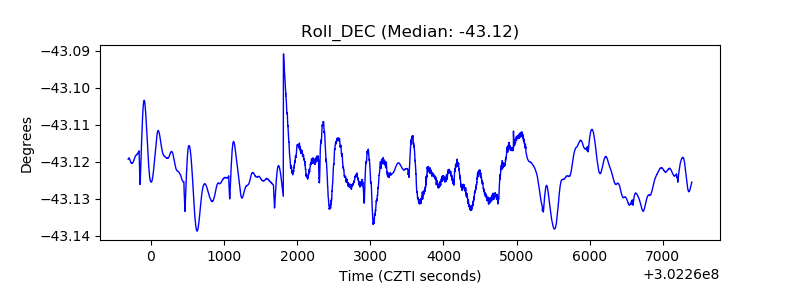 |
| _Roll_RA | 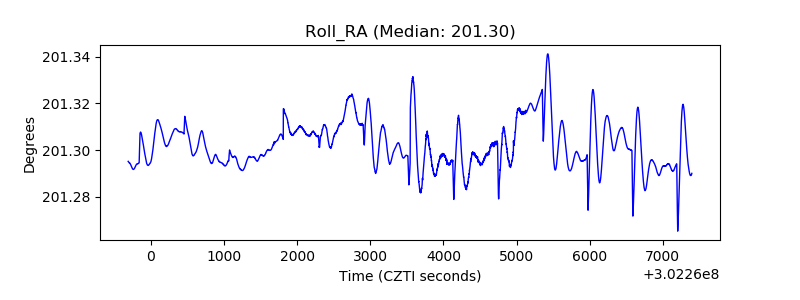 |
| Veto Counter | 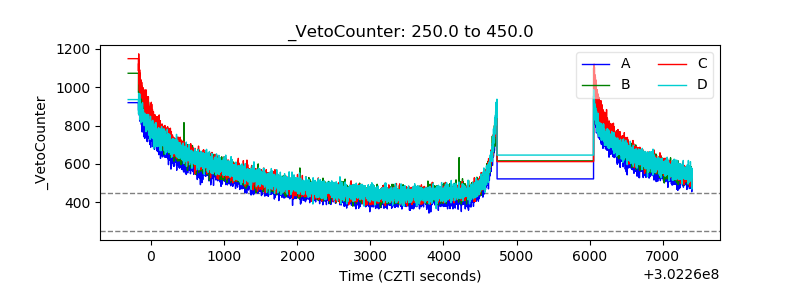 |