| Param | Original file | Final file |
|---|---|---|
| Filename | modeM0/AS1A05_013T01_9000003070_20757cztM0_level2.evt | modeM0/AS1A05_013T01_9000003070_20757cztM0_level2_quad_clean.evt |
| Size (bytes) | 512,553,600 | 119,661,120 |
| Size | 488.8 MB | 114.1 MB |
| Events in quadrant A | 3,545,071 | 828,310 |
| Events in quadrant B | 3,574,763 | 810,601 |
| Events in quadrant C | 3,277,952 | 777,294 |
| Events in quadrant D | 4,694,650 | 765,043 |
| Mode SS | |||
|---|---|---|---|
| Quadrant | BADHDUFLAG | Total packets | Discarded packets |
| A | 0 | 128 | 0 |
| B | 0 | 128 | 0 |
| C | 0 | 128 | 0 |
| D | 0 | 128 | 0 |
| Mode M0 | |||
|---|---|---|---|
| Quadrant | BADHDUFLAG | Total packets | Discarded packets |
| A | 0 | 14543 | 1 |
| B | 0 | 14622 | 1 |
| C | 0 | 13779 | 1 |
| D | 0 | 18182 | 1 |
| Mode M9 | |||
|---|---|---|---|
| Quadrant | BADHDUFLAG | Total packets | Discarded packets |
| A | 0 | 13 | 0 |
| B | 0 | 13 | 0 |
| C | 0 | 13 | 0 |
| D | 0 | 13 | 0 |
| Quadrant | Total seconds | Saturated seconds | Saturation percentage |
|---|---|---|---|
| A | 6350 | 106 | 1.669291% |
| B | 6351 | 109 | 1.716265% |
| C | 6350 | 118 | 1.858268% |
| D | 6350 | 212 | 3.338583% |
Noise dominated data is calculated using 1-second bins in cleaned event files. If a bin has >2000 counts, and if more than 50% of those come from <1% of pixels, then it is considered to be noise-dominated and hence unusable.
| Quadrant | # 1 sec bins | Bins with >0 counts | Bins with >2000 counts | High rate bins dominated by noise | Noise dominated (total time) | Noise dominated (detector-on time) | Marked lightcurve |
|---|---|---|---|---|---|---|---|
| A | 7665 | 6351 | 18 | 18 | 0.23% | 0.28% | 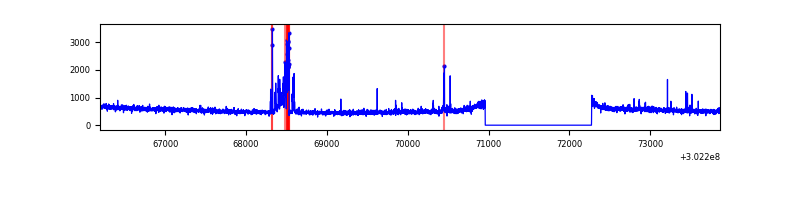 |
| B | 7666 | 6352 | 18 | 18 | 0.23% | 0.28% | 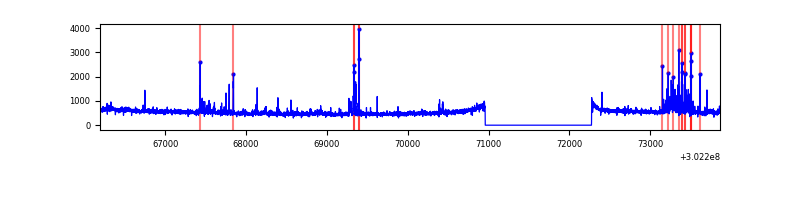 |
| C | 7665 | 6350 | 0 | 0 | 0.00% | 0.00% | 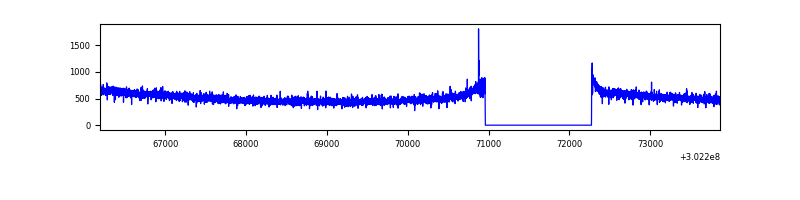 |
| D | 7664 | 6350 | 162 | 162 | 2.11% | 2.55% | 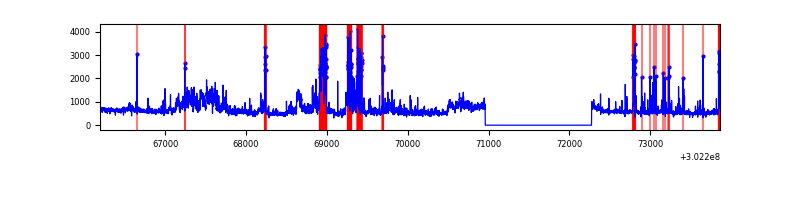 |
Top three noisy pixels from each quadrant. If the there are fewer than three noisy pixels in the level2.evt file, extra rows are filled as -1
| Pixel properties | Quadrant properties | ||||||
|---|---|---|---|---|---|---|---|
| Quadrant | DetID | PixID | Counts | Sigma | Mean | Median | Sigma |
| A | 5 | 16 | 205806 | 1185.54 | 869 | 855 | 172.9 |
| A | 0 | 226 | 7731 | 39.77 | 869 | 855 | 172.9 |
| A | 12 | 194 | 6435 | 32.28 | 869 | 855 | 172.9 |
| B | 7 | 220 | 175626 | 1120.75 | 841 | 824 | 156.0 |
| B | 0 | 197 | 36292 | 227.4 | 841 | 824 | 156.0 |
| B | 0 | 190 | 26497 | 164.6 | 841 | 824 | 156.0 |
| C | 14 | 238 | 130215 | 700.99 | 805 | 811 | 184.6 |
| C | 13 | 61 | 5686 | 26.41 | 805 | 811 | 184.6 |
| C | 9 | 54 | 4256 | 18.66 | 805 | 811 | 184.6 |
| D | 12 | 227 | 933871 | 4712.55 | 831 | 810 | 198.0 |
| D | 1 | 52 | 306608 | 1544.47 | 831 | 810 | 198.0 |
| D | 1 | 20 | 153473 | 771.04 | 831 | 810 | 198.0 |
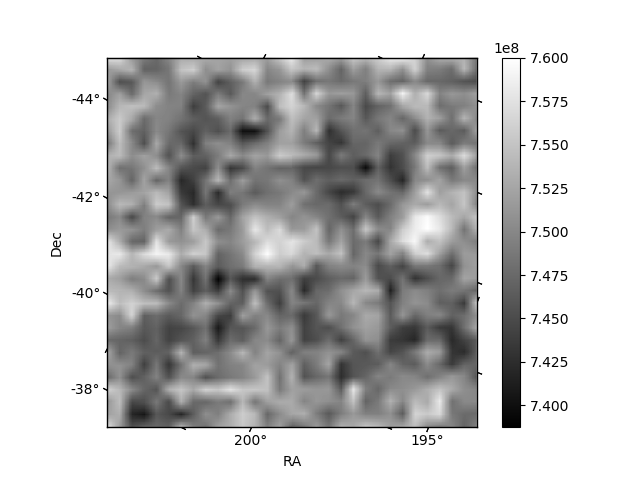
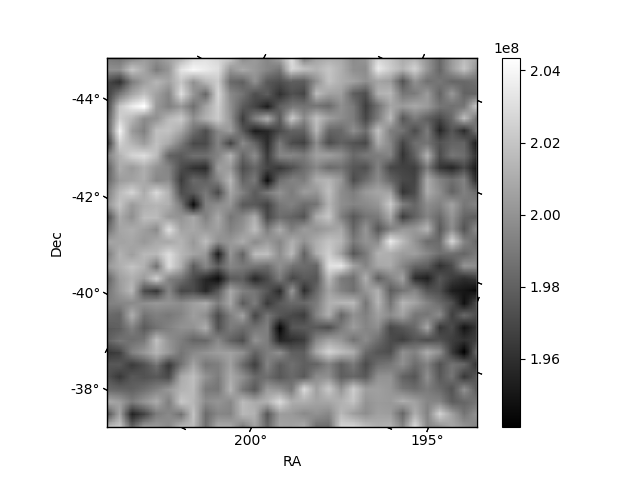
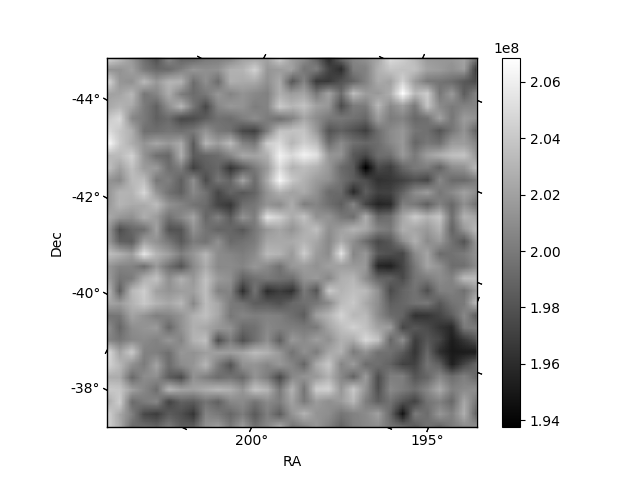
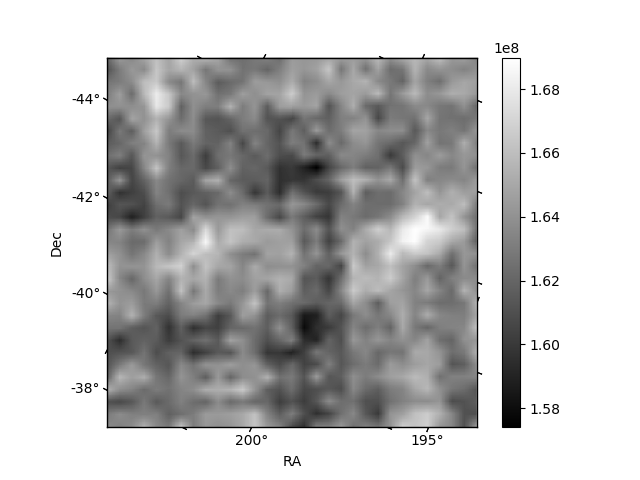
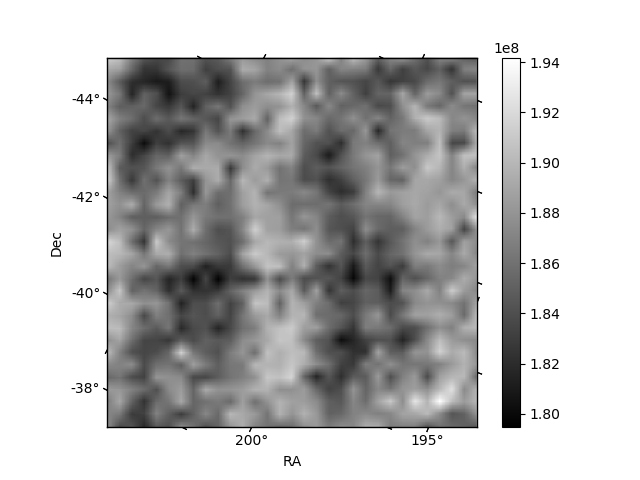
Histogram calculated using DETX and DETY for each event in the final _common_clean file
| Quadrant A | 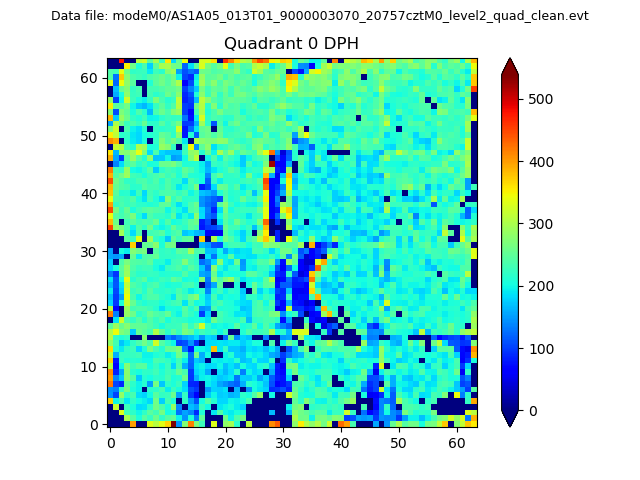 |
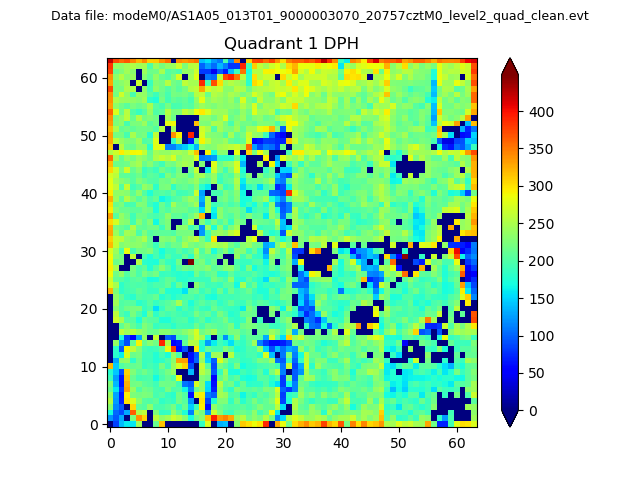 |
Quadrant B |
|---|---|---|---|
| Quadrant D | 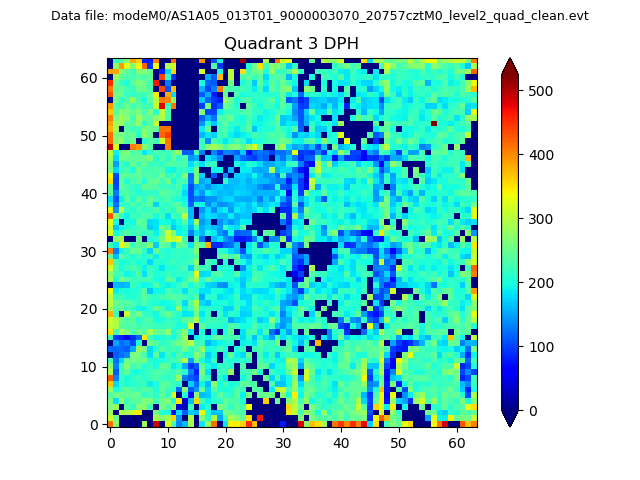 |
 |
Quadrant C |
| Plot type | Count rate plots | Images |
|---|---|---|
| Comparison with Poisson distribution Blue bars denote a histogram of data divided into 1 sec bins. Red curve is a Poisson curve with rate = median count rate of data. |
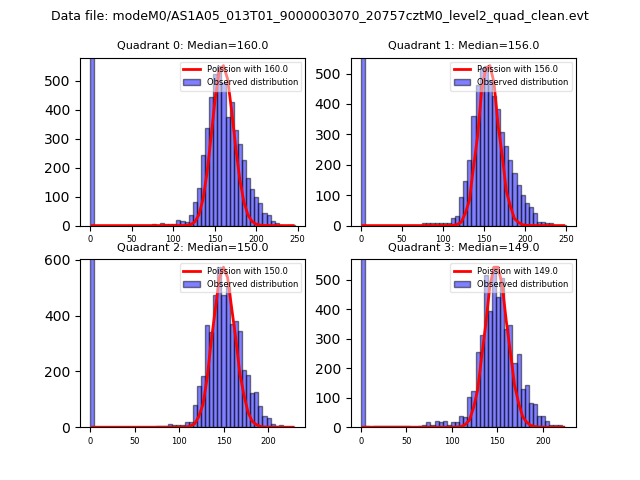 |
 |
| Quadrant-wise count rates Data is divided into 100 sec bins |
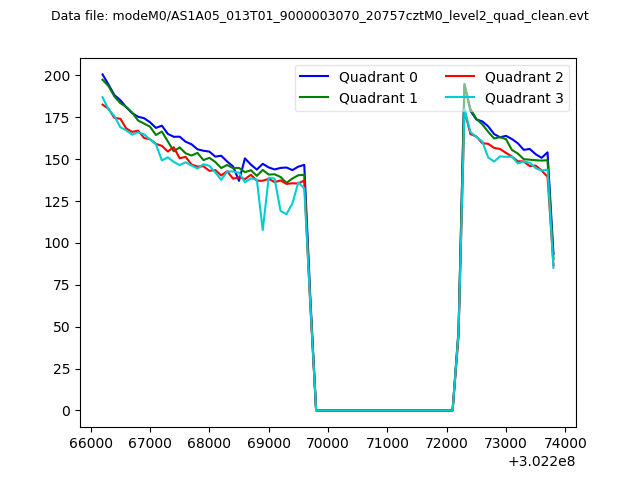 |
|
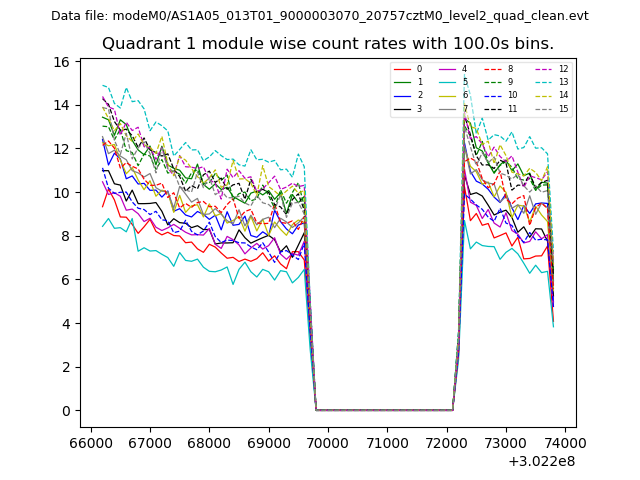
| Module-wise count rates for Quadrant A Data is divided into 100 sec bins |
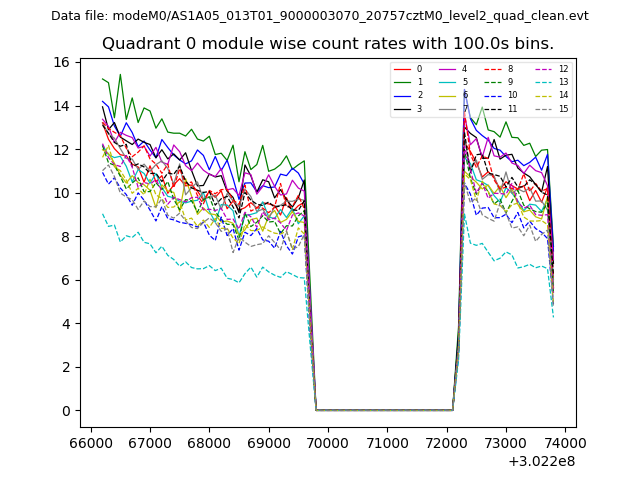 |
 |
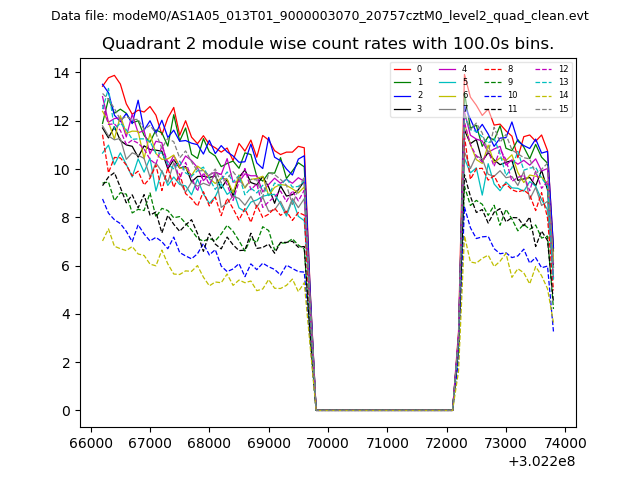
| Module-wise count rates for Quadrant B Data is divided into 100 sec bins |
 |
 |
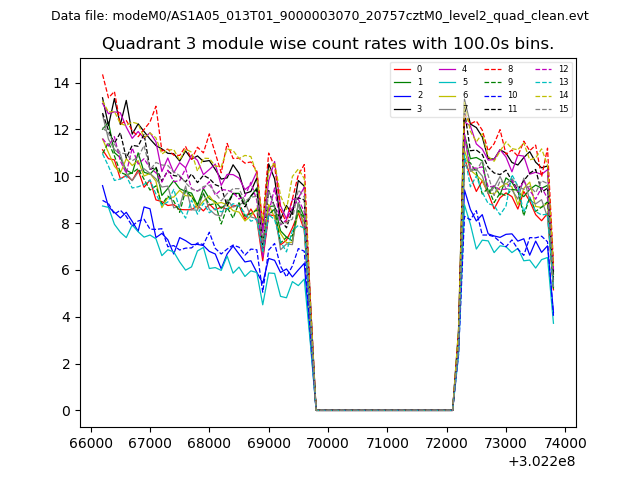
| Module-wise count rates for Quadrant C Data is divided into 100 sec bins |
 |
 |
| Module-wise count rates for Quadrant D Data is divided into 100 sec bins |
 |
 |
| Parameter | Plot |
|---|---|
| CZT HV Monitor | 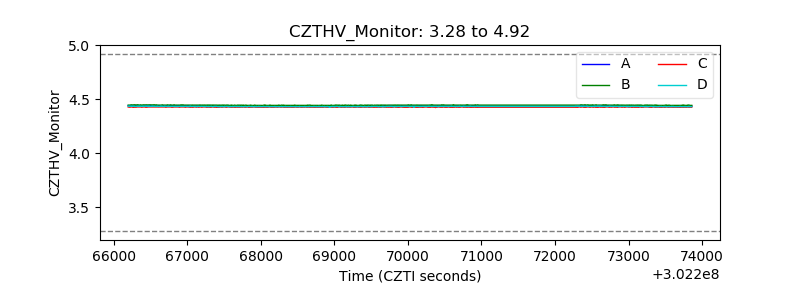 |
| D_VDD | 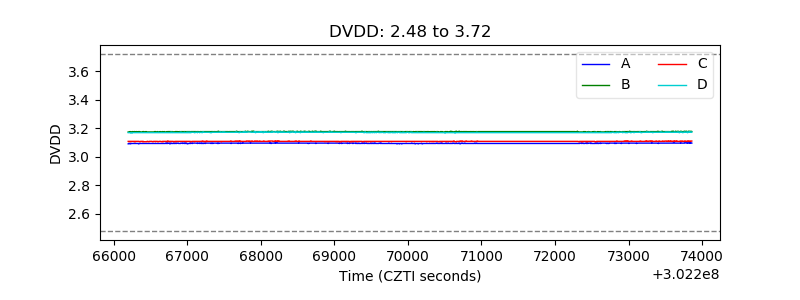 |
| Temperature 1 | 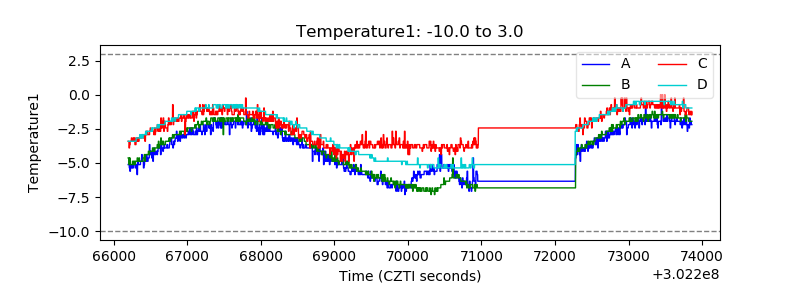 |
| Veto HV Monitor | 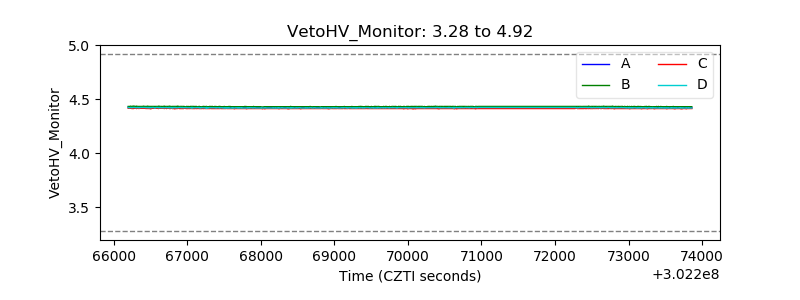 |
| Veto LLD | 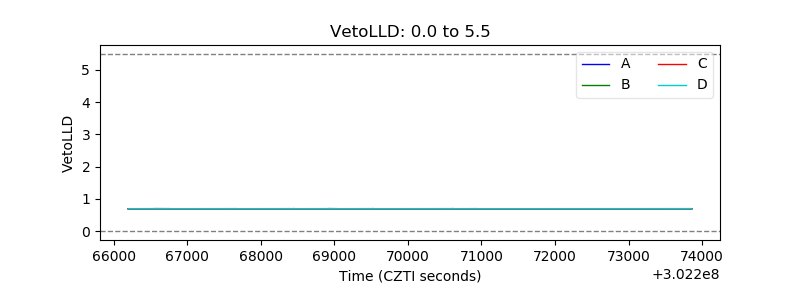 |
| Alpha Counter | 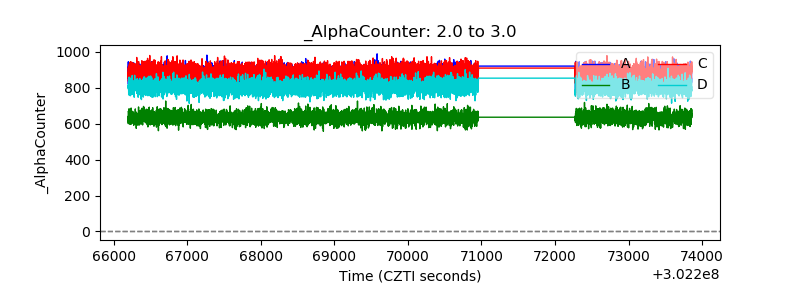 |
| _CPM_Rate | 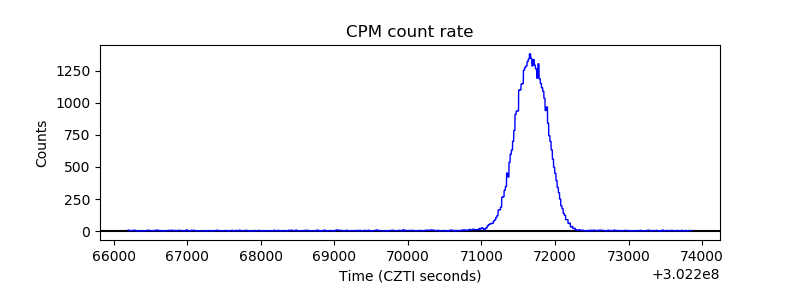 |
| CZT Counter | 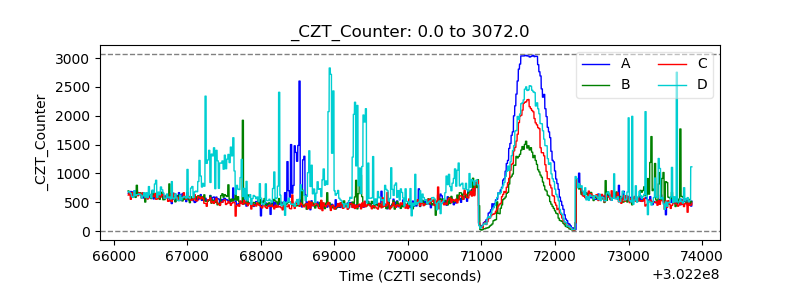 |
| +2.5 Volts monitor | 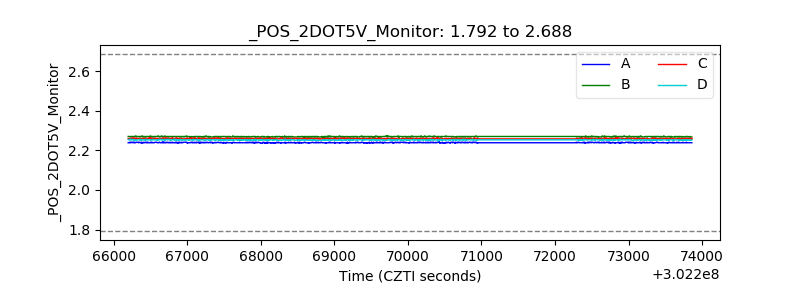 |
| +5 Volts monitor |  |
| _ROLL_ROT | 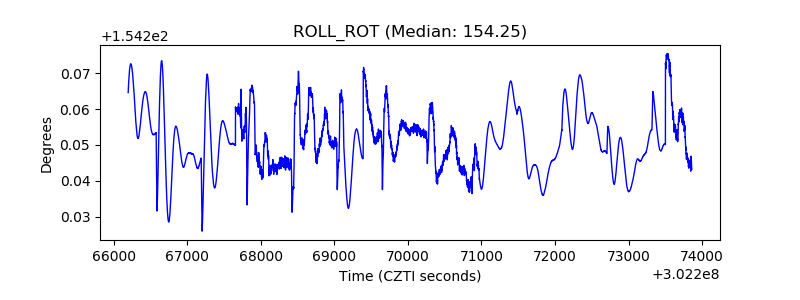 |
| _Roll_DEC |  |
| _Roll_RA | 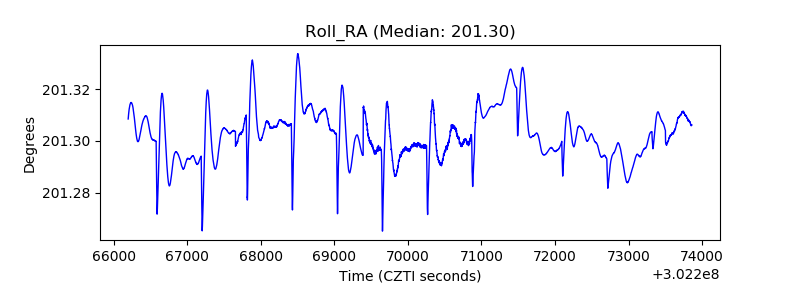 |
| Veto Counter | 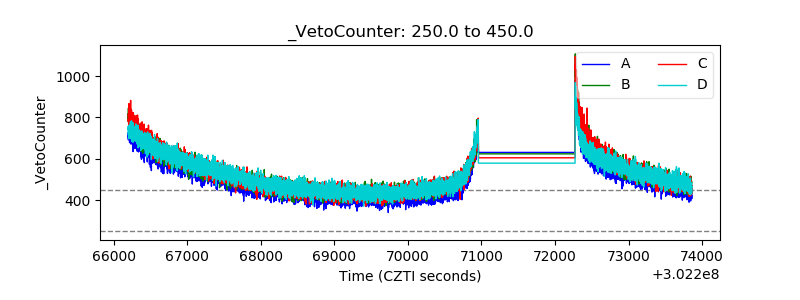 |