| Param | Original file | Final file |
|---|---|---|
| Filename | modeM0/AS1A05_013T01_9000003070_20759cztM0_level2.evt | modeM0/AS1A05_013T01_9000003070_20759cztM0_level2_quad_clean.evt |
| Size (bytes) | 501,719,040 | 97,292,160 |
| Size | 478.5 MB | 92.8 MB |
| Events in quadrant A | 3,289,280 | 641,709 |
| Events in quadrant B | 3,411,961 | 632,111 |
| Events in quadrant C | 3,125,074 | 612,204 |
| Events in quadrant D | 4,922,667 | 602,485 |
| Mode SS | |||
|---|---|---|---|
| Quadrant | BADHDUFLAG | Total packets | Discarded packets |
| A | 0 | 134 | 0 |
| B | 0 | 134 | 0 |
| C | 0 | 134 | 0 |
| D | 0 | 134 | 0 |
| Mode M0 | |||
|---|---|---|---|
| Quadrant | BADHDUFLAG | Total packets | Discarded packets |
| A | 0 | 13897 | 1 |
| B | 0 | 14309 | 1 |
| C | 0 | 13610 | 1 |
| D | 0 | 19163 | 1 |
| Mode M9 | |||
|---|---|---|---|
| Quadrant | BADHDUFLAG | Total packets | Discarded packets |
| A | 0 | 8 | 0 |
| B | 0 | 8 | 0 |
| C | 0 | 8 | 0 |
| D | 0 | 8 | 0 |
| Quadrant | Total seconds | Saturated seconds | Saturation percentage |
|---|---|---|---|
| A | 6566 | 85 | 1.294548% |
| B | 6566 | 98 | 1.492537% |
| C | 6566 | 85 | 1.294548% |
| D | 6566 | 138 | 2.101736% |
Noise dominated data is calculated using 1-second bins in cleaned event files. If a bin has >2000 counts, and if more than 50% of those come from <1% of pixels, then it is considered to be noise-dominated and hence unusable.
| Quadrant | # 1 sec bins | Bins with >0 counts | Bins with >2000 counts | High rate bins dominated by noise | Noise dominated (total time) | Noise dominated (detector-on time) | Marked lightcurve |
|---|---|---|---|---|---|---|---|
| A | 7401 | 6566 | 9 | 9 | 0.12% | 0.14% | 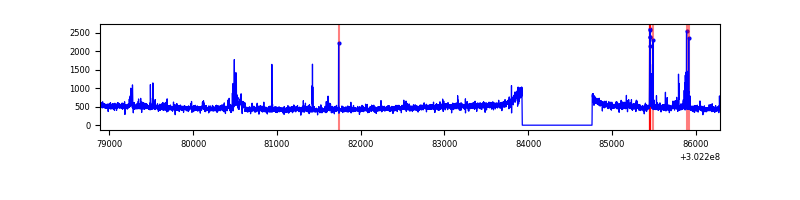 |
| B | 7401 | 6567 | 25 | 25 | 0.34% | 0.38% | 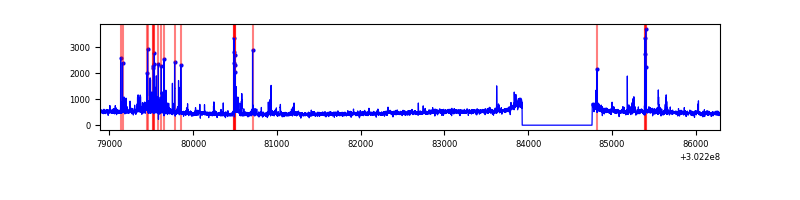 |
| C | 7401 | 6567 | 1 | 1 | 0.01% | 0.02% | 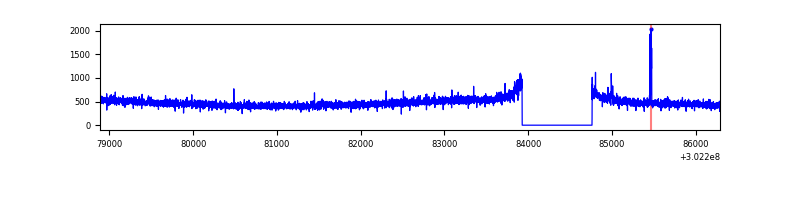 |
| D | 7401 | 6567 | 75 | 75 | 1.01% | 1.14% | 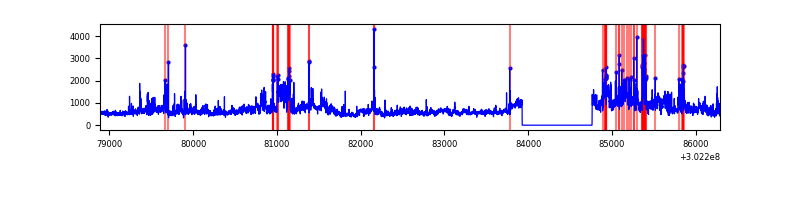 |
Top three noisy pixels from each quadrant. If the there are fewer than three noisy pixels in the level2.evt file, extra rows are filled as -1
| Pixel properties | Quadrant properties | ||||||
|---|---|---|---|---|---|---|---|
| Quadrant | DetID | PixID | Counts | Sigma | Mean | Median | Sigma |
| A | 5 | 16 | 157096 | 951.21 | 813 | 795 | 164.3 |
| A | 0 | 226 | 7152 | 38.69 | 813 | 795 | 164.3 |
| A | 3 | 137 | 6584 | 35.23 | 813 | 795 | 164.3 |
| B | 7 | 220 | 175739 | 1160.14 | 794 | 775 | 150.8 |
| B | 3 | 64 | 38169 | 247.95 | 794 | 775 | 150.8 |
| B | 0 | 197 | 21454 | 137.12 | 794 | 775 | 150.8 |
| C | 14 | 238 | 121707 | 680.23 | 762 | 766 | 177.8 |
| C | 7 | 247 | 33151 | 182.15 | 762 | 766 | 177.8 |
| C | 13 | 61 | 5322 | 25.63 | 762 | 766 | 177.8 |
| D | 12 | 227 | 941342 | 5015.75 | 779 | 758 | 187.5 |
| D | 1 | 52 | 682819 | 3637.15 | 779 | 758 | 187.5 |
| D | 1 | 20 | 198805 | 1056.1 | 779 | 758 | 187.5 |
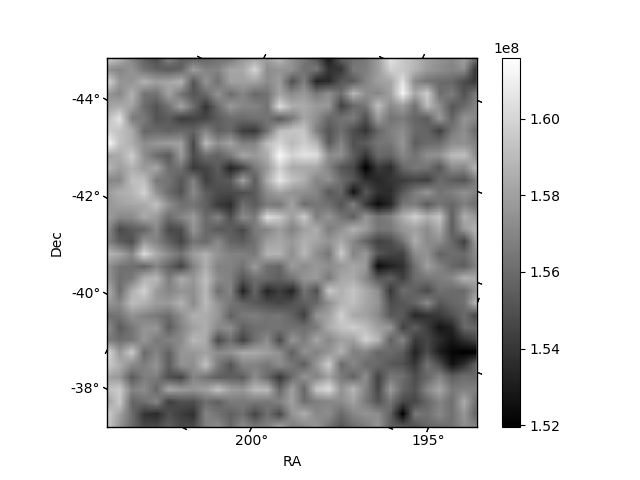
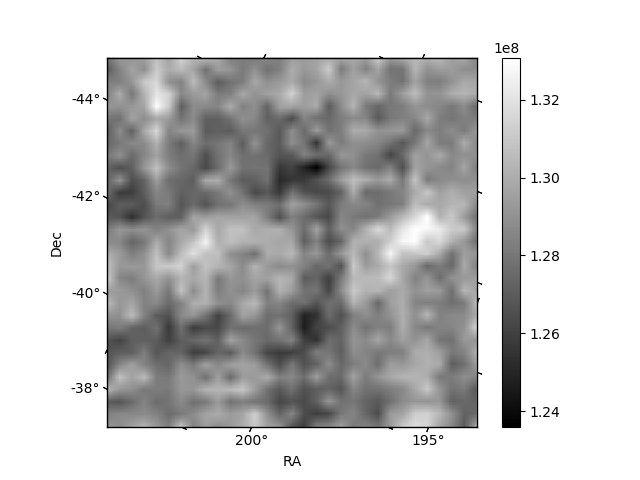
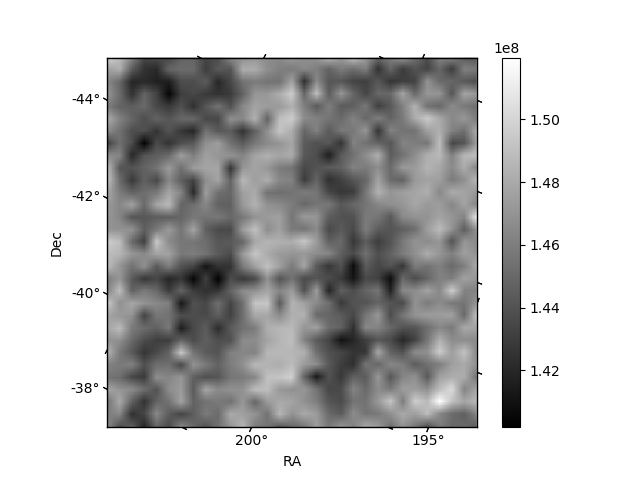
Histogram calculated using DETX and DETY for each event in the final _common_clean file
| Quadrant A | 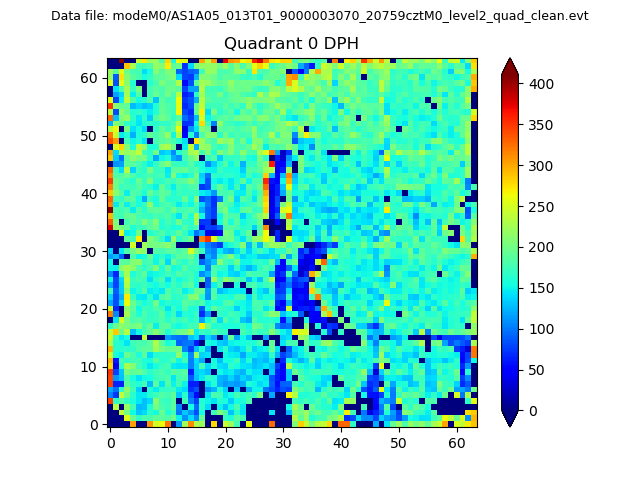 |
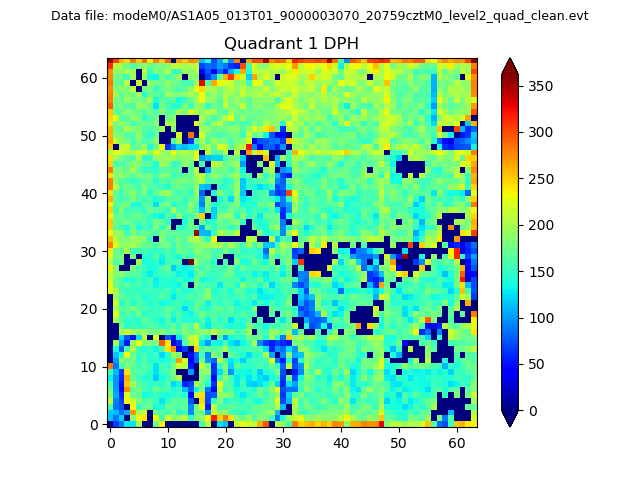 |
Quadrant B |
|---|---|---|---|
| Quadrant D | 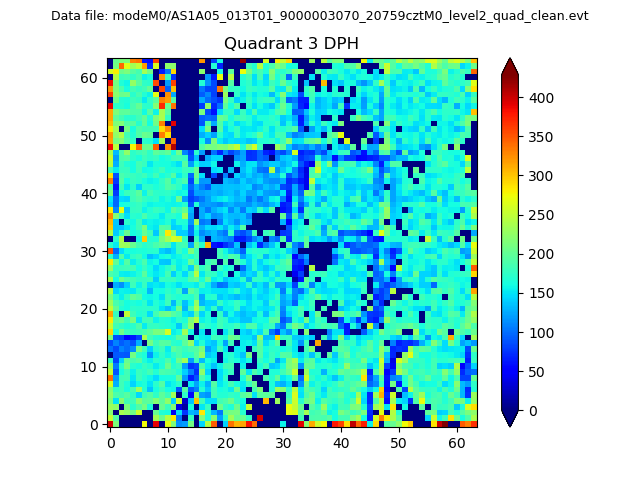 |
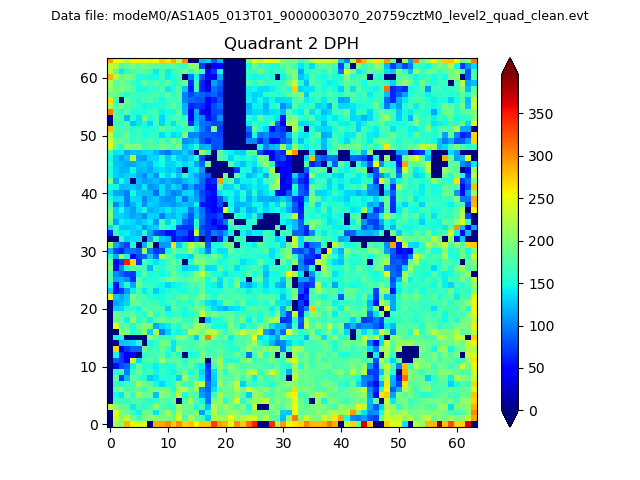 |
Quadrant C |
| Plot type | Count rate plots | Images |
|---|---|---|
| Comparison with Poisson distribution Blue bars denote a histogram of data divided into 1 sec bins. Red curve is a Poisson curve with rate = median count rate of data. |
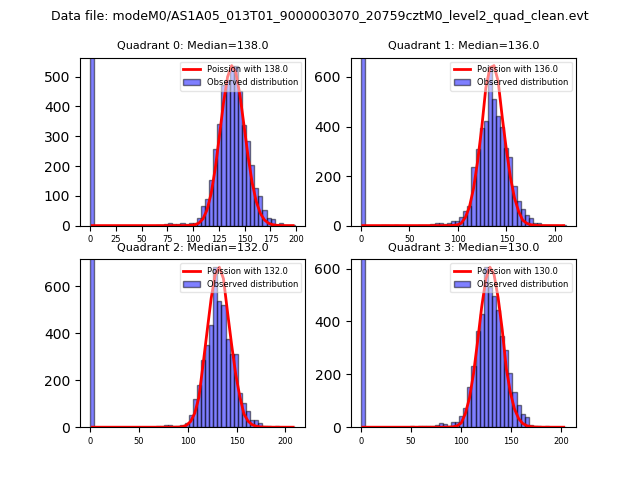 |
 |
| Quadrant-wise count rates Data is divided into 100 sec bins |
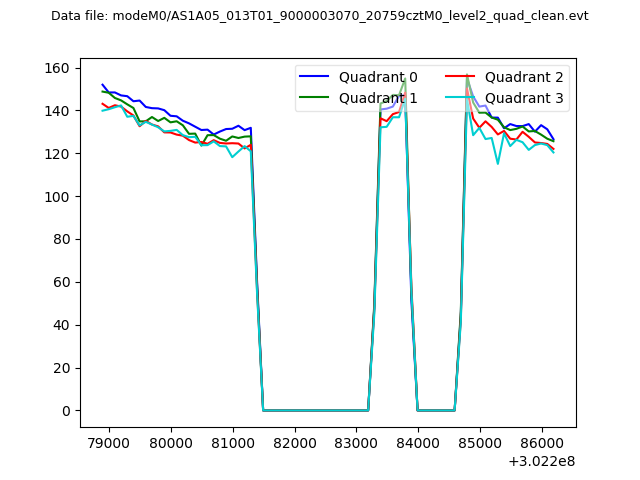 |
|
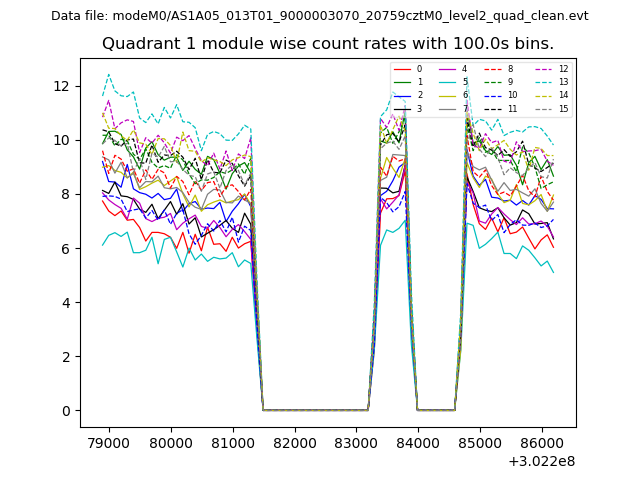
| Module-wise count rates for Quadrant A Data is divided into 100 sec bins |
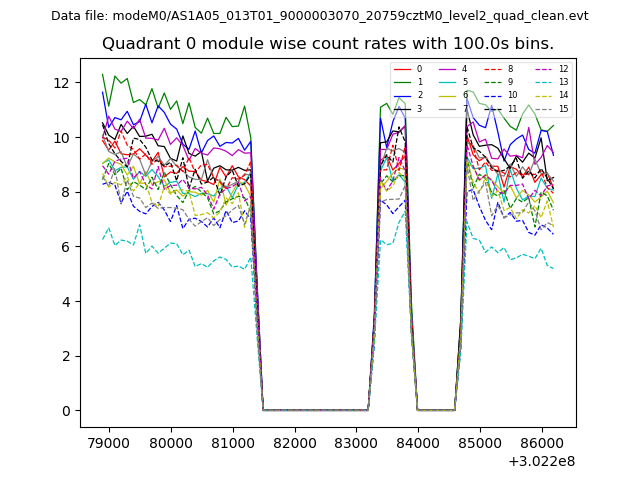 |
 |
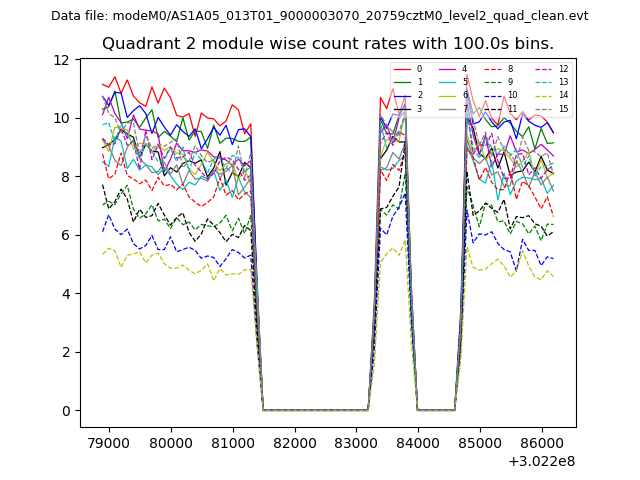
| Module-wise count rates for Quadrant B Data is divided into 100 sec bins |
 |
 |
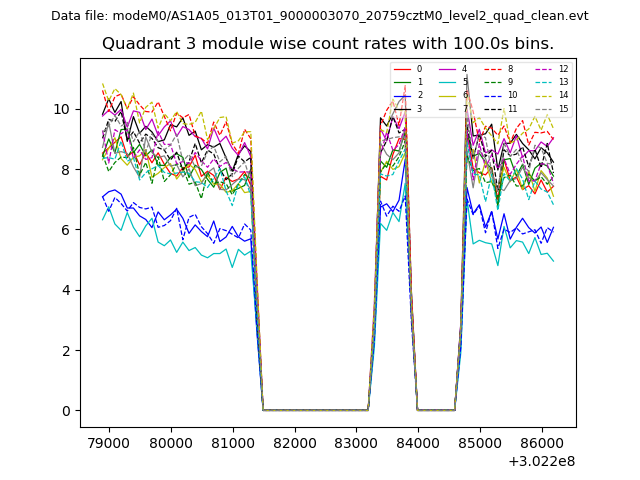
| Module-wise count rates for Quadrant C Data is divided into 100 sec bins |
 |
 |
| Module-wise count rates for Quadrant D Data is divided into 100 sec bins |
 |
 |
| Parameter | Plot |
|---|---|
| CZT HV Monitor | 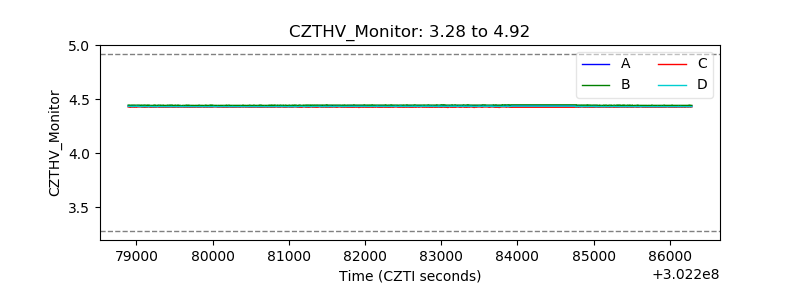 |
| D_VDD | 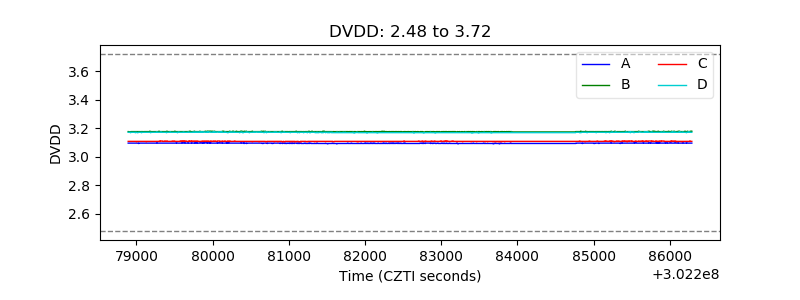 |
| Temperature 1 | 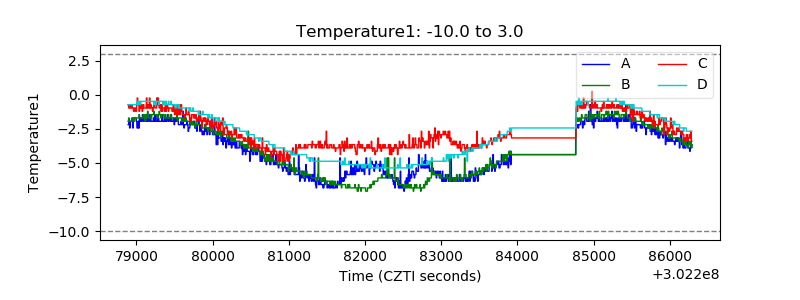 |
| Veto HV Monitor | 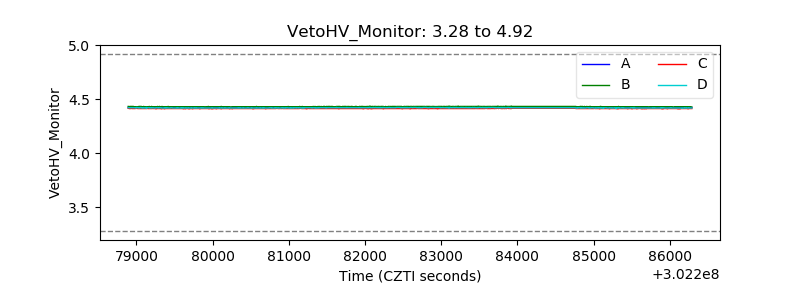 |
| Veto LLD | 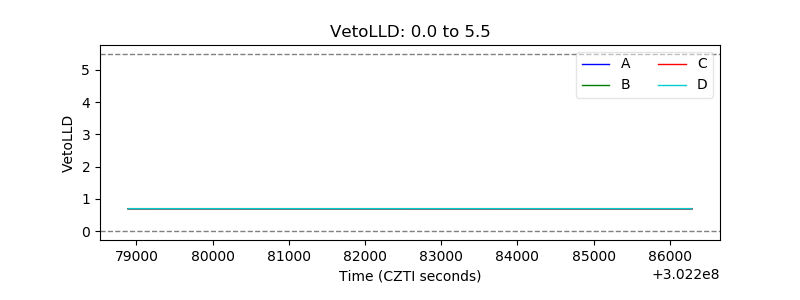 |
| Alpha Counter | 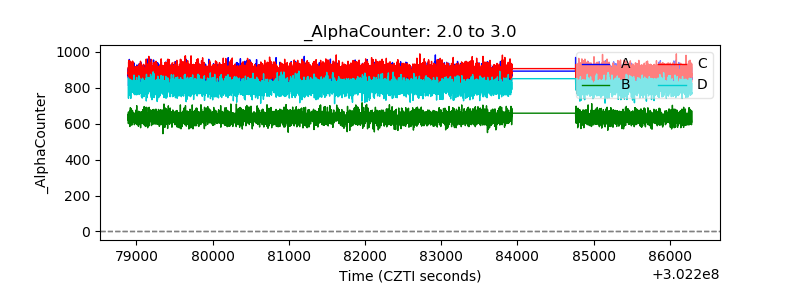 |
| _CPM_Rate | 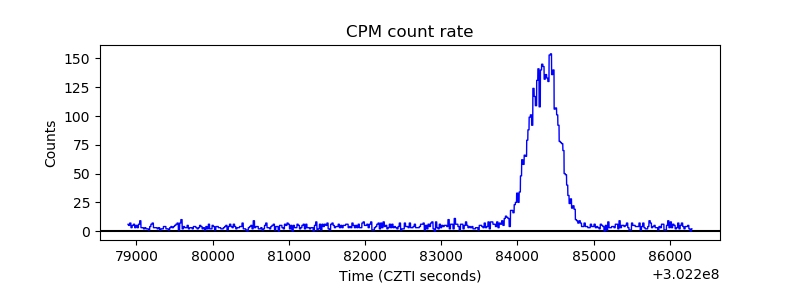 |
| CZT Counter | 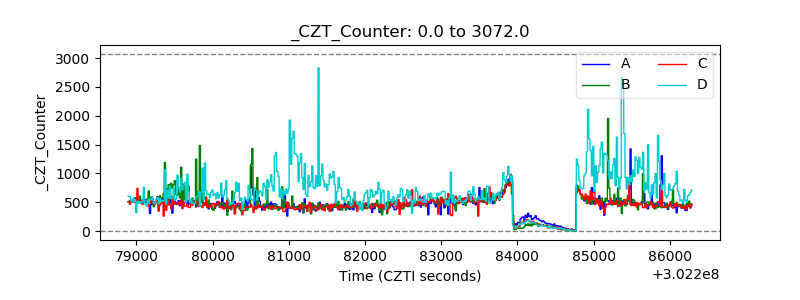 |
| +2.5 Volts monitor |  |
| +5 Volts monitor |  |
| _ROLL_ROT | 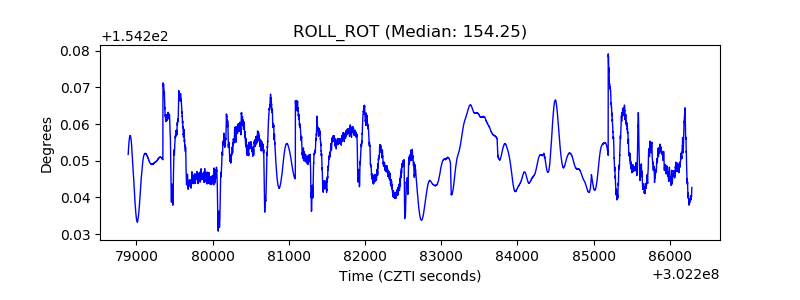 |
| _Roll_DEC | 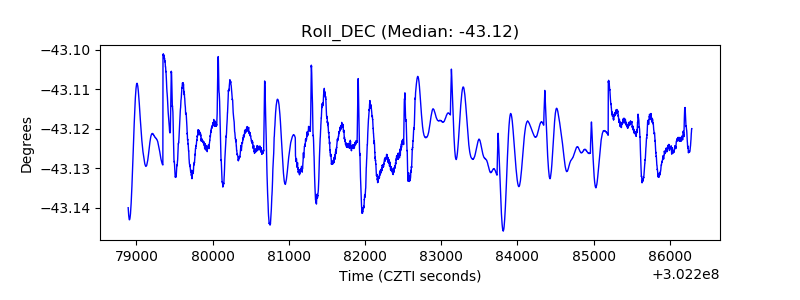 |
| _Roll_RA |  |
| Veto Counter | 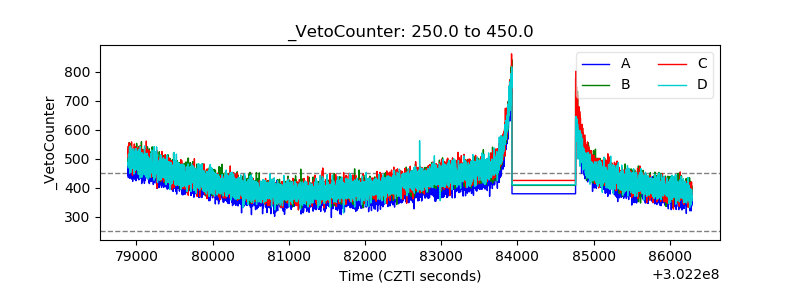 |