| Param | Original file | Final file |
|---|---|---|
| Filename | modeM0/AS1A05_013T01_9000003070_20760cztM0_level2.evt | modeM0/AS1A05_013T01_9000003070_20760cztM0_level2_quad_clean.evt |
| Size (bytes) | 553,098,240 | 98,317,440 |
| Size | 527.5 MB | 93.8 MB |
| Events in quadrant A | 3,248,578 | 648,015 |
| Events in quadrant B | 3,400,827 | 643,353 |
| Events in quadrant C | 3,270,159 | 621,903 |
| Events in quadrant D | 6,369,534 | 589,615 |
| Mode SS | |||
|---|---|---|---|
| Quadrant | BADHDUFLAG | Total packets | Discarded packets |
| A | 0 | 140 | 0 |
| B | 0 | 140 | 0 |
| C | 0 | 140 | 0 |
| D | 0 | 140 | 0 |
| Mode M0 | |||
|---|---|---|---|
| Quadrant | BADHDUFLAG | Total packets | Discarded packets |
| A | 0 | 14156 | 1 |
| B | 0 | 14563 | 1 |
| C | 0 | 14265 | 2 |
| D | 0 | 23723 | 3 |
| Mode M9 | |||
|---|---|---|---|
| Quadrant | BADHDUFLAG | Total packets | Discarded packets |
| A | 0 | 4 | 0 |
| B | 0 | 4 | 0 |
| C | 0 | 4 | 0 |
| D | 0 | 4 | 0 |
| Quadrant | Total seconds | Saturated seconds | Saturation percentage |
|---|---|---|---|
| A | 6802 | 40 | 0.588062% |
| B | 6802 | 57 | 0.837989% |
| C | 6801 | 52 | 0.764593% |
| D | 6800 | 610 | 8.970588% |
Noise dominated data is calculated using 1-second bins in cleaned event files. If a bin has >2000 counts, and if more than 50% of those come from <1% of pixels, then it is considered to be noise-dominated and hence unusable.
| Quadrant | # 1 sec bins | Bins with >0 counts | Bins with >2000 counts | High rate bins dominated by noise | Noise dominated (total time) | Noise dominated (detector-on time) | Marked lightcurve |
|---|---|---|---|---|---|---|---|
| A | 7257 | 6804 | 8 | 8 | 0.11% | 0.12% | 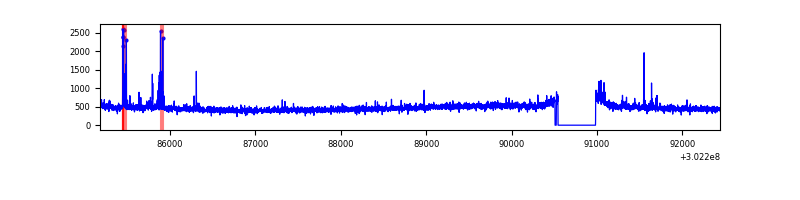 |
| B | 7257 | 6803 | 19 | 19 | 0.26% | 0.28% | 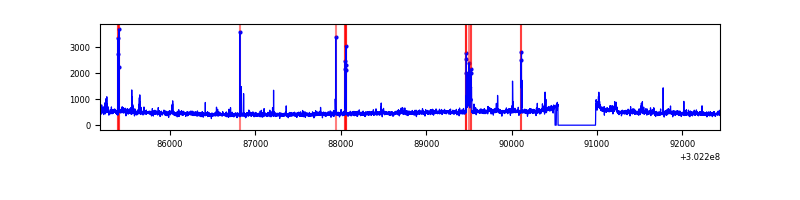 |
| C | 7256 | 6803 | 2 | 2 | 0.03% | 0.03% | 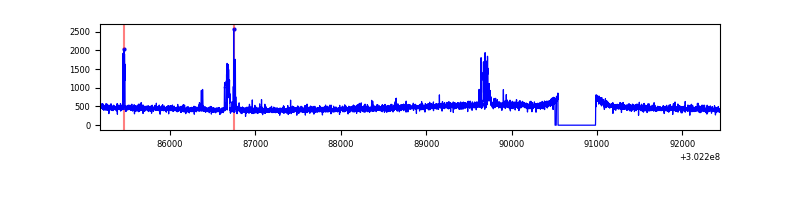 |
| D | 7256 | 6803 | 459 | 459 | 6.33% | 6.75% | 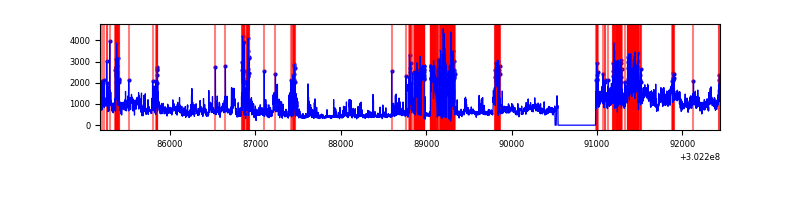 |
Top three noisy pixels from each quadrant. If the there are fewer than three noisy pixels in the level2.evt file, extra rows are filled as -1
| Pixel properties | Quadrant properties | ||||||
|---|---|---|---|---|---|---|---|
| Quadrant | DetID | PixID | Counts | Sigma | Mean | Median | Sigma |
| A | 5 | 16 | 97455 | 589.49 | 819 | 804 | 164.0 |
| A | 0 | 226 | 6893 | 37.14 | 819 | 804 | 164.0 |
| A | 3 | 137 | 6724 | 36.11 | 819 | 804 | 164.0 |
| B | 3 | 64 | 138141 | 892.09 | 806 | 785 | 154.0 |
| B | 0 | 197 | 27040 | 170.52 | 806 | 785 | 154.0 |
| B | 0 | 190 | 22154 | 138.79 | 806 | 785 | 154.0 |
| C | 7 | 247 | 135570 | 747.25 | 770 | 774 | 180.4 |
| C | 14 | 238 | 121145 | 667.29 | 770 | 774 | 180.4 |
| C | 7 | 220 | 6736 | 33.05 | 770 | 774 | 180.4 |
| D | 5 | 222 | 1310981 | 7247.06 | 752 | 732 | 180.8 |
| D | 1 | 52 | 759177 | 4195.0 | 752 | 732 | 180.8 |
| D | 12 | 227 | 678783 | 3750.34 | 752 | 732 | 180.8 |
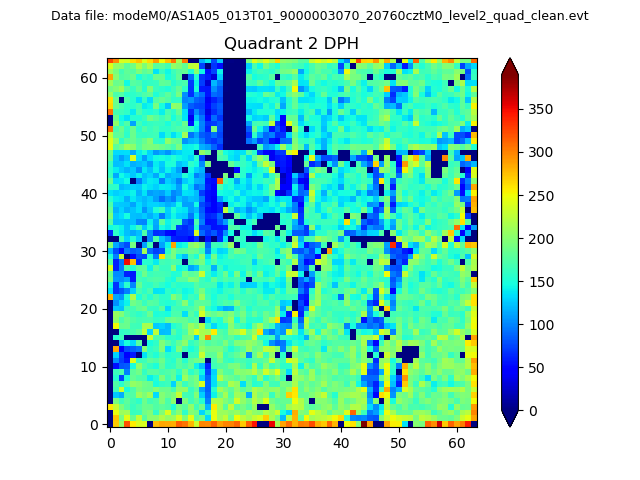
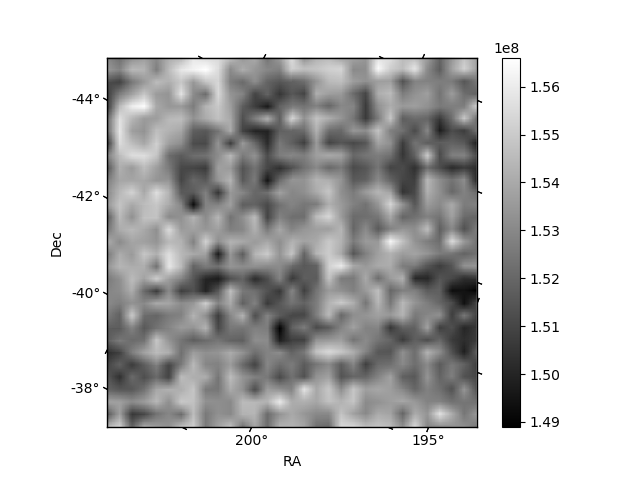
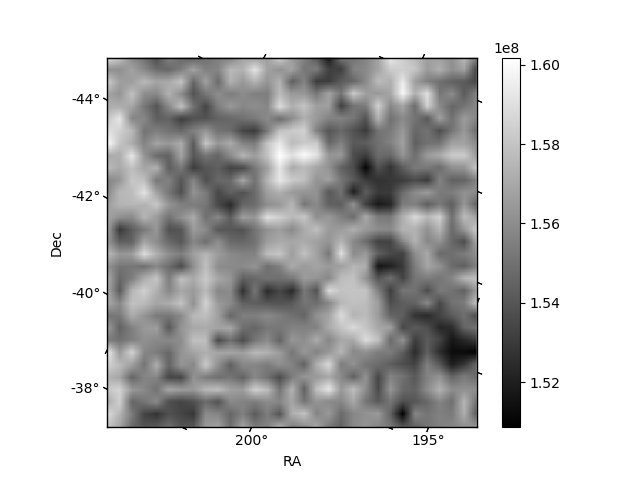
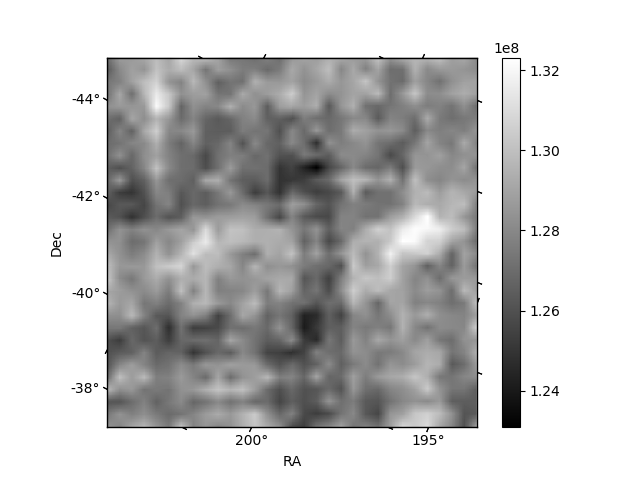
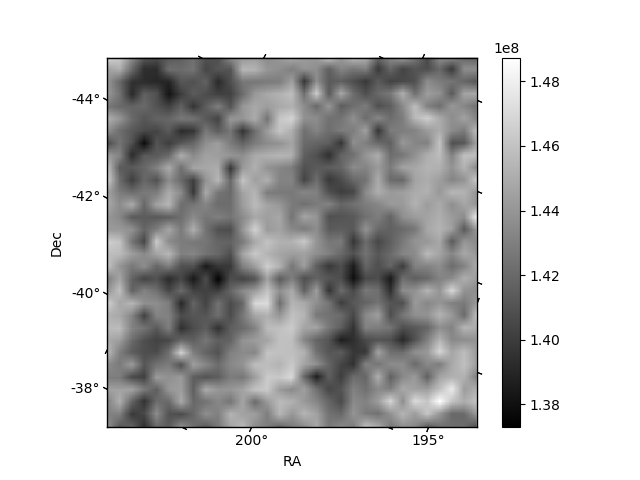
Histogram calculated using DETX and DETY for each event in the final _common_clean file
| Quadrant A | 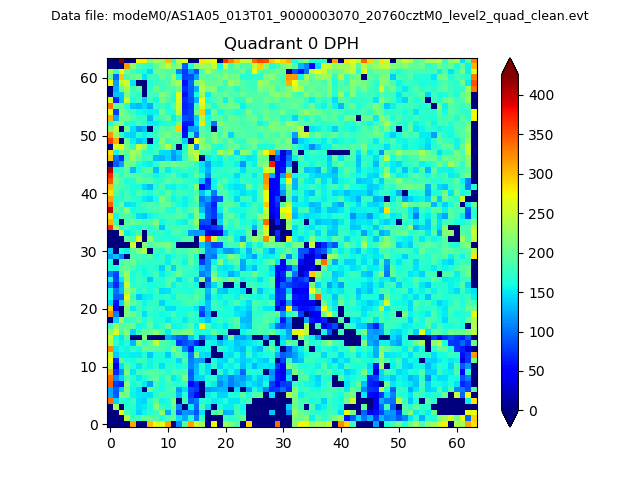 |
 |
Quadrant B |
|---|---|---|---|
| Quadrant D |  |
 |
Quadrant C |
| Plot type | Count rate plots | Images |
|---|---|---|
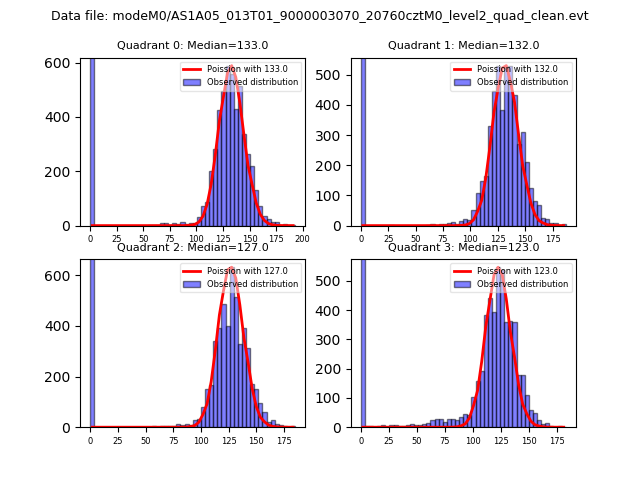
| Comparison with Poisson distribution Blue bars denote a histogram of data divided into 1 sec bins. Red curve is a Poisson curve with rate = median count rate of data. |
 |
 |
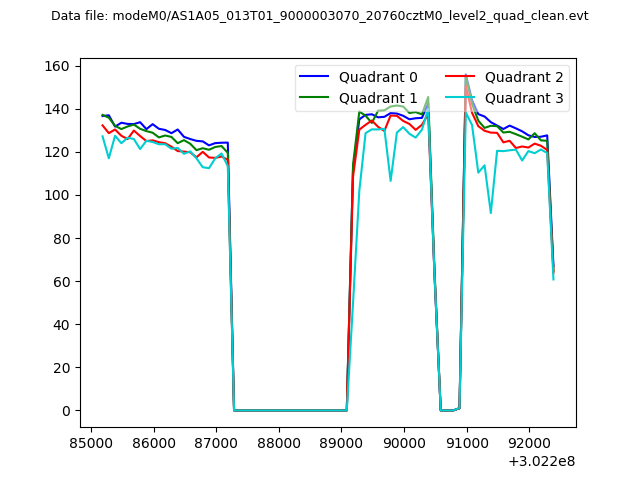
| Quadrant-wise count rates Data is divided into 100 sec bins |
 |
|
| Module-wise count rates for Quadrant A Data is divided into 100 sec bins |
 |
 |
| Module-wise count rates for Quadrant B Data is divided into 100 sec bins |
 |
 |
| Module-wise count rates for Quadrant C Data is divided into 100 sec bins |
 |
 |
| Module-wise count rates for Quadrant D Data is divided into 100 sec bins |
 |
 |
| Parameter | Plot |
|---|---|
| CZT HV Monitor |  |
| D_VDD | 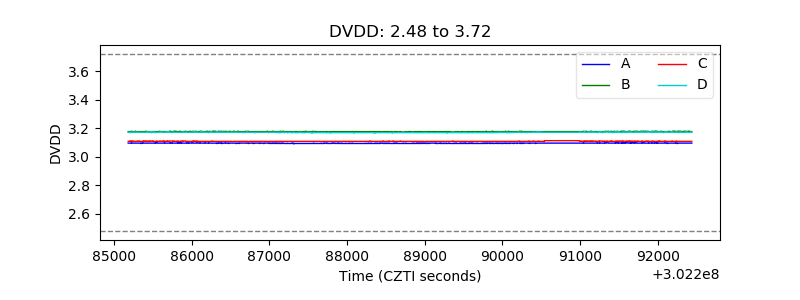 |
| Temperature 1 | 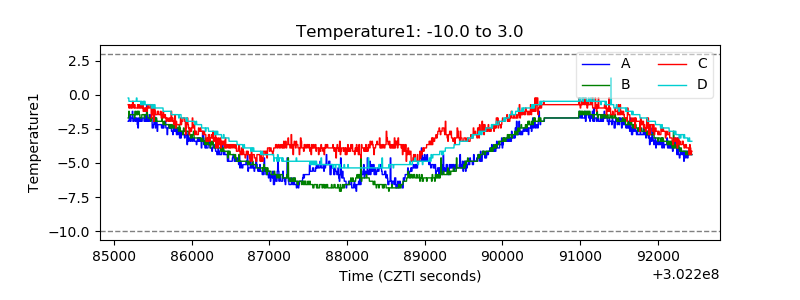 |
| Veto HV Monitor | 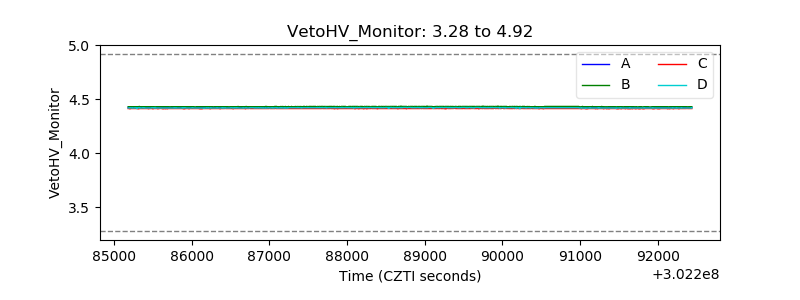 |
| Veto LLD | 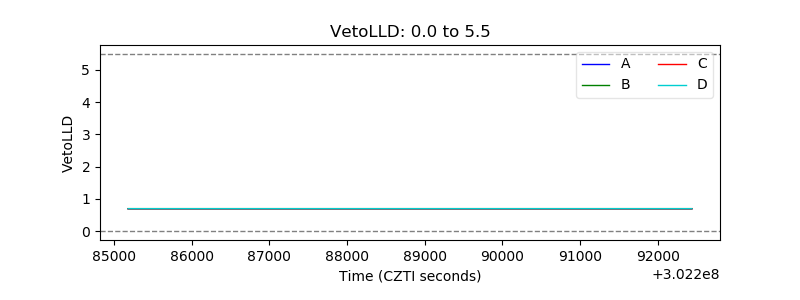 |
| Alpha Counter | 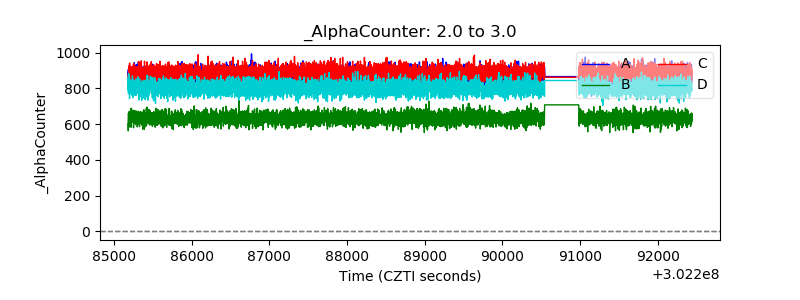 |
| _CPM_Rate | 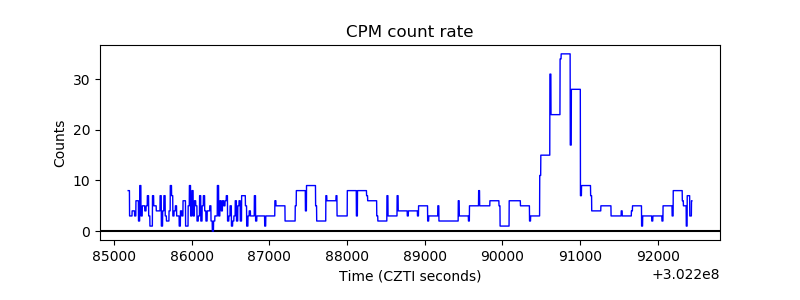 |
| CZT Counter | 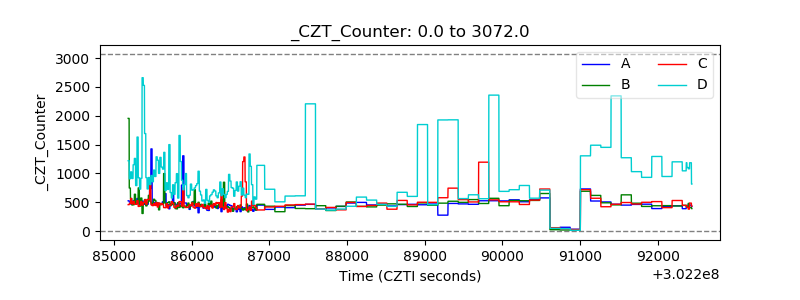 |
| +2.5 Volts monitor |  |
| +5 Volts monitor | 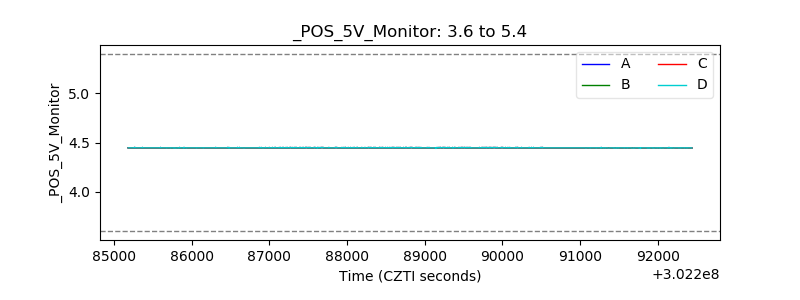 |
| _ROLL_ROT | 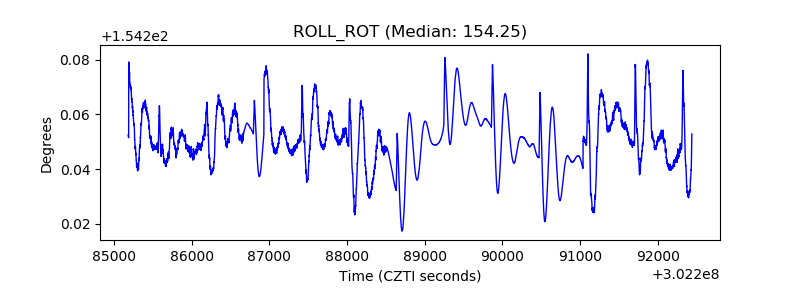 |
| _Roll_DEC | 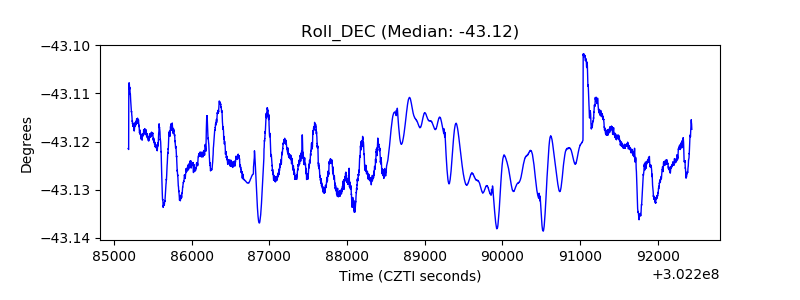 |
| _Roll_RA | 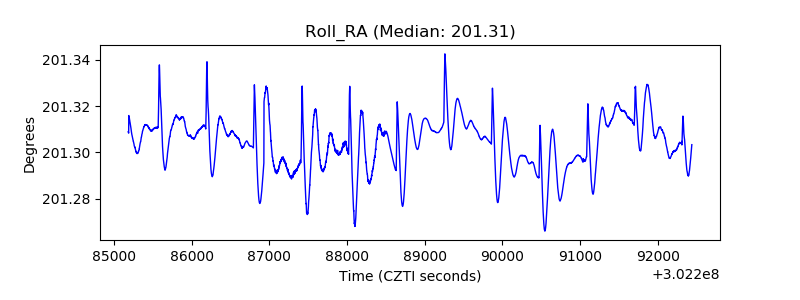 |
| Veto Counter | 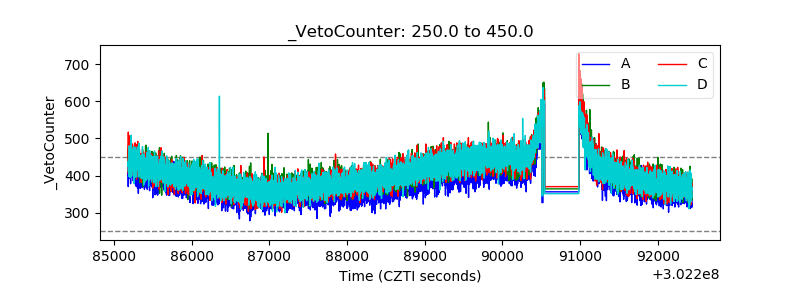 |