| Param | Original file | Final file |
|---|---|---|
| Filename | modeM0/AS1A05_013T01_9000003070_20764cztM0_level2.evt | modeM0/AS1A05_013T01_9000003070_20764cztM0_level2_quad_clean.evt |
| Size (bytes) | 1,008,414,720 | 157,780,800 |
| Size | 961.7 MB | 150.5 MB |
| Events in quadrant A | 5,985,586 | 1,018,205 |
| Events in quadrant B | 6,359,915 | 1,012,696 |
| Events in quadrant C | 6,091,175 | 977,899 |
| Events in quadrant D | 11,242,630 | 889,102 |
| Mode SS | |||
|---|---|---|---|
| Quadrant | BADHDUFLAG | Total packets | Discarded packets |
| A | 0 | 260 | 0 |
| B | 0 | 260 | 0 |
| C | 0 | 260 | 0 |
| D | 0 | 260 | 0 |
| Mode M0 | |||
|---|---|---|---|
| Quadrant | BADHDUFLAG | Total packets | Discarded packets |
| A | 0 | 26366 | 4 |
| B | 0 | 27356 | 4 |
| C | 0 | 26615 | 4 |
| D | 0 | 42304 | 4 |
| Mode M9 | |||
|---|---|---|---|
| Quadrant | BADHDUFLAG | Total packets | Discarded packets |
| A | 0 | 15 | 0 |
| B | 0 | 16 | 0 |
| C | 0 | 16 | 0 |
| D | 0 | 16 | 0 |
| Quadrant | Total seconds | Saturated seconds | Saturation percentage |
|---|---|---|---|
| A | 12735 | 126 | 0.989399% |
| B | 12735 | 131 | 1.028661% |
| C | 12735 | 184 | 1.444837% |
| D | 12735 | 1219 | 9.572046% |
Noise dominated data is calculated using 1-second bins in cleaned event files. If a bin has >2000 counts, and if more than 50% of those come from <1% of pixels, then it is considered to be noise-dominated and hence unusable.
| Quadrant | # 1 sec bins | Bins with >0 counts | Bins with >2000 counts | High rate bins dominated by noise | Noise dominated (total time) | Noise dominated (detector-on time) | Marked lightcurve |
|---|---|---|---|---|---|---|---|
| A | 14005 | 12737 | 27 | 27 | 0.19% | 0.21% | 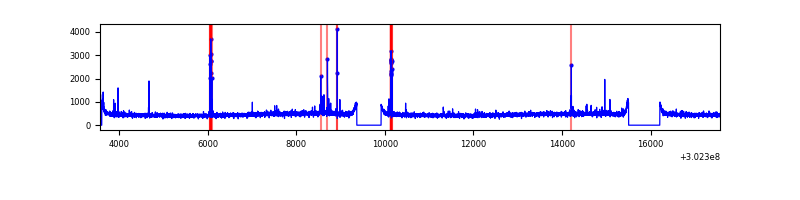 |
| B | 14005 | 12737 | 11 | 11 | 0.08% | 0.09% | 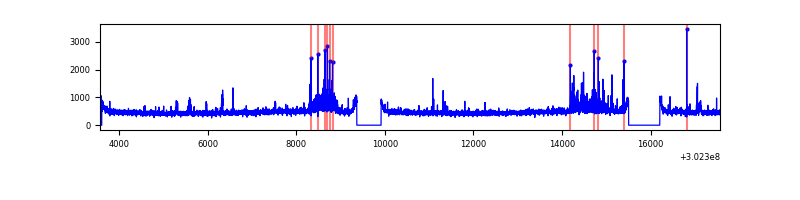 |
| C | 14005 | 12737 | 29 | 29 | 0.21% | 0.23% | 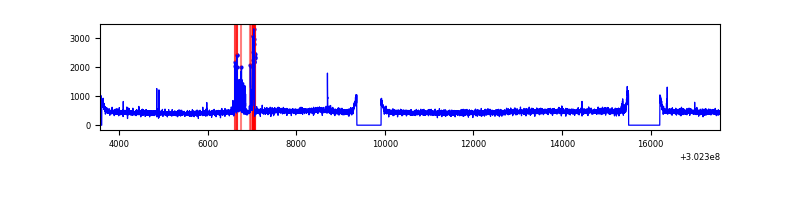 |
| D | 14005 | 12737 | 1063 | 1063 | 7.59% | 8.35% | 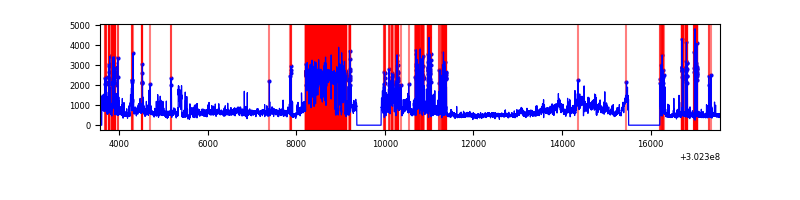 |
Top three noisy pixels from each quadrant. If the there are fewer than three noisy pixels in the level2.evt file, extra rows are filled as -1
| Pixel properties | Quadrant properties | ||||||
|---|---|---|---|---|---|---|---|
| Quadrant | DetID | PixID | Counts | Sigma | Mean | Median | Sigma |
| A | 5 | 16 | 156026 | 508.76 | 1517 | 1483 | 303.8 |
| A | 0 | 226 | 12995 | 37.9 | 1517 | 1483 | 303.8 |
| A | 3 | 137 | 12490 | 36.23 | 1517 | 1483 | 303.8 |
| B | 7 | 220 | 225147 | 780.69 | 1506 | 1470 | 286.5 |
| B | 0 | 230 | 83316 | 285.66 | 1506 | 1470 | 286.5 |
| B | 0 | 229 | 45353 | 153.16 | 1506 | 1470 | 286.5 |
| C | 9 | 54 | 250504 | 742.91 | 1437 | 1446 | 335.2 |
| C | 14 | 238 | 225687 | 668.88 | 1437 | 1446 | 335.2 |
| C | 13 | 61 | 10121 | 25.88 | 1437 | 1446 | 335.2 |
| D | 5 | 222 | 2436465 | 7231.34 | 1389 | 1346 | 336.7 |
| D | 1 | 20 | 2380729 | 7065.83 | 1389 | 1346 | 336.7 |
| D | 1 | 52 | 863746 | 2560.99 | 1389 | 1346 | 336.7 |
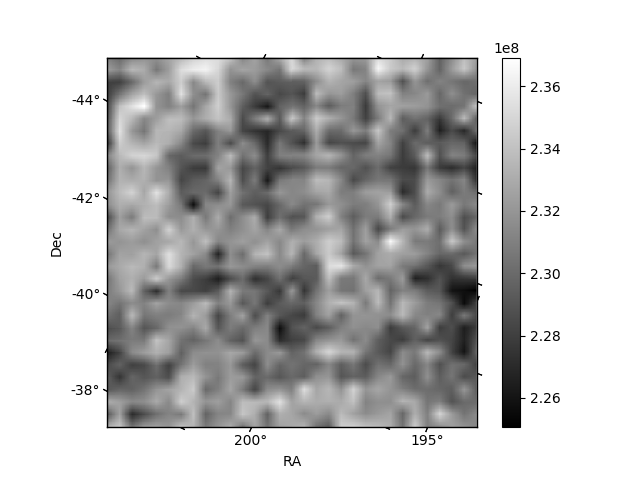
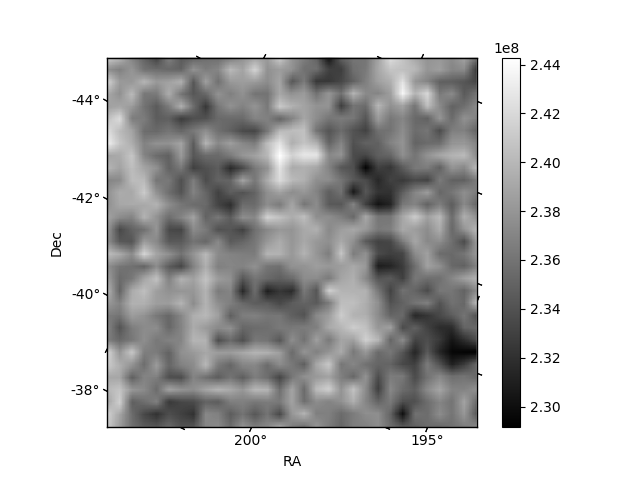
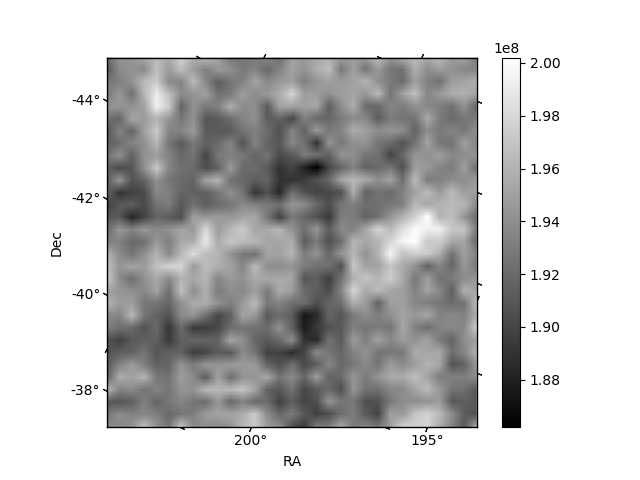
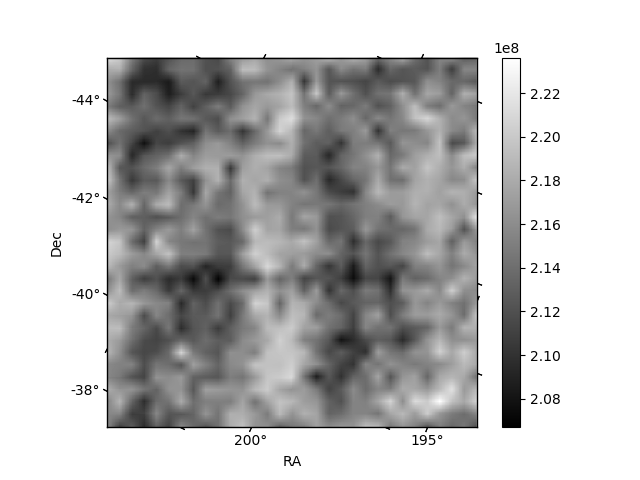
Histogram calculated using DETX and DETY for each event in the final _common_clean file
| Quadrant A | 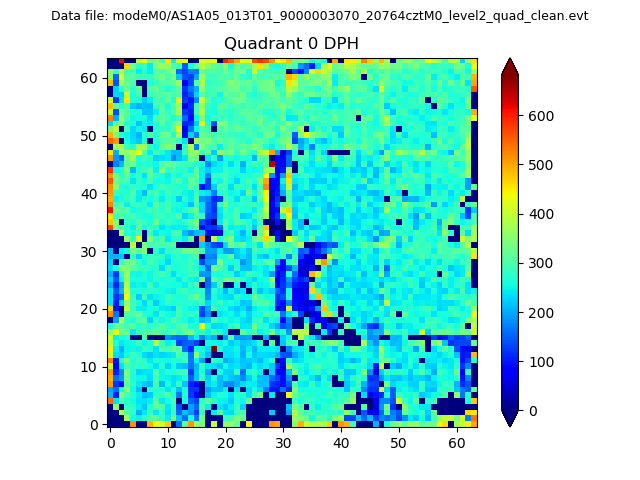 |
 |
Quadrant B |
|---|---|---|---|
| Quadrant D |  |
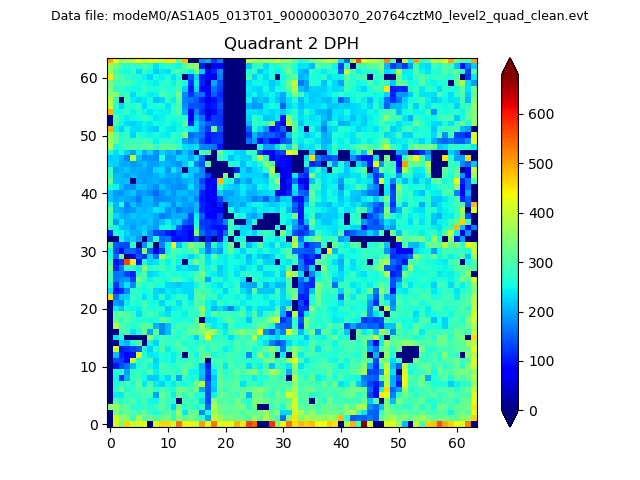 |
Quadrant C |
| Plot type | Count rate plots | Images |
|---|---|---|
| Comparison with Poisson distribution Blue bars denote a histogram of data divided into 1 sec bins. Red curve is a Poisson curve with rate = median count rate of data. |
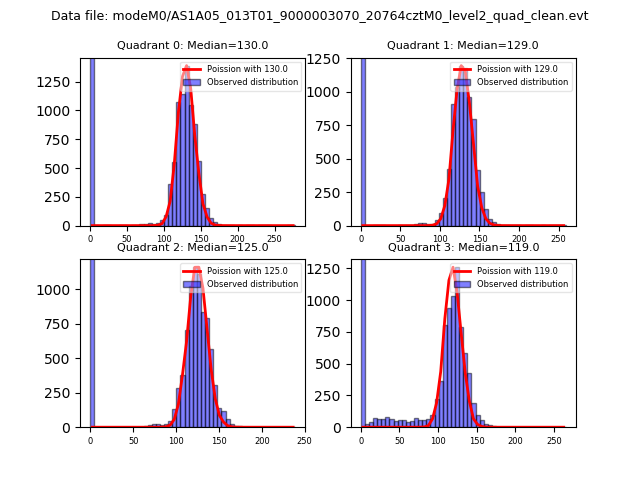 |
 |
| Quadrant-wise count rates Data is divided into 100 sec bins |
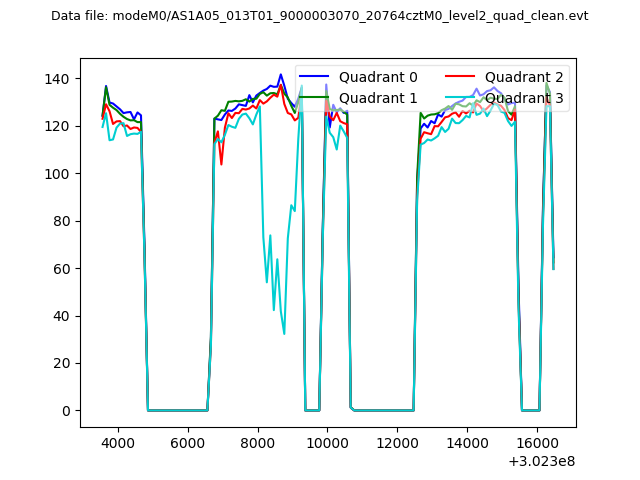 |
|
| Module-wise count rates for Quadrant A Data is divided into 100 sec bins |
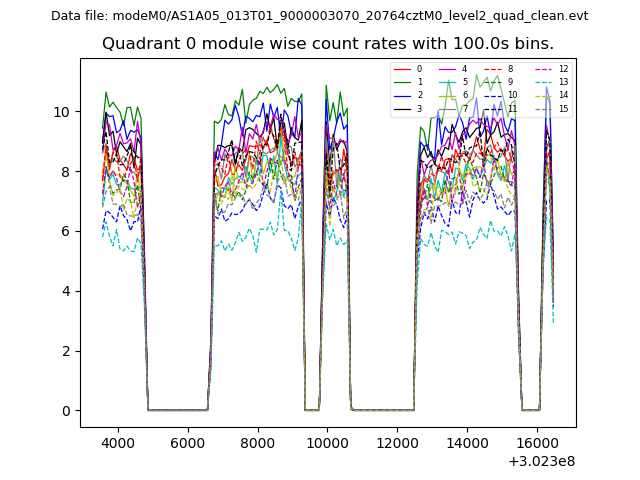 |
 |
| Module-wise count rates for Quadrant B Data is divided into 100 sec bins |
 |
 |
| Module-wise count rates for Quadrant C Data is divided into 100 sec bins |
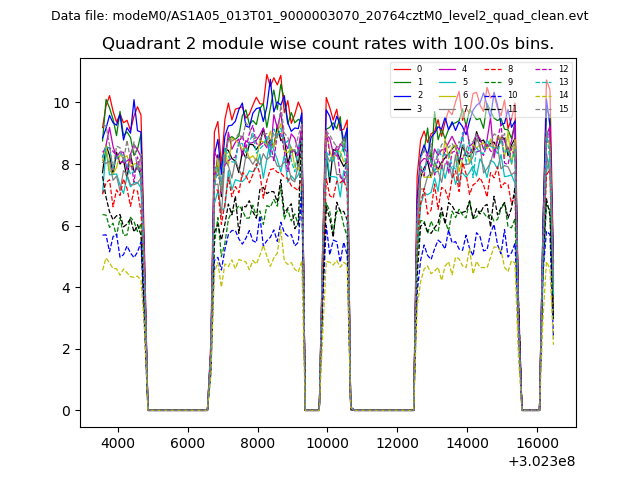 |
 |
| Module-wise count rates for Quadrant D Data is divided into 100 sec bins |
 |
 |
| Parameter | Plot |
|---|---|
| CZT HV Monitor | 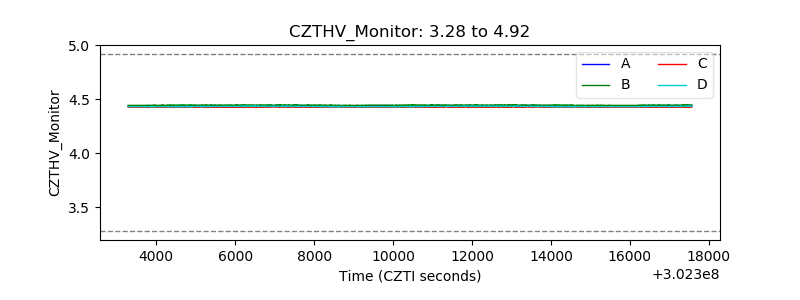 |
| D_VDD | 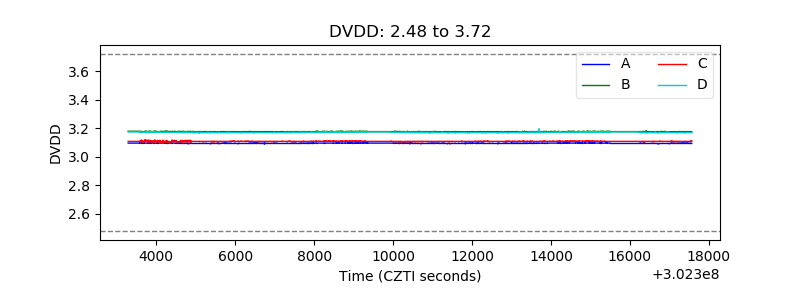 |
| Temperature 1 | 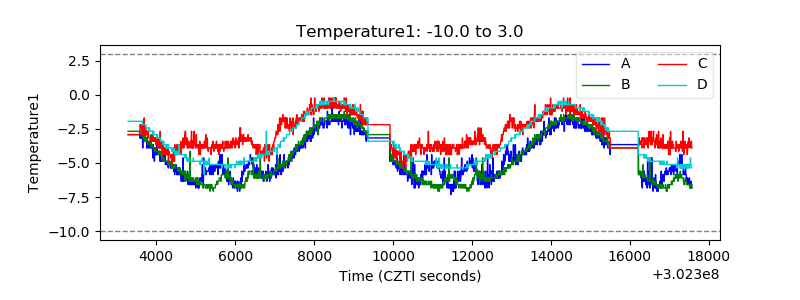 |
| Veto HV Monitor | 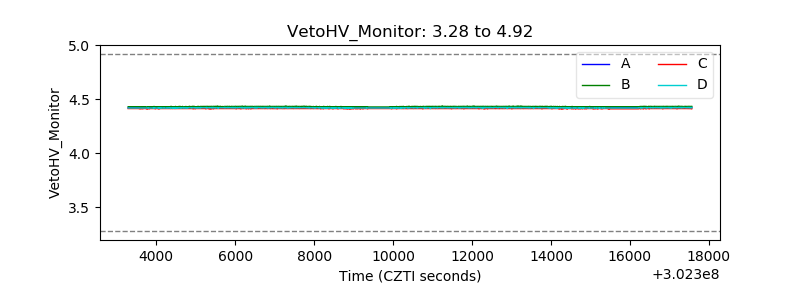 |
| Veto LLD | 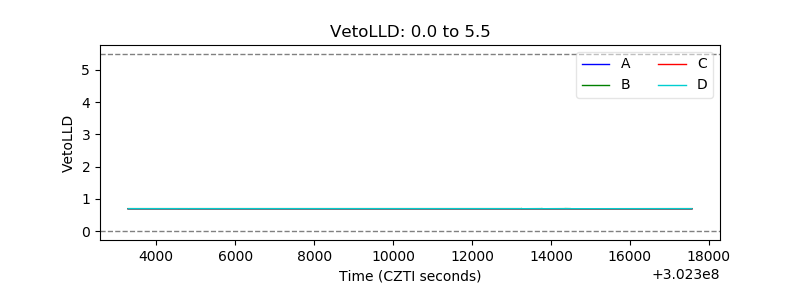 |
| Alpha Counter | 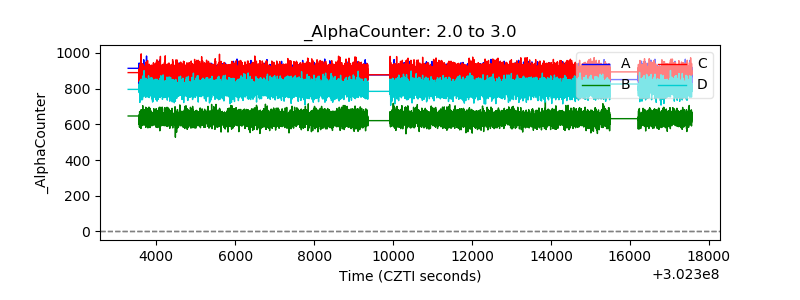 |
| _CPM_Rate | 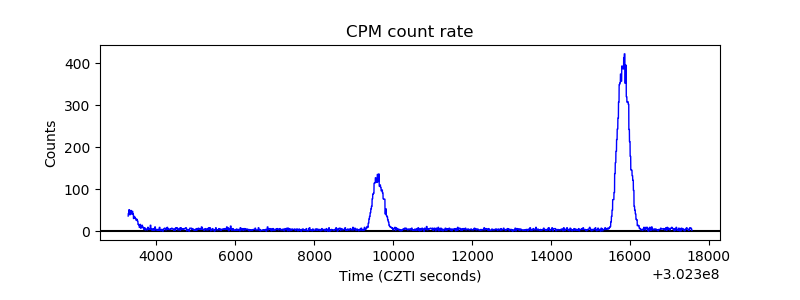 |
| CZT Counter | 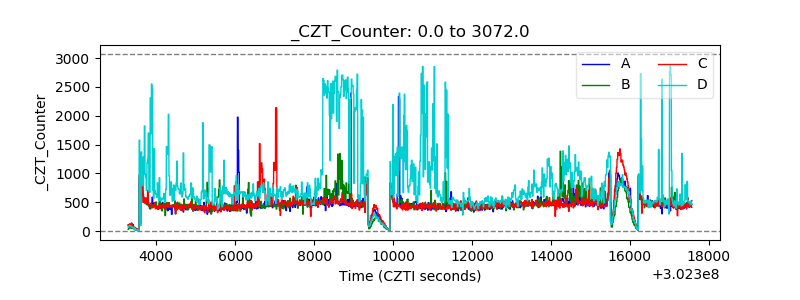 |
| +2.5 Volts monitor |  |
| +5 Volts monitor |  |
| _ROLL_ROT | 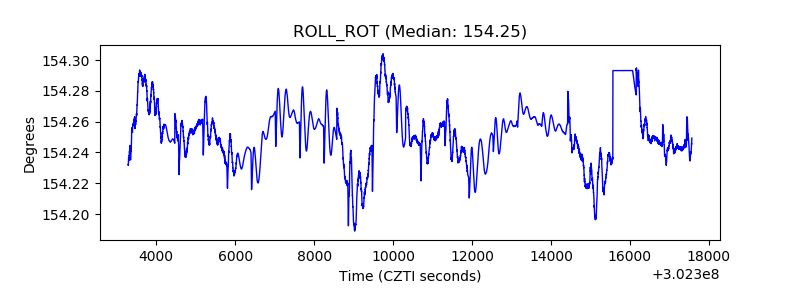 |
| _Roll_DEC | 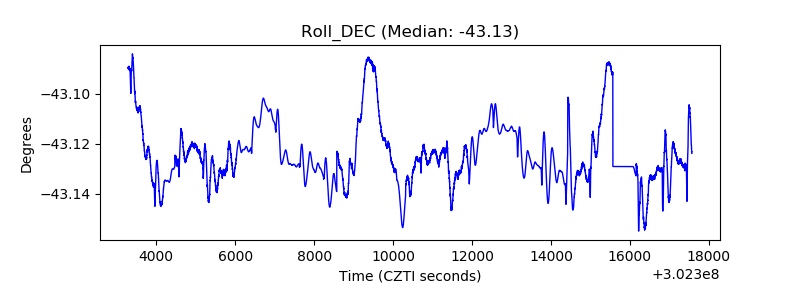 |
| _Roll_RA | 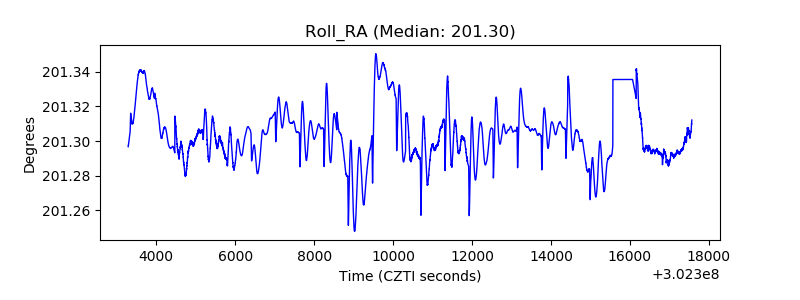 |
| Veto Counter | 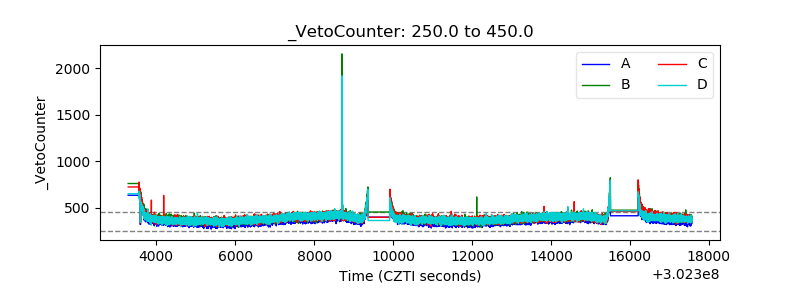 |