| Param | Original file | Final file |
|---|---|---|
| Filename | modeM0/AS1A05_013T01_9000003070_20768cztM0_level2.evt | modeM0/AS1A05_013T01_9000003070_20768cztM0_level2_quad_clean.evt |
| Size (bytes) | 498,144,960 | 88,787,520 |
| Size | 475.1 MB | 84.7 MB |
| Events in quadrant A | 3,144,522 | 582,574 |
| Events in quadrant B | 3,224,319 | 581,940 |
| Events in quadrant C | 3,181,699 | 565,382 |
| Events in quadrant D | 5,110,459 | 521,058 |
| Mode SS | |||
|---|---|---|---|
| Quadrant | BADHDUFLAG | Total packets | Discarded packets |
| A | 0 | 128 | 0 |
| B | 0 | 128 | 0 |
| C | 0 | 128 | 0 |
| D | 0 | 128 | 0 |
| Mode M0 | |||
|---|---|---|---|
| Quadrant | BADHDUFLAG | Total packets | Discarded packets |
| A | 0 | 13218 | 1 |
| B | 0 | 13437 | 2 |
| C | 0 | 13457 | 1 |
| D | 0 | 19284 | 1 |
| Mode M9 | |||
|---|---|---|---|
| Quadrant | BADHDUFLAG | Total packets | Discarded packets |
| A | 0 | 11 | 0 |
| B | 0 | 11 | 0 |
| C | 0 | 11 | 0 |
| D | 0 | 11 | 0 |
| Quadrant | Total seconds | Saturated seconds | Saturation percentage |
|---|---|---|---|
| A | 6267 | 34 | 0.542524% |
| B | 6267 | 54 | 0.861656% |
| C | 6267 | 94 | 1.499920% |
| D | 6267 | 443 | 7.068773% |
Noise dominated data is calculated using 1-second bins in cleaned event files. If a bin has >2000 counts, and if more than 50% of those come from <1% of pixels, then it is considered to be noise-dominated and hence unusable.
| Quadrant | # 1 sec bins | Bins with >0 counts | Bins with >2000 counts | High rate bins dominated by noise | Noise dominated (total time) | Noise dominated (detector-on time) | Marked lightcurve |
|---|---|---|---|---|---|---|---|
| A | 7437 | 6268 | 0 | 0 | 0.00% | 0.00% | 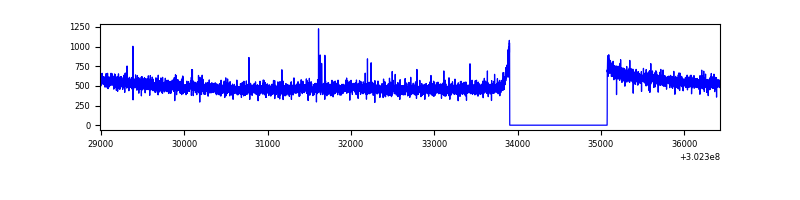 |
| B | 7437 | 6267 | 3 | 3 | 0.04% | 0.05% | 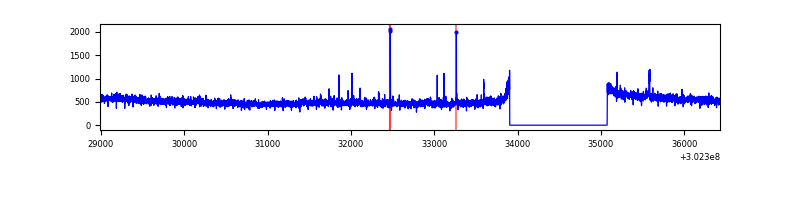 |
| C | 7437 | 6268 | 0 | 0 | 0.00% | 0.00% | 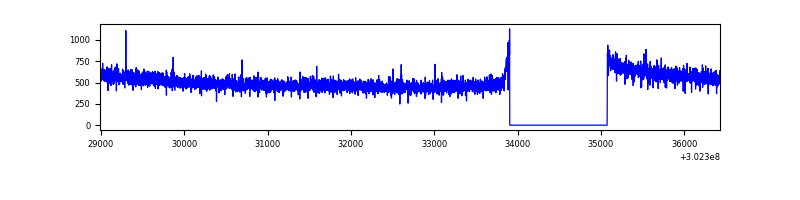 |
| D | 7437 | 6267 | 286 | 286 | 3.85% | 4.56% | 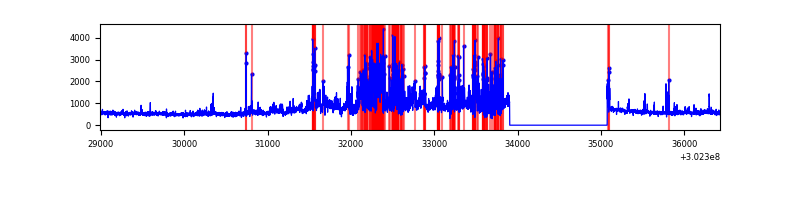 |
Top three noisy pixels from each quadrant. If the there are fewer than three noisy pixels in the level2.evt file, extra rows are filled as -1
| Pixel properties | Quadrant properties | ||||||
|---|---|---|---|---|---|---|---|
| Quadrant | DetID | PixID | Counts | Sigma | Mean | Median | Sigma |
| A | 5 | 16 | 7888 | 43.89 | 816 | 801 | 161.5 |
| A | 0 | 226 | 7237 | 39.86 | 816 | 801 | 161.5 |
| A | 3 | 137 | 6291 | 34.0 | 816 | 801 | 161.5 |
| B | 12 | 111 | 17710 | 112.73 | 805 | 787 | 150.1 |
| B | 0 | 189 | 15979 | 101.2 | 805 | 787 | 150.1 |
| B | 11 | 111 | 15401 | 97.35 | 805 | 787 | 150.1 |
| C | 14 | 238 | 127254 | 699.36 | 783 | 789 | 180.8 |
| C | 13 | 61 | 5466 | 25.86 | 783 | 789 | 180.8 |
| C | 14 | 111 | 1928 | 6.3 | 783 | 789 | 180.8 |
| D | 1 | 52 | 1261842 | 6935.56 | 768 | 749 | 181.8 |
| D | 1 | 20 | 839315 | 4611.81 | 768 | 749 | 181.8 |
| D | 7 | 238 | 63010 | 342.41 | 768 | 749 | 181.8 |
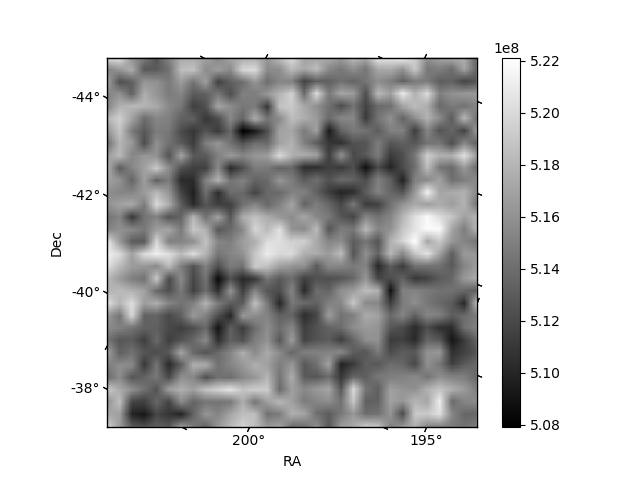
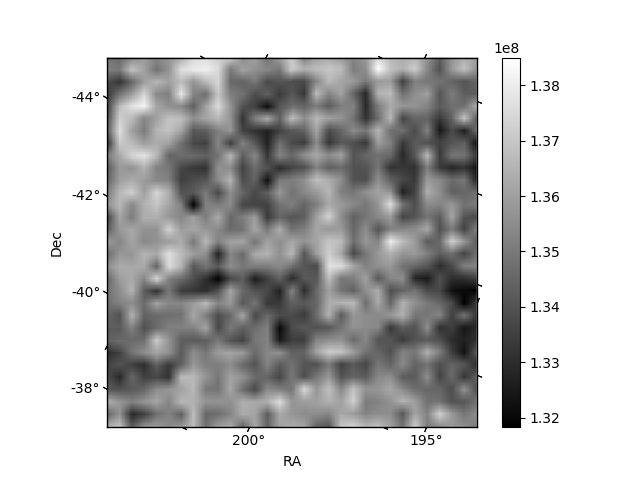
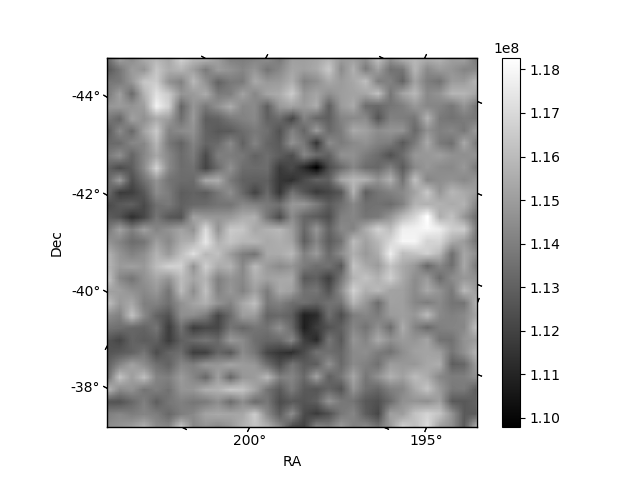
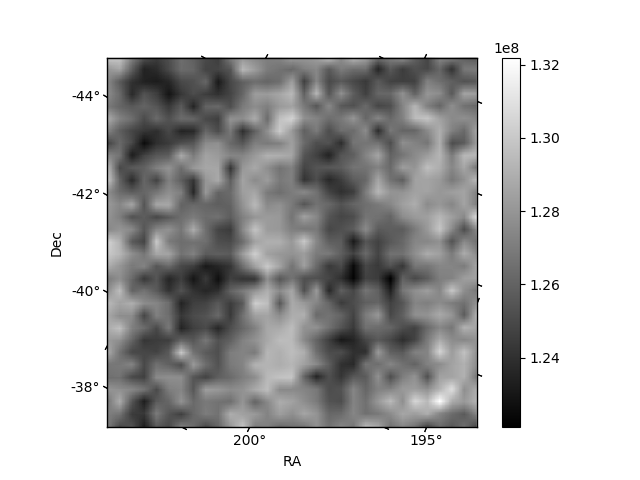
Histogram calculated using DETX and DETY for each event in the final _common_clean file
| Quadrant A | 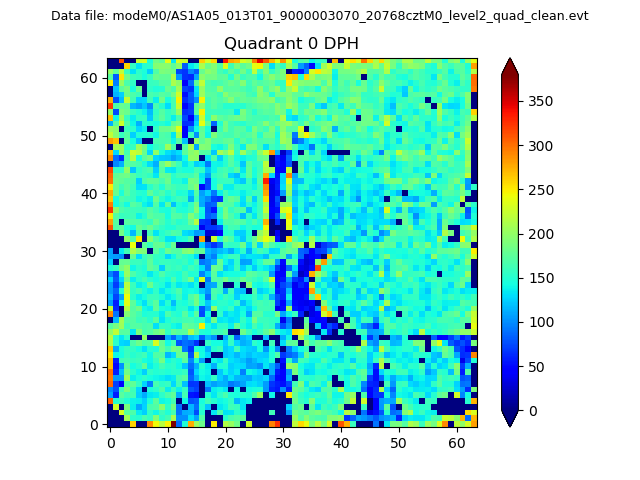 |
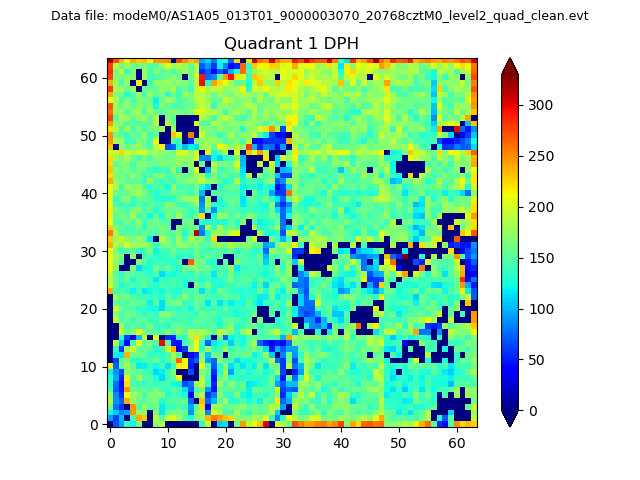 |
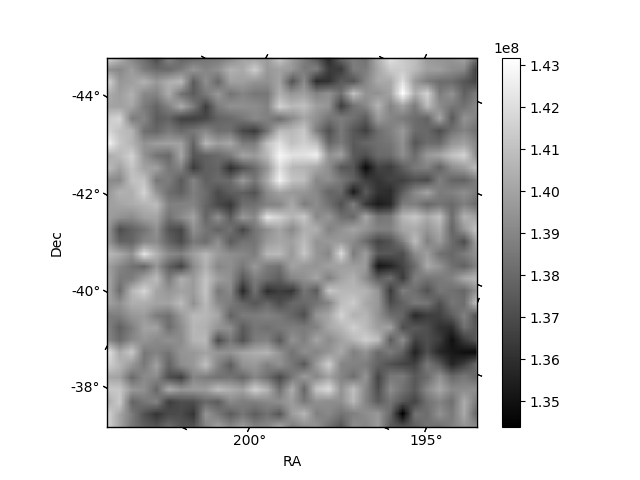
Quadrant B |
|---|---|---|---|
| Quadrant D | 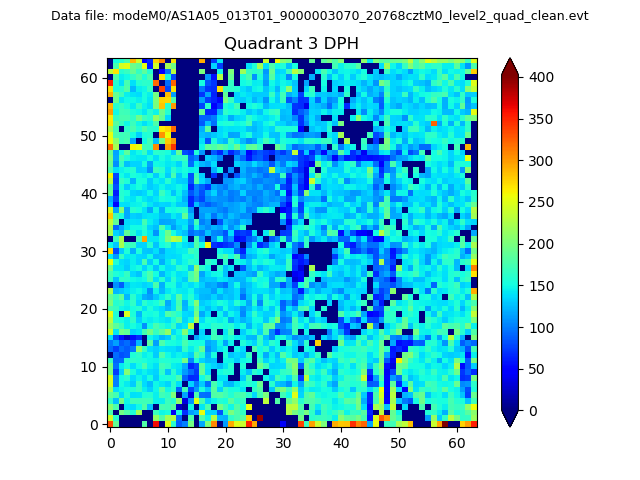 |
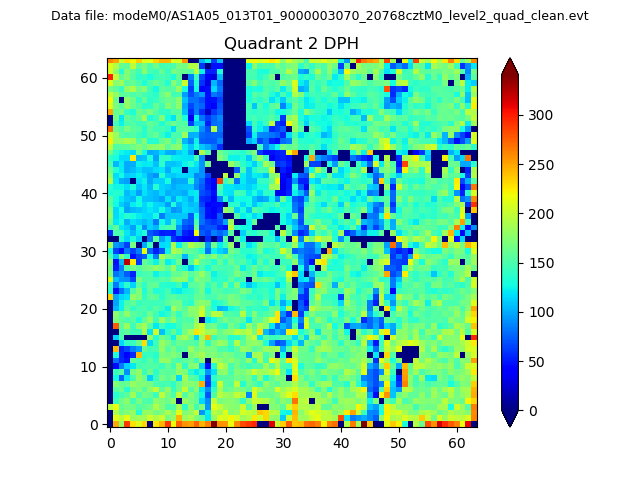 |
Quadrant C |
| Plot type | Count rate plots | Images |
|---|---|---|
| Comparison with Poisson distribution Blue bars denote a histogram of data divided into 1 sec bins. Red curve is a Poisson curve with rate = median count rate of data. |
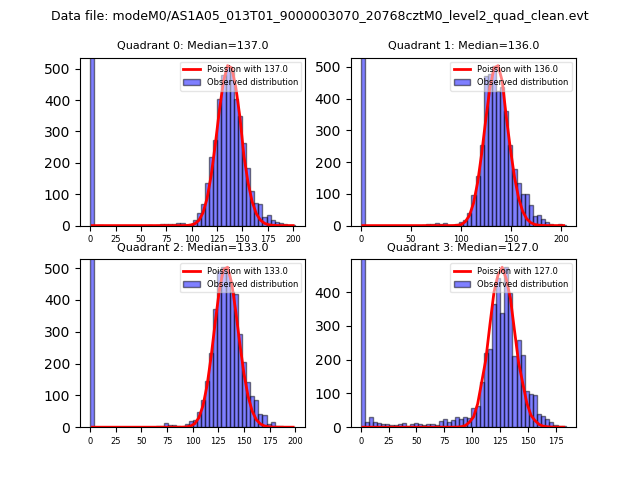 |
 |
| Quadrant-wise count rates Data is divided into 100 sec bins |
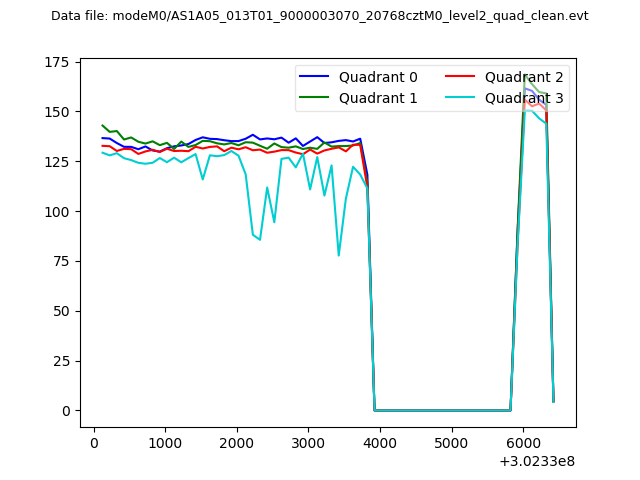 |
|
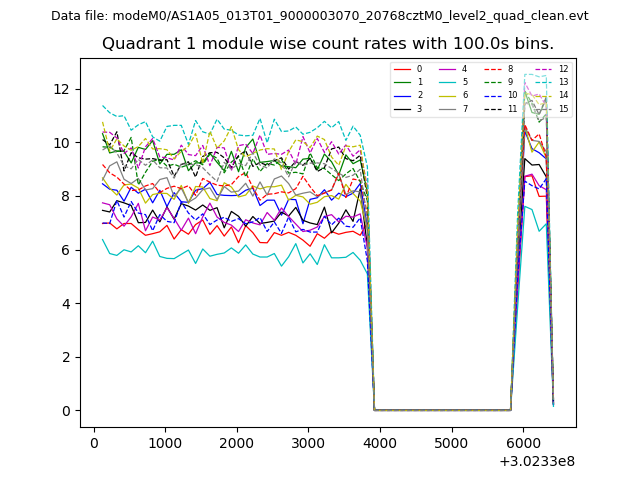
| Module-wise count rates for Quadrant A Data is divided into 100 sec bins |
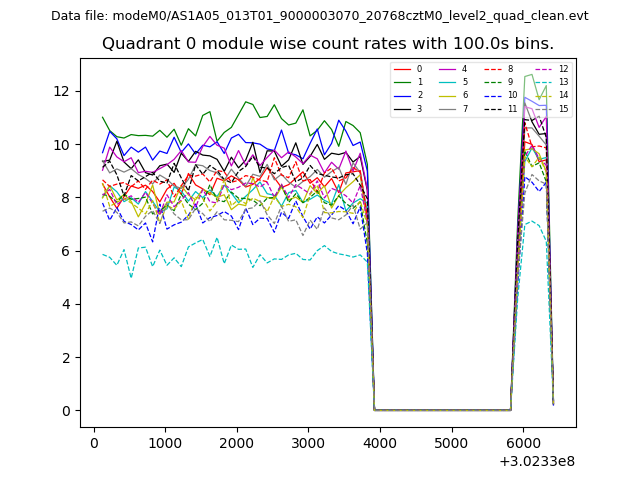 |
 |
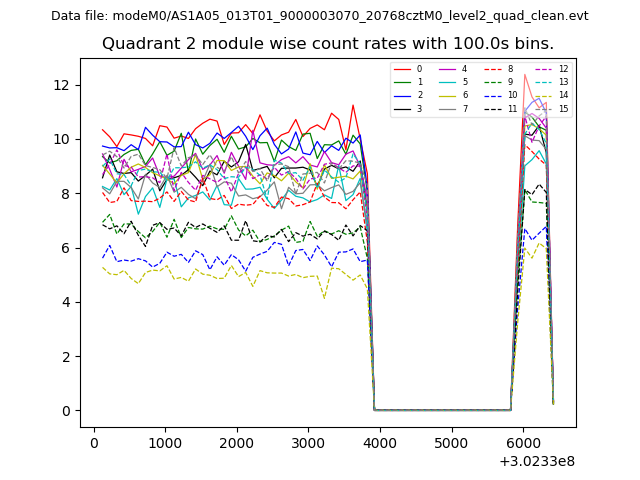
| Module-wise count rates for Quadrant B Data is divided into 100 sec bins |
 |
 |
| Module-wise count rates for Quadrant C Data is divided into 100 sec bins |
 |
 |
| Module-wise count rates for Quadrant D Data is divided into 100 sec bins |
 |
 |
| Parameter | Plot |
|---|---|
| CZT HV Monitor | 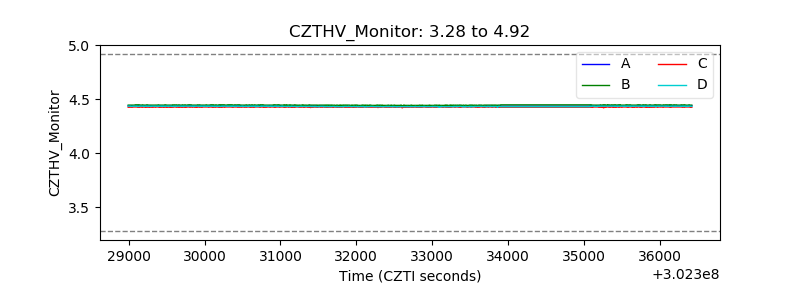 |
| D_VDD |  |
| Temperature 1 | 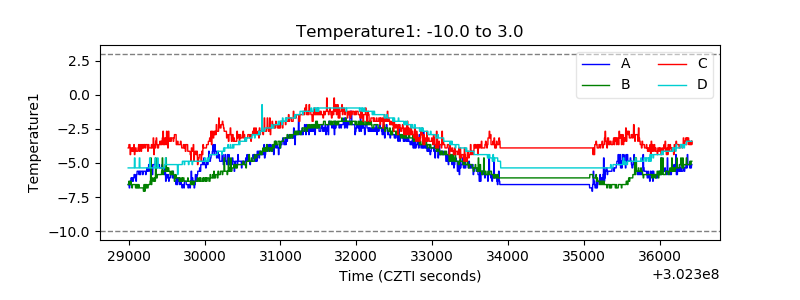 |
| Veto HV Monitor | 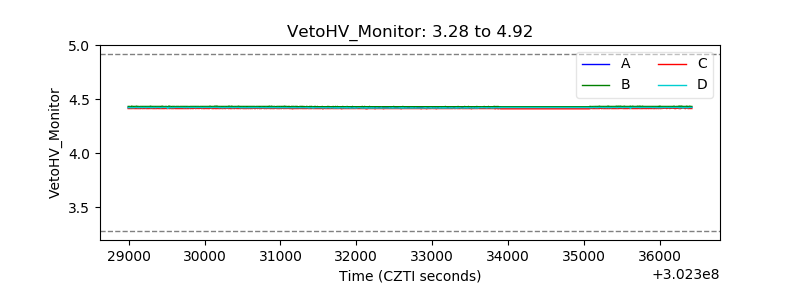 |
| Veto LLD |  |
| Alpha Counter | 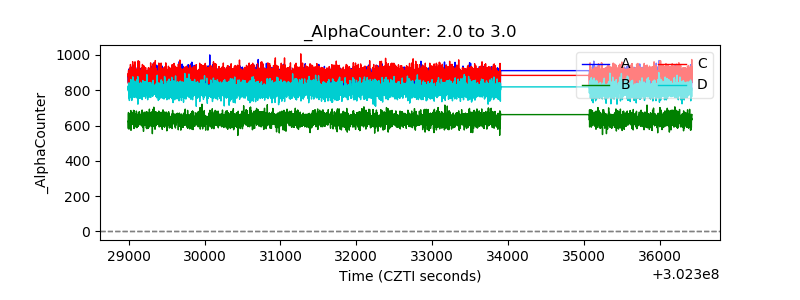 |
| _CPM_Rate | 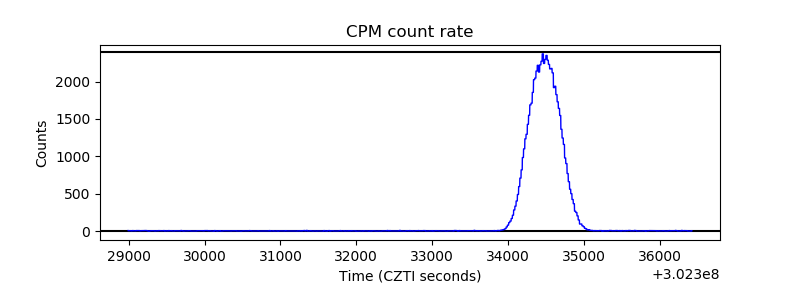 |
| CZT Counter | 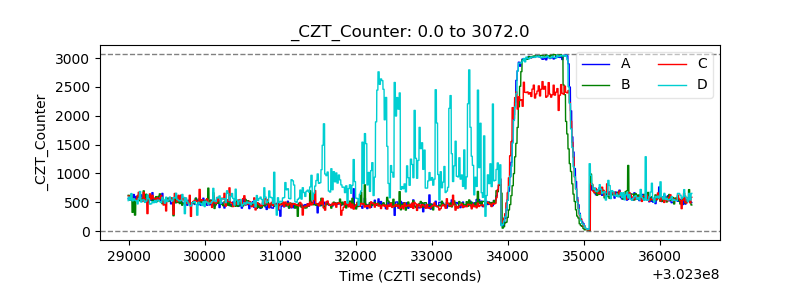 |
| +2.5 Volts monitor |  |
| +5 Volts monitor | 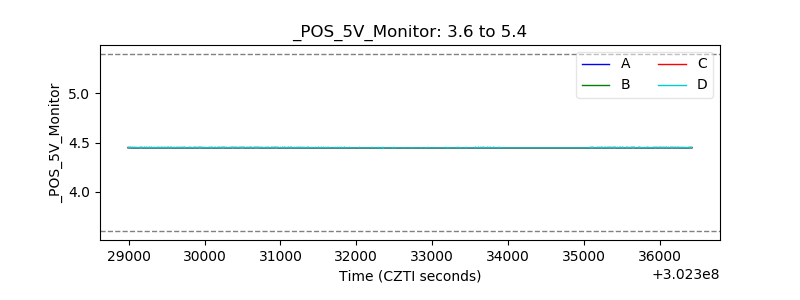 |
| _ROLL_ROT |  |
| _Roll_DEC | 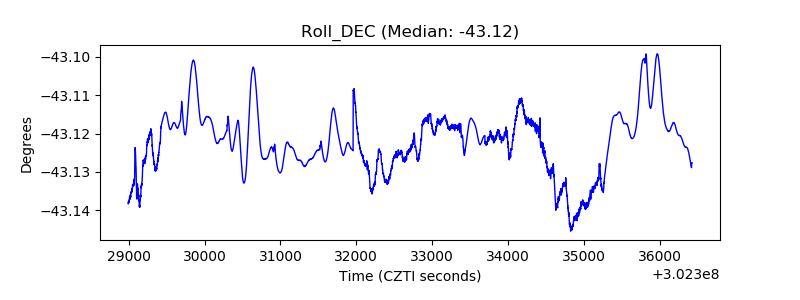 |
| _Roll_RA | 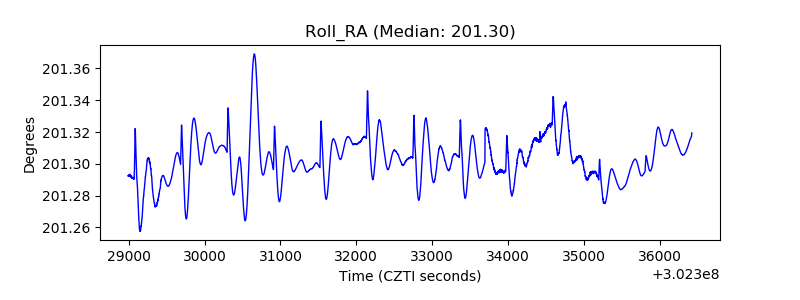 |
| Veto Counter | 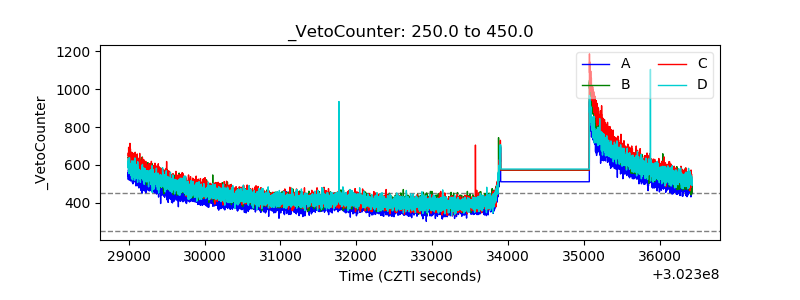 |