| Param | Original file | Final file |
|---|---|---|
| Filename | modeM0/AS1A05_013T01_9000003070_20771cztM0_level2.evt | modeM0/AS1A05_013T01_9000003070_20771cztM0_level2_quad_clean.evt |
| Size (bytes) | 922,046,400 | 215,184,960 |
| Size | 879.3 MB | 205.2 MB |
| Events in quadrant A | 5,761,125 | 1,502,692 |
| Events in quadrant B | 6,439,436 | 1,470,177 |
| Events in quadrant C | 5,651,919 | 1,427,263 |
| Events in quadrant D | 9,343,248 | 1,371,008 |
| Mode SS | |||
|---|---|---|---|
| Quadrant | BADHDUFLAG | Total packets | Discarded packets |
| A | 0 | 220 | 0 |
| B | 0 | 220 | 0 |
| C | 0 | 220 | 0 |
| D | 0 | 220 | 0 |
| Mode M0 | |||
|---|---|---|---|
| Quadrant | BADHDUFLAG | Total packets | Discarded packets |
| A | 0 | 23827 | 2 |
| B | 0 | 26012 | 2 |
| C | 0 | 23525 | 2 |
| D | 0 | 35916 | 2 |
| Mode M9 | |||
|---|---|---|---|
| Quadrant | BADHDUFLAG | Total packets | Discarded packets |
| A | 0 | 27 | 0 |
| B | 0 | 27 | 0 |
| C | 0 | 27 | 0 |
| D | 0 | 27 | 0 |
| Quadrant | Total seconds | Saturated seconds | Saturation percentage |
|---|---|---|---|
| A | 10786 | 172 | 1.594660% |
| B | 10786 | 294 | 2.725756% |
| C | 10787 | 241 | 2.234171% |
| D | 10787 | 758 | 7.026977% |
Noise dominated data is calculated using 1-second bins in cleaned event files. If a bin has >2000 counts, and if more than 50% of those come from <1% of pixels, then it is considered to be noise-dominated and hence unusable.
| Quadrant | # 1 sec bins | Bins with >0 counts | Bins with >2000 counts | High rate bins dominated by noise | Noise dominated (total time) | Noise dominated (detector-on time) | Marked lightcurve |
|---|---|---|---|---|---|---|---|
| A | 13451 | 10786 | 4 | 4 | 0.03% | 0.04% | 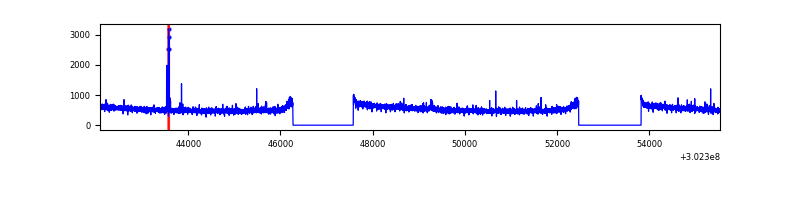 |
| B | 13451 | 10786 | 73 | 73 | 0.54% | 0.68% | 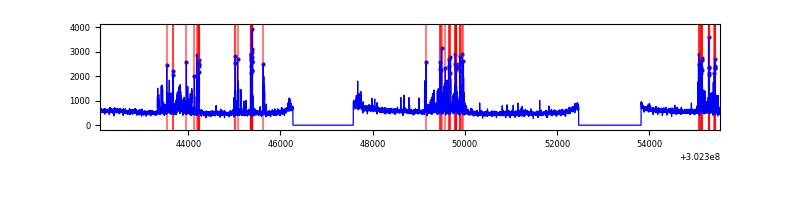 |
| C | 13452 | 10787 | 0 | 0 | 0.00% | 0.00% | 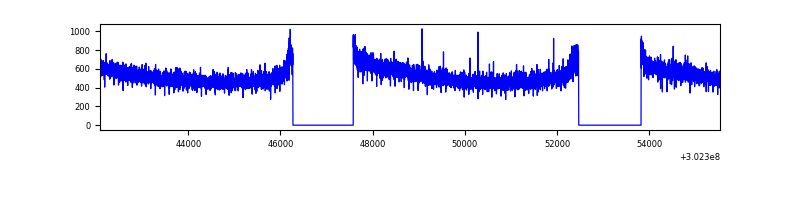 |
| D | 13452 | 10787 | 569 | 569 | 4.23% | 5.27% | 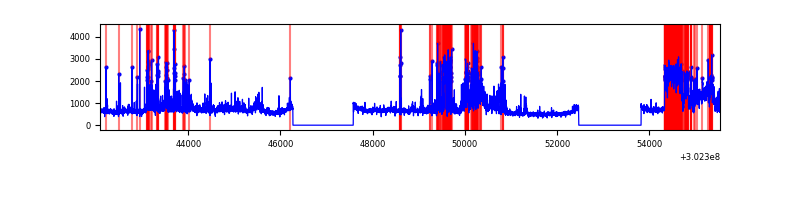 |
Top three noisy pixels from each quadrant. If the there are fewer than three noisy pixels in the level2.evt file, extra rows are filled as -1
| Pixel properties | Quadrant properties | ||||||
|---|---|---|---|---|---|---|---|
| Quadrant | DetID | PixID | Counts | Sigma | Mean | Median | Sigma |
| A | 5 | 16 | 46276 | 153.56 | 1483 | 1460 | 291.9 |
| A | 13 | 61 | 21303 | 67.99 | 1483 | 1460 | 291.9 |
| A | 0 | 226 | 13243 | 40.37 | 1483 | 1460 | 291.9 |
| B | 7 | 220 | 483421 | 1837.24 | 1433 | 1404 | 262.4 |
| B | 0 | 245 | 86778 | 325.41 | 1433 | 1404 | 262.4 |
| B | 0 | 230 | 54433 | 202.12 | 1433 | 1404 | 262.4 |
| C | 14 | 238 | 223534 | 707.15 | 1389 | 1403 | 314.1 |
| C | 13 | 61 | 9840 | 26.86 | 1389 | 1403 | 314.1 |
| C | 7 | 247 | 7964 | 20.89 | 1389 | 1403 | 314.1 |
| D | 1 | 20 | 2962930 | 8860.22 | 1412 | 1375 | 334.3 |
| D | 1 | 52 | 877690 | 2621.71 | 1412 | 1375 | 334.3 |
| D | 12 | 227 | 62842 | 183.89 | 1412 | 1375 | 334.3 |
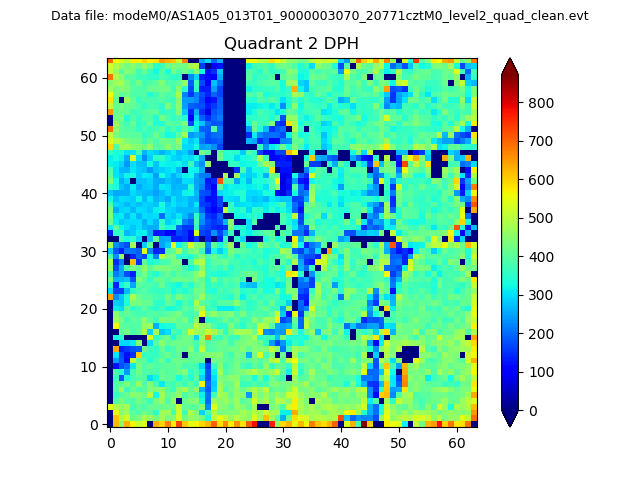
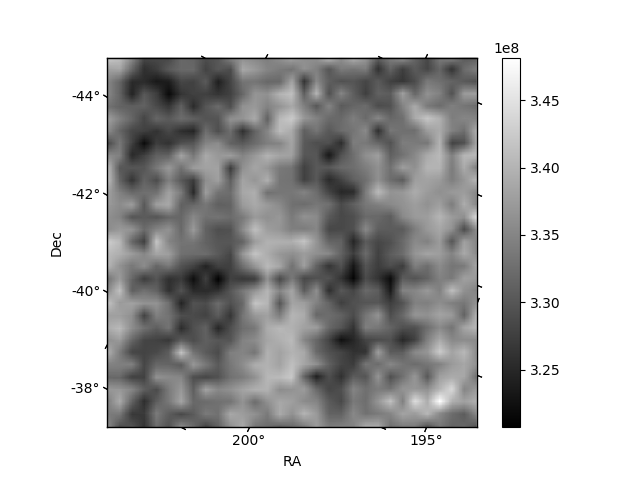
Histogram calculated using DETX and DETY for each event in the final _common_clean file
| Quadrant A | 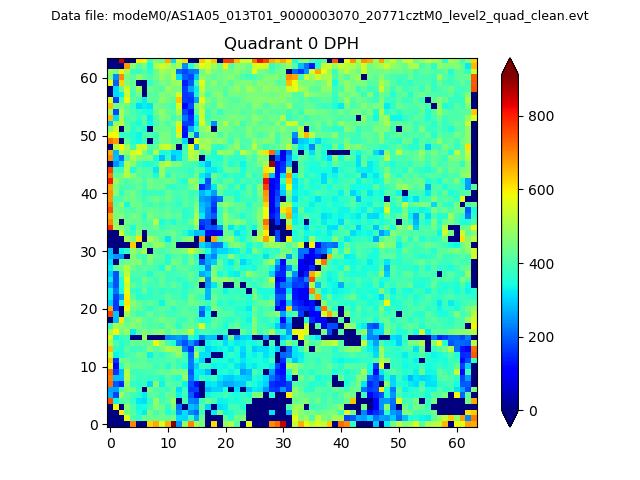 |
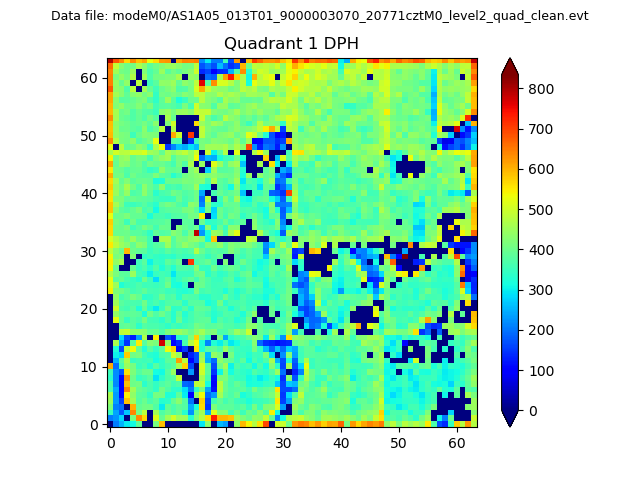 |
Quadrant B |
|---|---|---|---|
| Quadrant D | 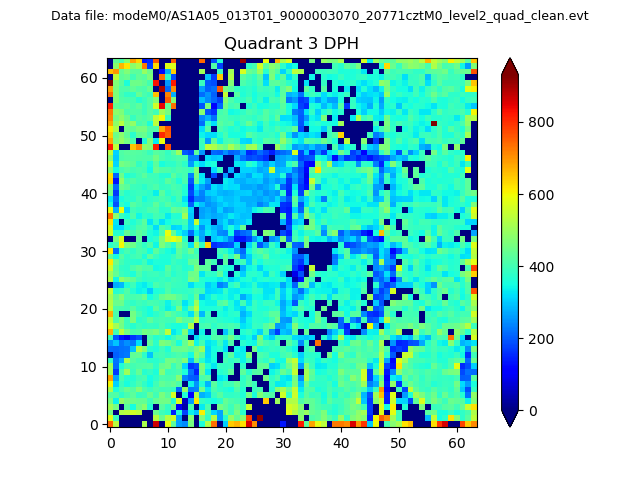 |
 |
Quadrant C |
| Plot type | Count rate plots | Images |
|---|---|---|
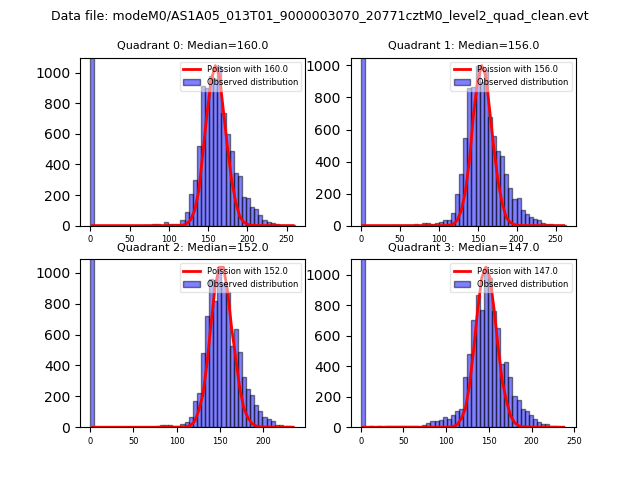
| Comparison with Poisson distribution Blue bars denote a histogram of data divided into 1 sec bins. Red curve is a Poisson curve with rate = median count rate of data. |
 |
 |
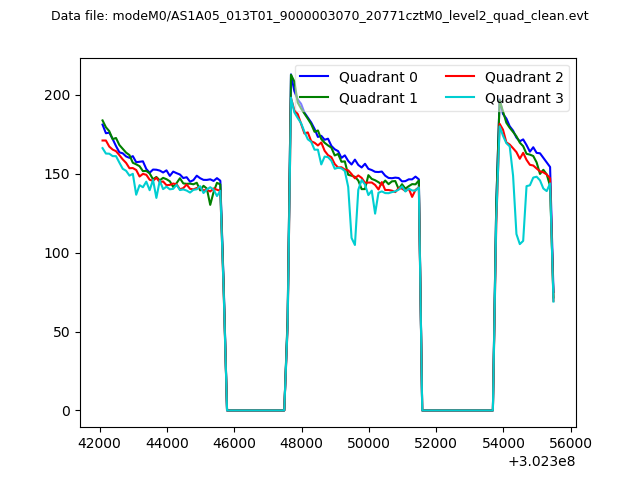
| Quadrant-wise count rates Data is divided into 100 sec bins |
 |
|
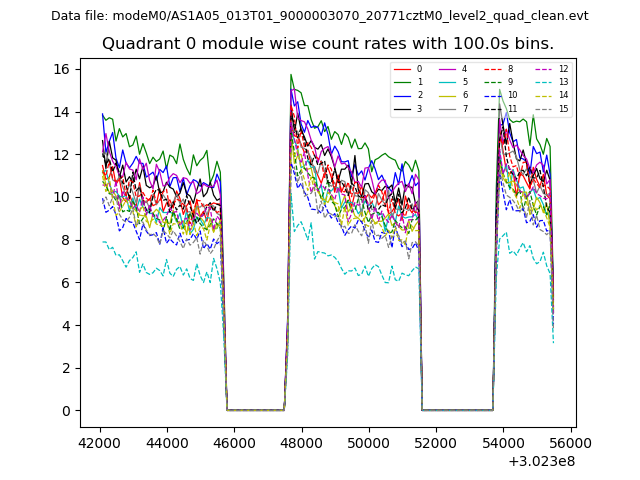
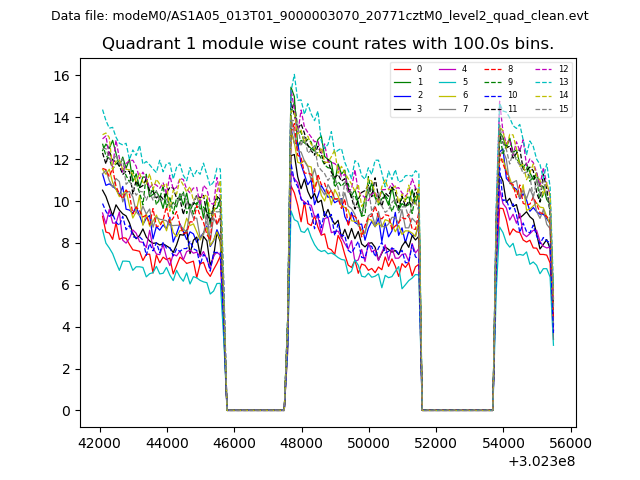
| Module-wise count rates for Quadrant A Data is divided into 100 sec bins |
 |
 |
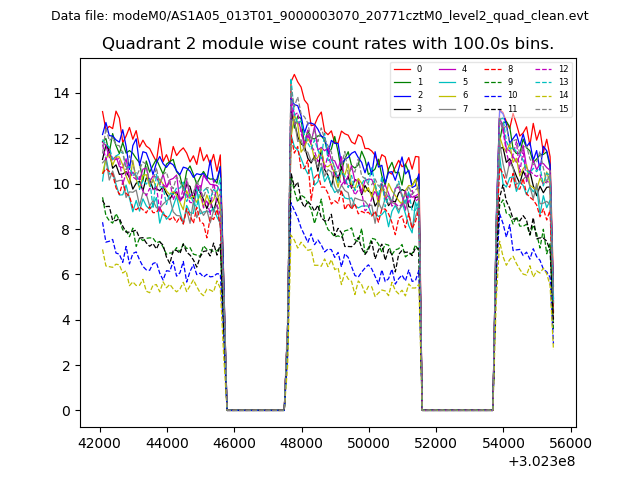
| Module-wise count rates for Quadrant B Data is divided into 100 sec bins |
 |
 |
| Module-wise count rates for Quadrant C Data is divided into 100 sec bins |
 |
 |
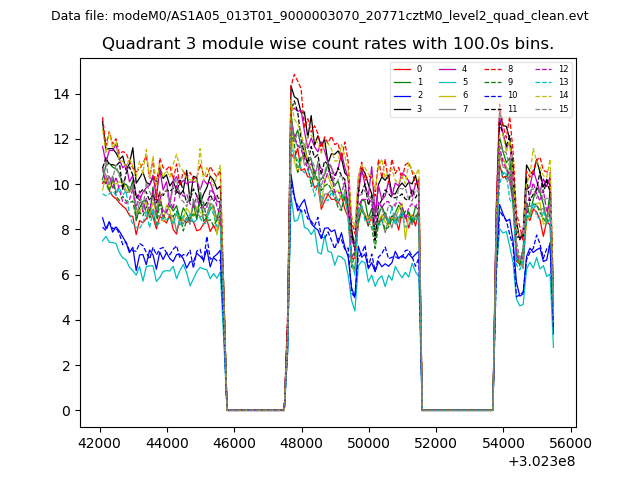
| Module-wise count rates for Quadrant D Data is divided into 100 sec bins |
 |
 |
| Parameter | Plot |
|---|---|
| CZT HV Monitor | 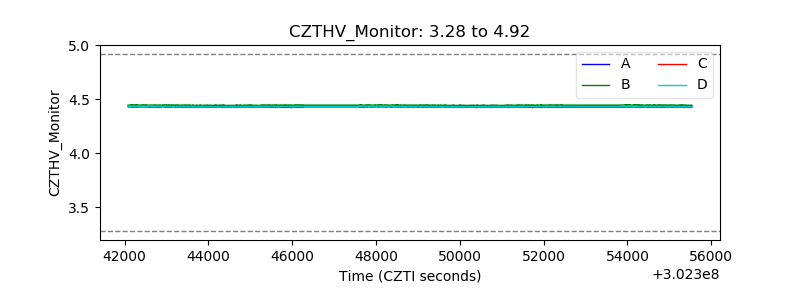 |
| D_VDD | 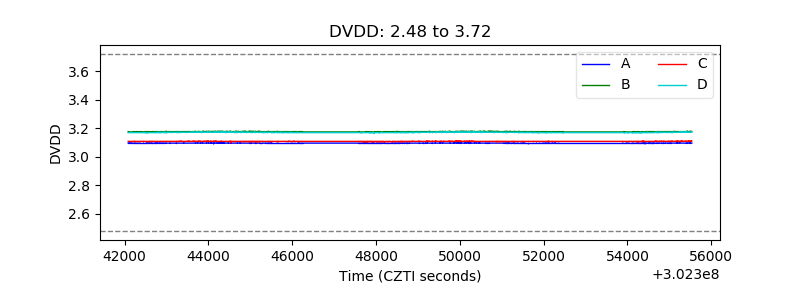 |
| Temperature 1 | 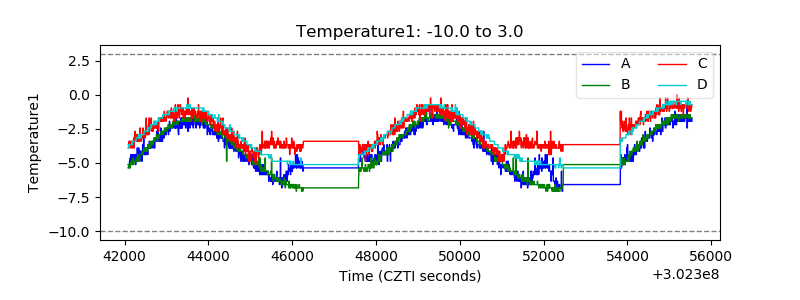 |
| Veto HV Monitor | 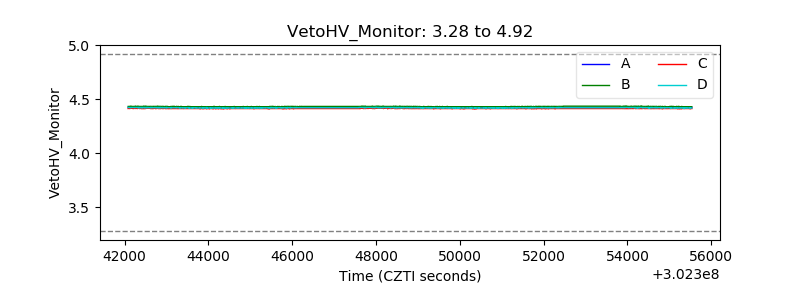 |
| Veto LLD | 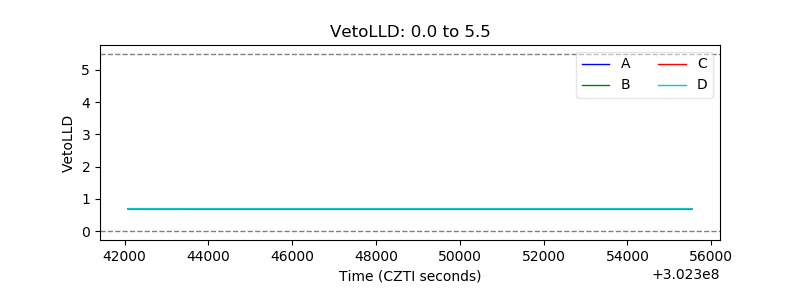 |
| Alpha Counter | 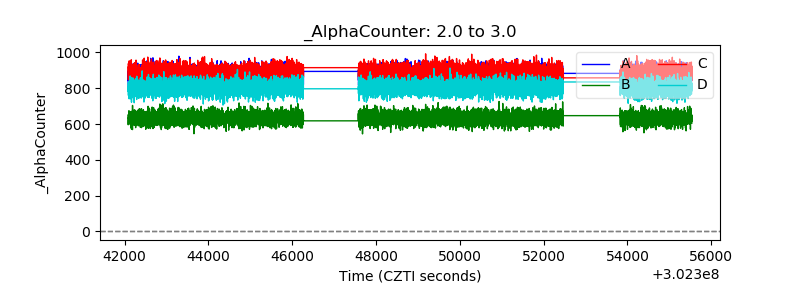 |
| _CPM_Rate | 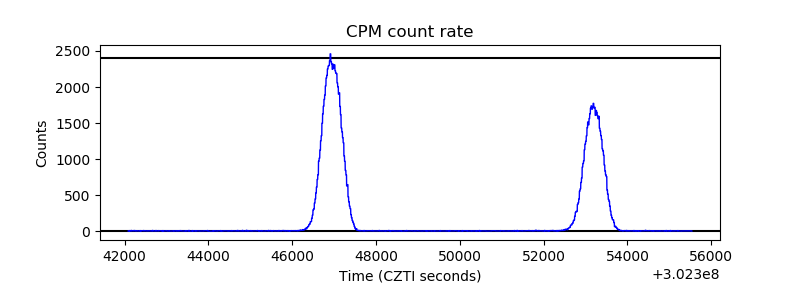 |
| CZT Counter | 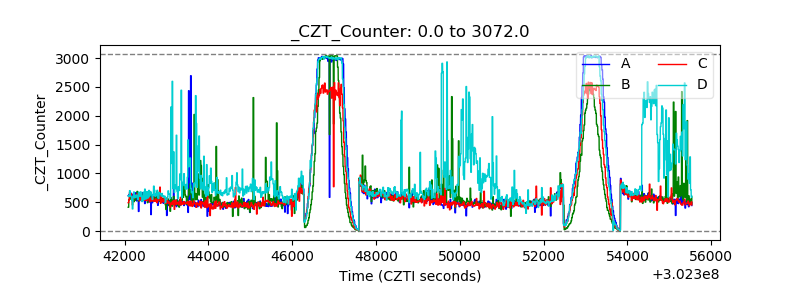 |
| +2.5 Volts monitor |  |
| +5 Volts monitor |  |
| _ROLL_ROT | 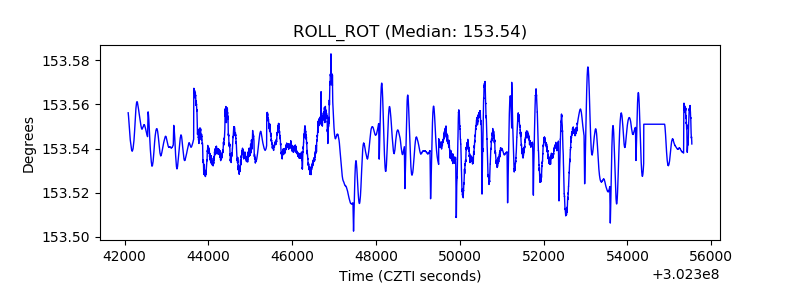 |
| _Roll_DEC | 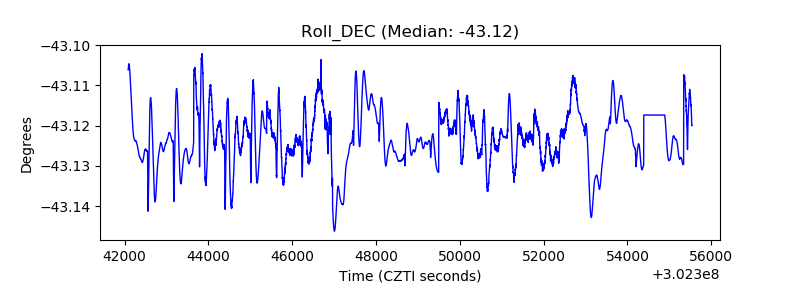 |
| _Roll_RA |  |
| Veto Counter | 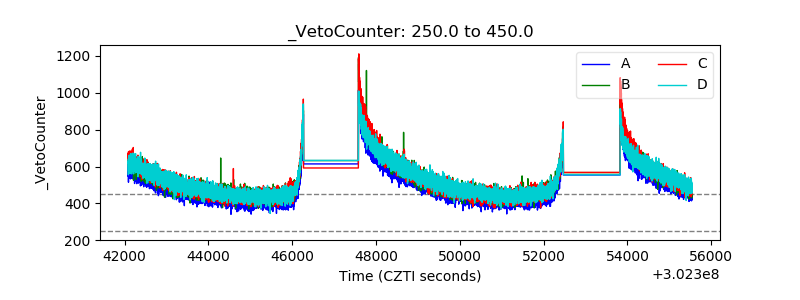 |