| Param | Original file | Final file |
|---|---|---|
| Filename | modeM0/AS1A05_013T01_9000003070_20772cztM0_level2.evt | modeM0/AS1A05_013T01_9000003070_20772cztM0_level2_quad_clean.evt |
| Size (bytes) | 479,750,400 | 99,195,840 |
| Size | 457.5 MB | 94.6 MB |
| Events in quadrant A | 2,971,476 | 677,619 |
| Events in quadrant B | 3,227,386 | 659,105 |
| Events in quadrant C | 2,892,837 | 639,257 |
| Events in quadrant D | 5,043,687 | 622,337 |
| Mode SS | |||
|---|---|---|---|
| Quadrant | BADHDUFLAG | Total packets | Discarded packets |
| A | 0 | 120 | 0 |
| B | 0 | 120 | 0 |
| C | 0 | 120 | 0 |
| D | 0 | 120 | 0 |
| Mode M0 | |||
|---|---|---|---|
| Quadrant | BADHDUFLAG | Total packets | Discarded packets |
| A | 0 | 12362 | 1 |
| B | 0 | 13110 | 1 |
| C | 0 | 12191 | 1 |
| D | 0 | 19209 | 1 |
| Mode M9 | |||
|---|---|---|---|
| Quadrant | BADHDUFLAG | Total packets | Discarded packets |
| A | 0 | 12 | 0 |
| B | 0 | 12 | 0 |
| C | 0 | 12 | 0 |
| D | 0 | 12 | 0 |
| Quadrant | Total seconds | Saturated seconds | Saturation percentage |
|---|---|---|---|
| A | 5800 | 86 | 1.482759% |
| B | 5801 | 121 | 2.085847% |
| C | 5801 | 94 | 1.620410% |
| D | 5801 | 294 | 5.068092% |
Noise dominated data is calculated using 1-second bins in cleaned event files. If a bin has >2000 counts, and if more than 50% of those come from <1% of pixels, then it is considered to be noise-dominated and hence unusable.
| Quadrant | # 1 sec bins | Bins with >0 counts | Bins with >2000 counts | High rate bins dominated by noise | Noise dominated (total time) | Noise dominated (detector-on time) | Marked lightcurve |
|---|---|---|---|---|---|---|---|
| A | 7075 | 5800 | 1 | 1 | 0.01% | 0.02% | 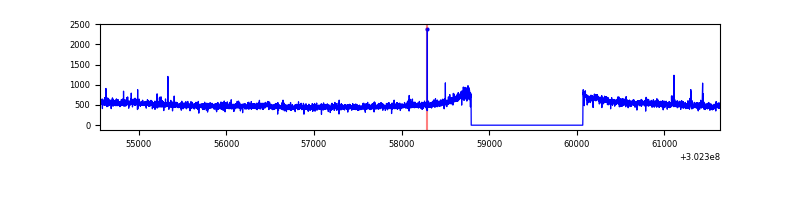 |
| B | 7076 | 5802 | 24 | 24 | 0.34% | 0.41% | 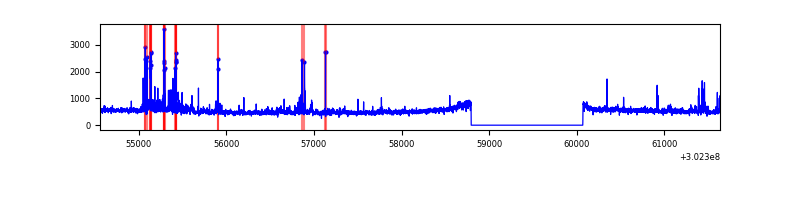 |
| C | 7076 | 5801 | 0 | 0 | 0.00% | 0.00% | 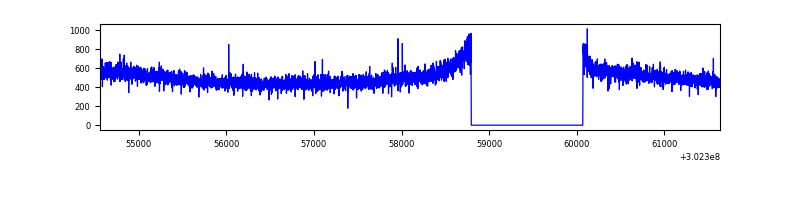 |
| D | 7076 | 5801 | 208 | 208 | 2.94% | 3.59% | 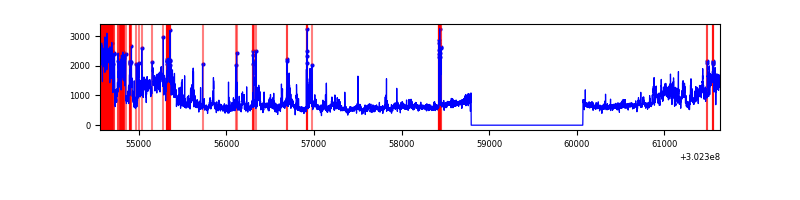 |
Top three noisy pixels from each quadrant. If the there are fewer than three noisy pixels in the level2.evt file, extra rows are filled as -1
| Pixel properties | Quadrant properties | ||||||
|---|---|---|---|---|---|---|---|
| Quadrant | DetID | PixID | Counts | Sigma | Mean | Median | Sigma |
| A | 5 | 203 | 24389 | 155.05 | 763 | 749 | 152.5 |
| A | 5 | 16 | 18031 | 113.35 | 763 | 749 | 152.5 |
| A | 0 | 226 | 6806 | 39.73 | 763 | 749 | 152.5 |
| B | 7 | 220 | 121987 | 868.85 | 738 | 722 | 139.6 |
| B | 0 | 182 | 53981 | 381.6 | 738 | 722 | 139.6 |
| B | 0 | 190 | 33372 | 233.93 | 738 | 722 | 139.6 |
| C | 14 | 238 | 114687 | 698.05 | 711 | 717 | 163.3 |
| C | 13 | 61 | 5131 | 27.04 | 711 | 717 | 163.3 |
| C | 7 | 247 | 4277 | 21.8 | 711 | 717 | 163.3 |
| D | 1 | 20 | 1451844 | 8363.36 | 726 | 705 | 173.5 |
| D | 12 | 227 | 399549 | 2298.66 | 726 | 705 | 173.5 |
| D | 1 | 52 | 296593 | 1705.29 | 726 | 705 | 173.5 |
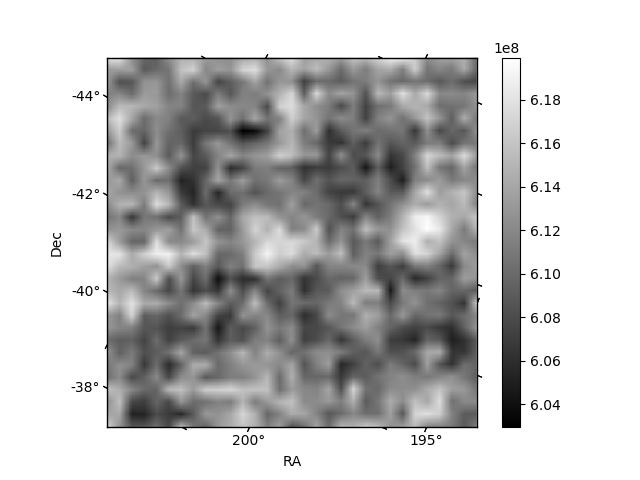
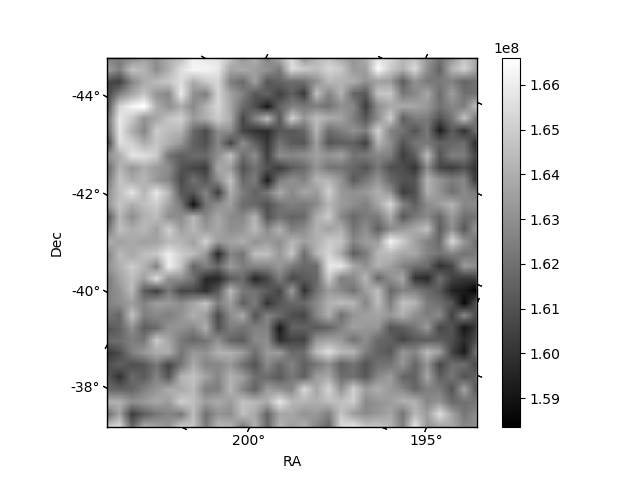
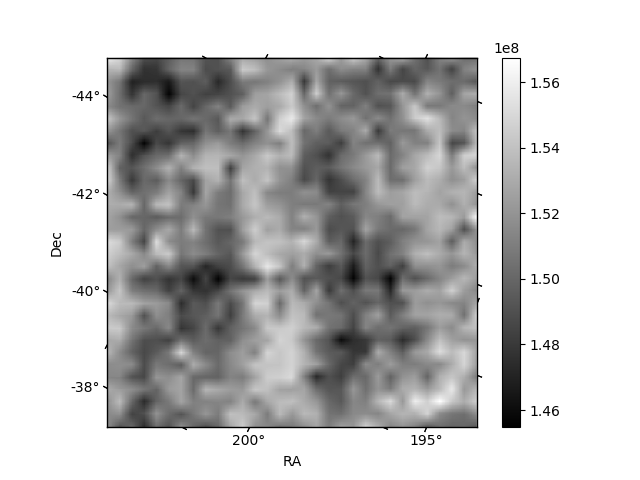
Histogram calculated using DETX and DETY for each event in the final _common_clean file
| Quadrant A | 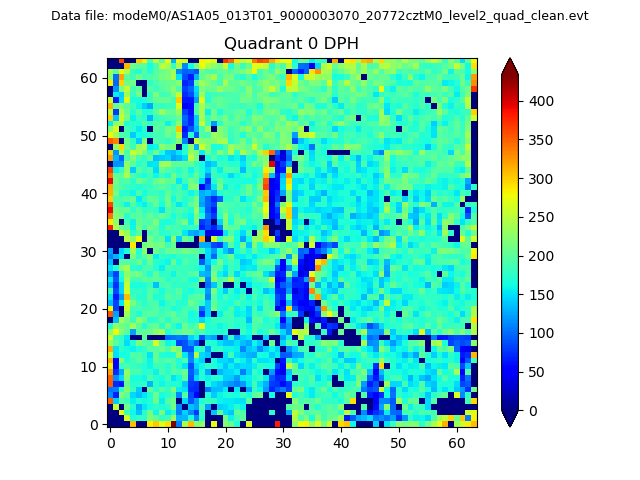 |
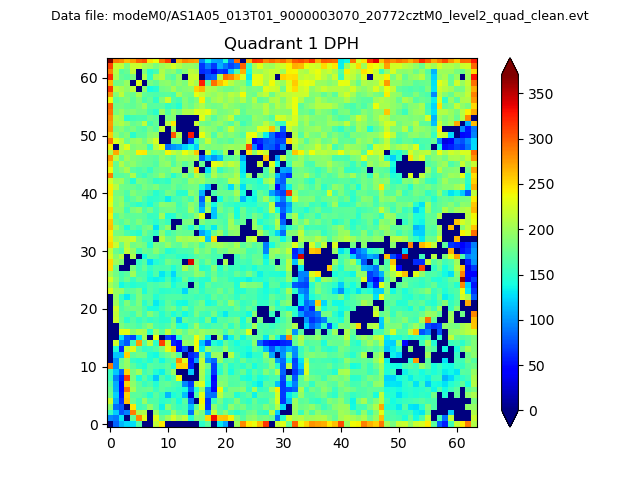 |
Quadrant B |
|---|---|---|---|
| Quadrant D | 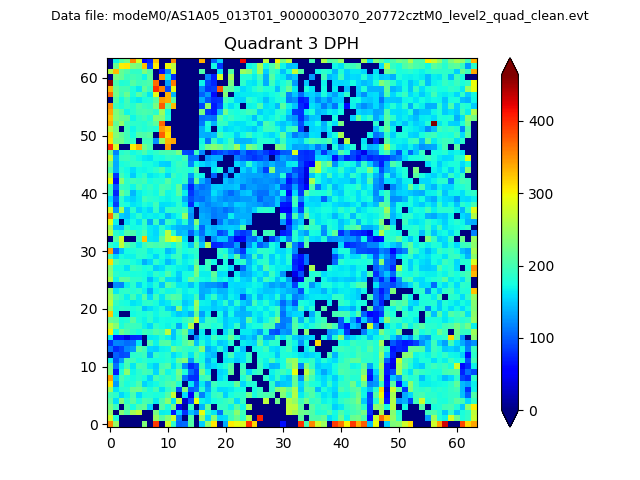 |
 |
Quadrant C |
| Plot type | Count rate plots | Images |
|---|---|---|
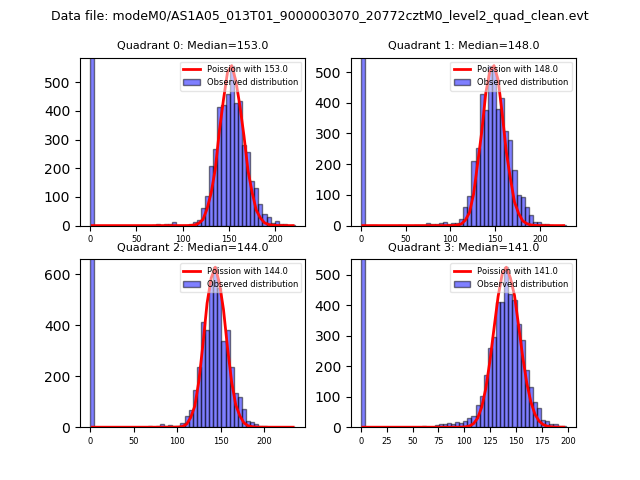
| Comparison with Poisson distribution Blue bars denote a histogram of data divided into 1 sec bins. Red curve is a Poisson curve with rate = median count rate of data. |
 |
 |
| Quadrant-wise count rates Data is divided into 100 sec bins |
 |
|
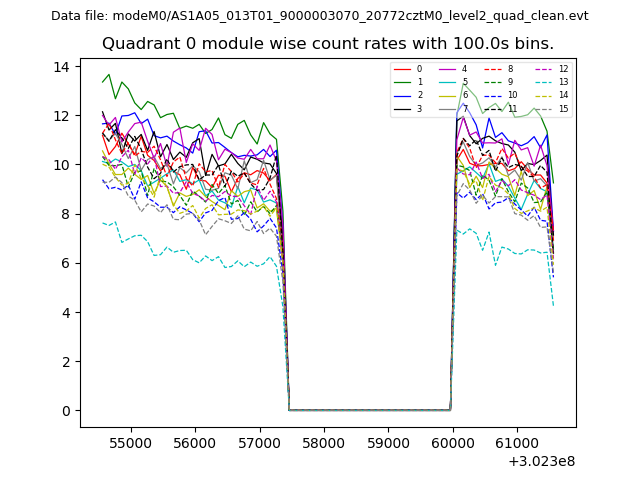
| Module-wise count rates for Quadrant A Data is divided into 100 sec bins |
 |
 |
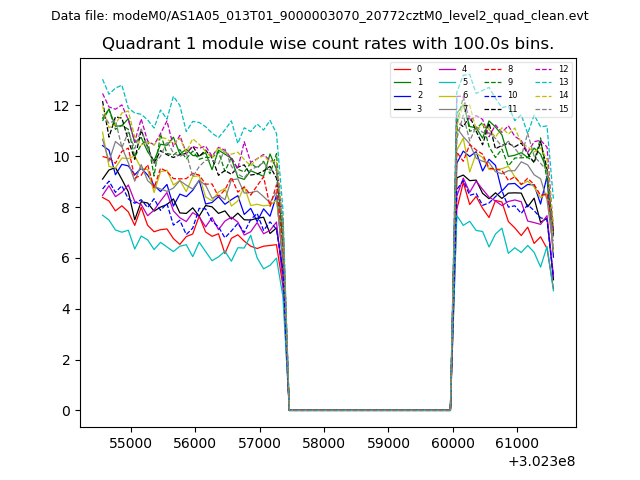
| Module-wise count rates for Quadrant B Data is divided into 100 sec bins |
 |
 |
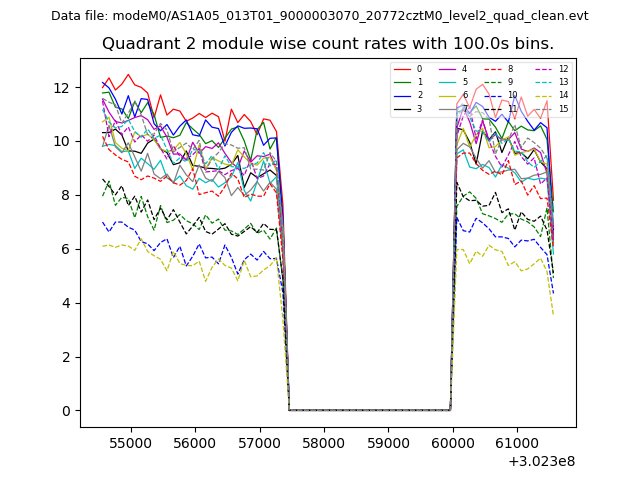
| Module-wise count rates for Quadrant C Data is divided into 100 sec bins |
 |
 |
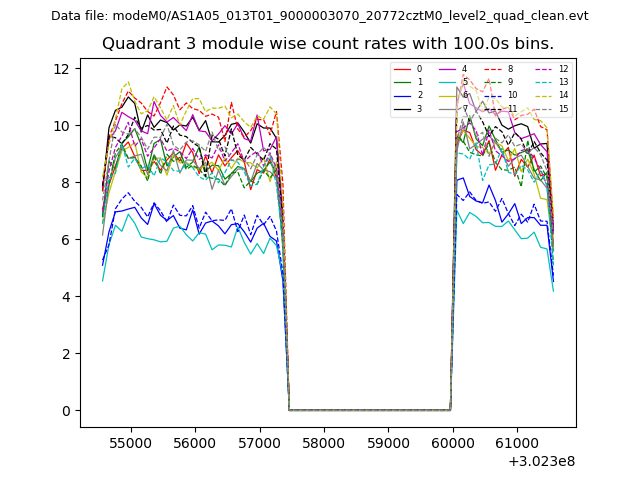
| Module-wise count rates for Quadrant D Data is divided into 100 sec bins |
 |
 |
| Parameter | Plot |
|---|---|
| CZT HV Monitor | 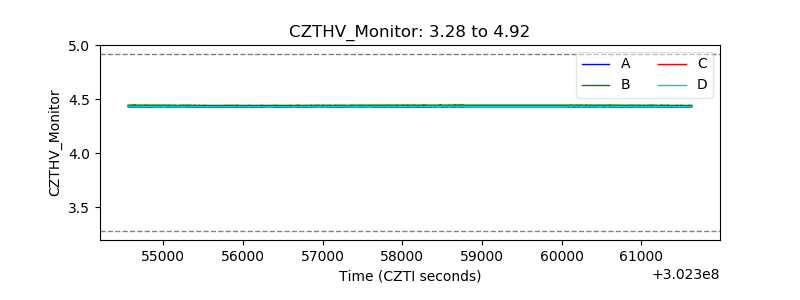 |
| D_VDD | 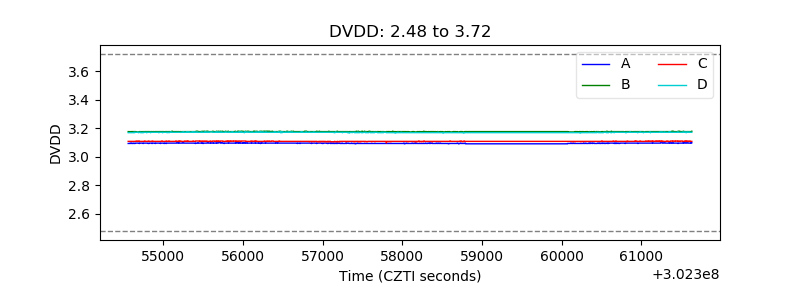 |
| Temperature 1 | 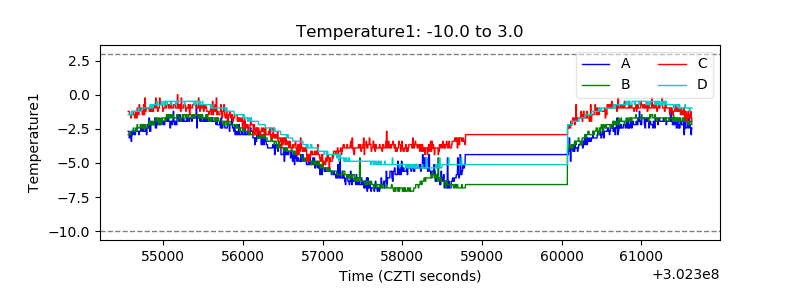 |
| Veto HV Monitor | 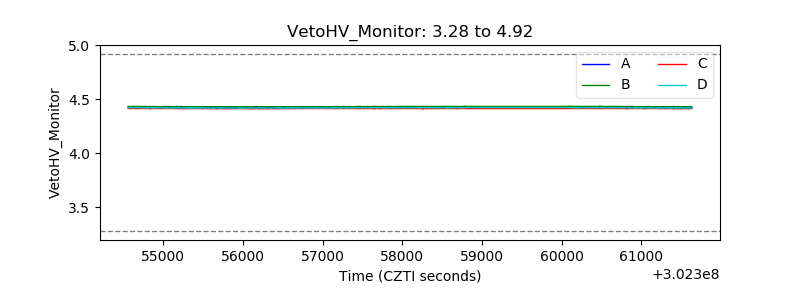 |
| Veto LLD | 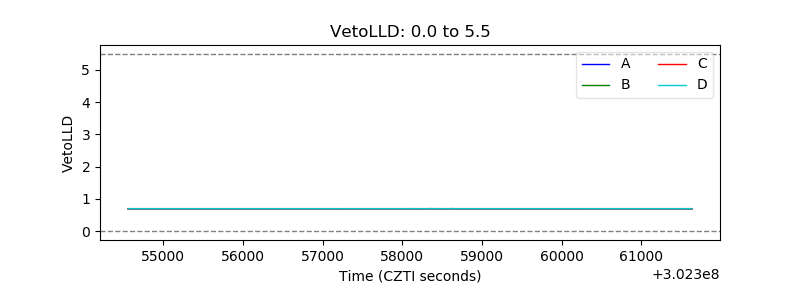 |
| Alpha Counter |  |
| _CPM_Rate |  |
| CZT Counter |  |
| +2.5 Volts monitor |  |
| +5 Volts monitor |  |
| _ROLL_ROT | 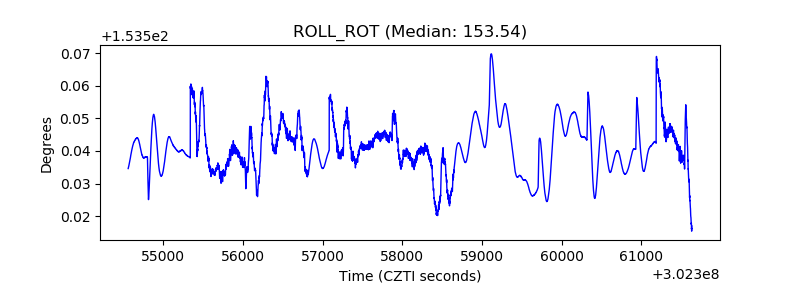 |
| _Roll_DEC | 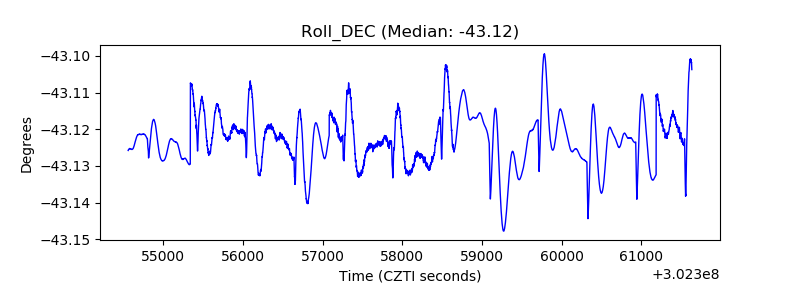 |
| _Roll_RA | 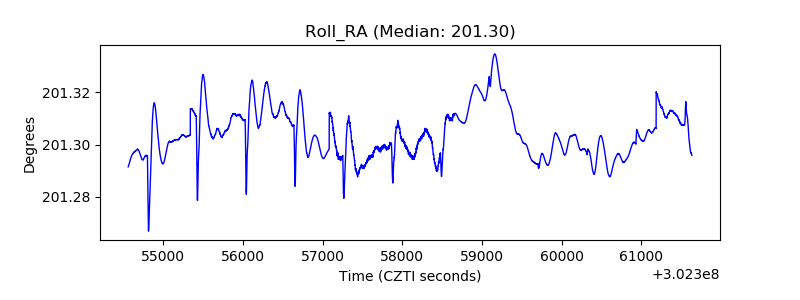 |
| Veto Counter | 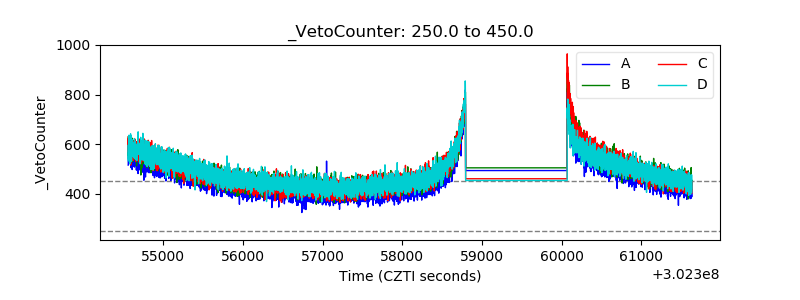 |