| Param | Original file | Final file |
|---|---|---|
| Filename | modeM0/AS1A05_013T01_9000003070_20776cztM0_level2.evt | modeM0/AS1A05_013T01_9000003070_20776cztM0_level2_quad_clean.evt |
| Size (bytes) | 530,156,160 | 107,098,560 |
| Size | 505.6 MB | 102.1 MB |
| Events in quadrant A | 3,617,604 | 702,404 |
| Events in quadrant B | 3,746,963 | 695,185 |
| Events in quadrant C | 3,594,788 | 674,684 |
| Events in quadrant D | 4,602,059 | 663,822 |
| Mode SS | |||
|---|---|---|---|
| Quadrant | BADHDUFLAG | Total packets | Discarded packets |
| A | 0 | 148 | 0 |
| B | 0 | 148 | 0 |
| C | 0 | 148 | 0 |
| D | 0 | 148 | 0 |
| Mode M0 | |||
|---|---|---|---|
| Quadrant | BADHDUFLAG | Total packets | Discarded packets |
| A | 0 | 15691 | 1 |
| B | 0 | 15946 | 4 |
| C | 0 | 15625 | 3 |
| D | 0 | 18675 | 16 |
| Mode M9 | |||
|---|---|---|---|
| Quadrant | BADHDUFLAG | Total packets | Discarded packets |
| A | 0 | 3 | 0 |
| B | 0 | 3 | 0 |
| C | 0 | 3 | 0 |
| D | 0 | 3 | 0 |
| Quadrant | Total seconds | Saturated seconds | Saturation percentage |
|---|---|---|---|
| A | 7291 | 32 | 0.438897% |
| B | 7290 | 73 | 1.001372% |
| C | 7290 | 54 | 0.740741% |
| D | 7288 | 93 | 1.276070% |
Noise dominated data is calculated using 1-second bins in cleaned event files. If a bin has >2000 counts, and if more than 50% of those come from <1% of pixels, then it is considered to be noise-dominated and hence unusable.
| Quadrant | # 1 sec bins | Bins with >0 counts | Bins with >2000 counts | High rate bins dominated by noise | Noise dominated (total time) | Noise dominated (detector-on time) | Marked lightcurve |
|---|---|---|---|---|---|---|---|
| A | 7626 | 7292 | 15 | 15 | 0.20% | 0.21% | 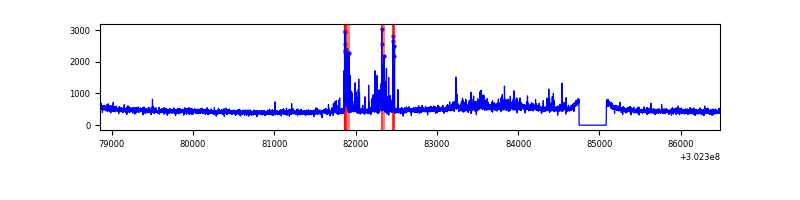 |
| B | 7626 | 7292 | 25 | 25 | 0.33% | 0.34% | 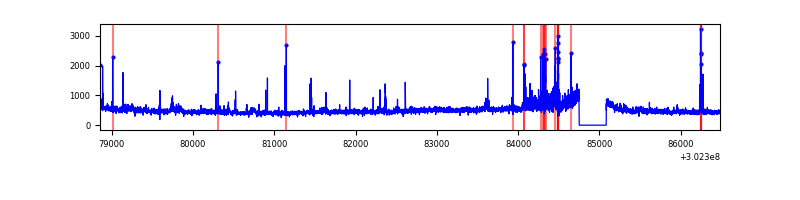 |
| C | 7626 | 7292 | 7 | 7 | 0.09% | 0.10% | 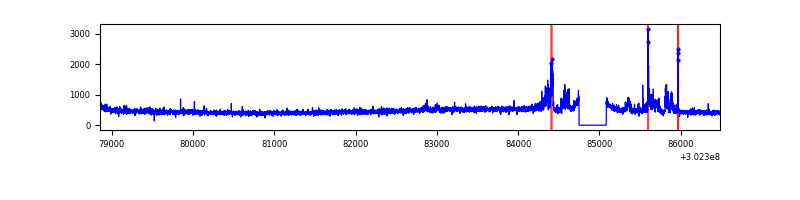 |
| D | 7626 | 7291 | 67 | 67 | 0.88% | 0.92% | 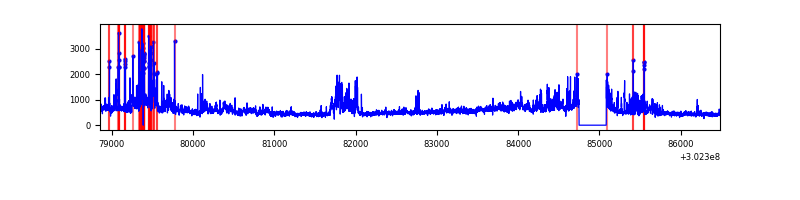 |
Top three noisy pixels from each quadrant. If the there are fewer than three noisy pixels in the level2.evt file, extra rows are filled as -1
| Pixel properties | Quadrant properties | ||||||
|---|---|---|---|---|---|---|---|
| Quadrant | DetID | PixID | Counts | Sigma | Mean | Median | Sigma |
| A | 5 | 16 | 154384 | 865.17 | 870 | 850 | 177.5 |
| A | 10 | 253 | 104259 | 582.71 | 870 | 850 | 177.5 |
| A | 13 | 252 | 17807 | 95.55 | 870 | 850 | 177.5 |
| B | 7 | 220 | 170154 | 1024.86 | 858 | 837 | 165.2 |
| B | 0 | 189 | 35331 | 208.79 | 858 | 837 | 165.2 |
| B | 0 | 182 | 32300 | 190.44 | 858 | 837 | 165.2 |
| C | 9 | 54 | 260150 | 1355.01 | 820 | 824 | 191.4 |
| C | 14 | 238 | 129437 | 672.02 | 820 | 824 | 191.4 |
| C | 13 | 61 | 5883 | 26.43 | 820 | 824 | 191.4 |
| D | 1 | 52 | 690799 | 3390.44 | 835 | 810 | 203.5 |
| D | 1 | 20 | 619464 | 3039.92 | 835 | 810 | 203.5 |
| D | 12 | 227 | 82028 | 399.08 | 835 | 810 | 203.5 |
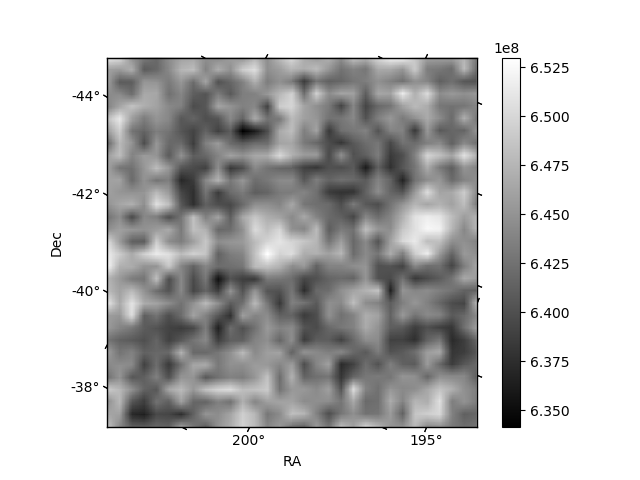
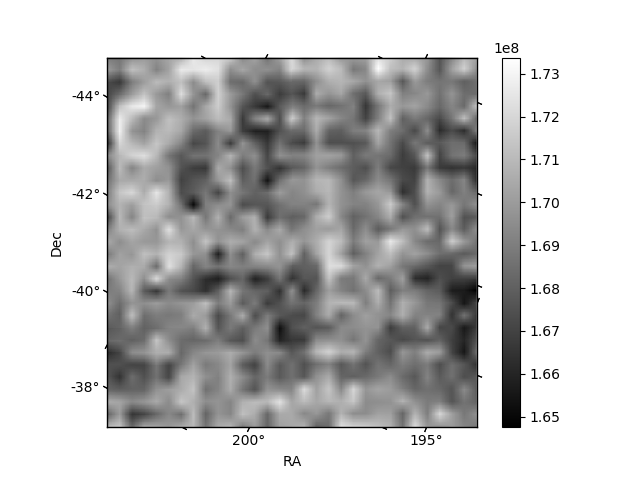
Histogram calculated using DETX and DETY for each event in the final _common_clean file
| Quadrant A | 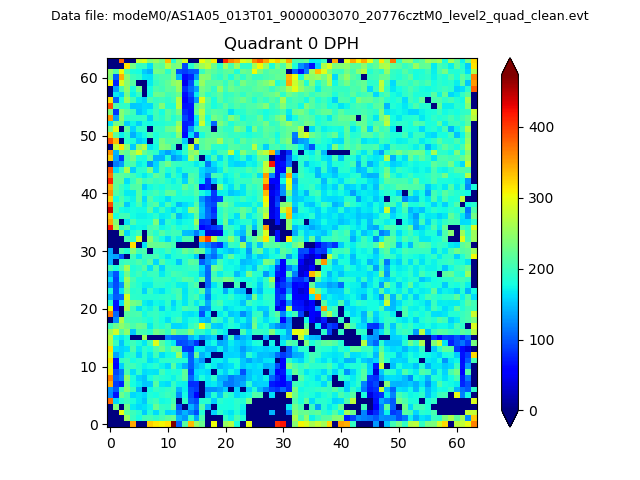 |
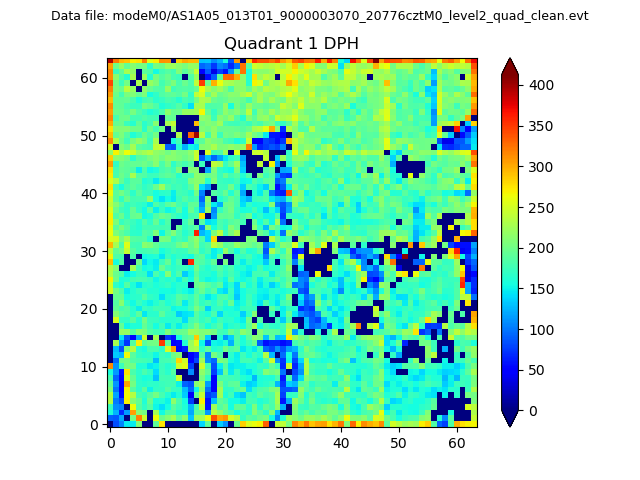 |
Quadrant B |
|---|---|---|---|
| Quadrant D | 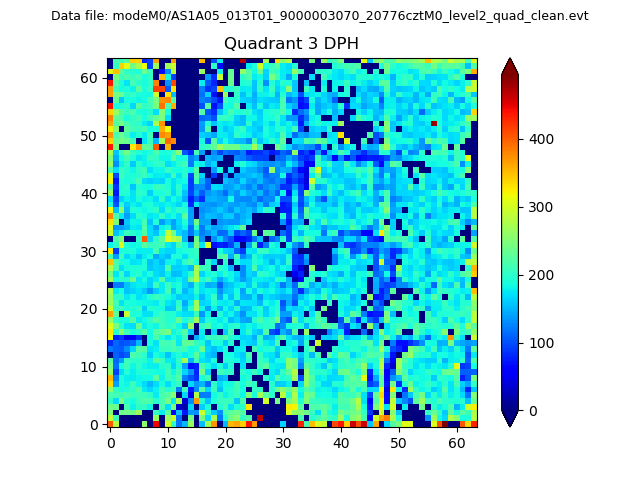 |
 |
Quadrant C |
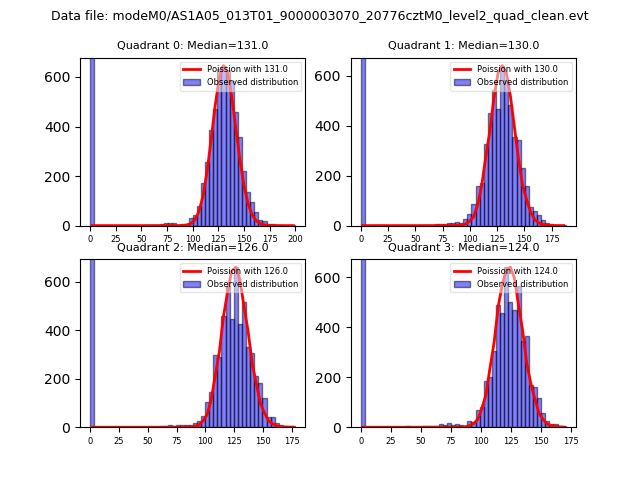
| Plot type | Count rate plots | Images |
|---|---|---|
| Comparison with Poisson distribution Blue bars denote a histogram of data divided into 1 sec bins. Red curve is a Poisson curve with rate = median count rate of data. |
 |
 |
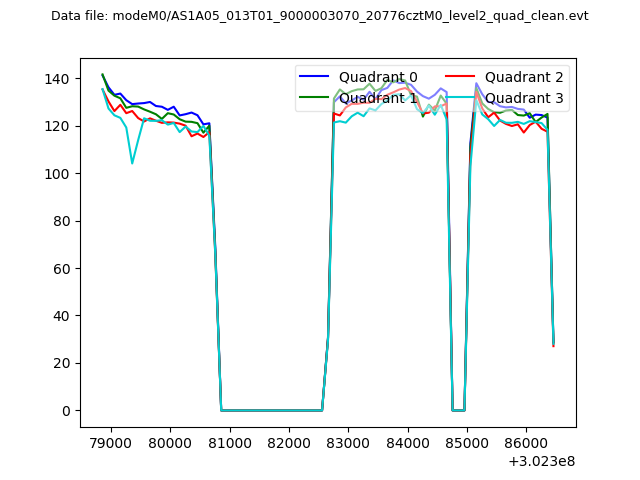
| Quadrant-wise count rates Data is divided into 100 sec bins |
 |
|
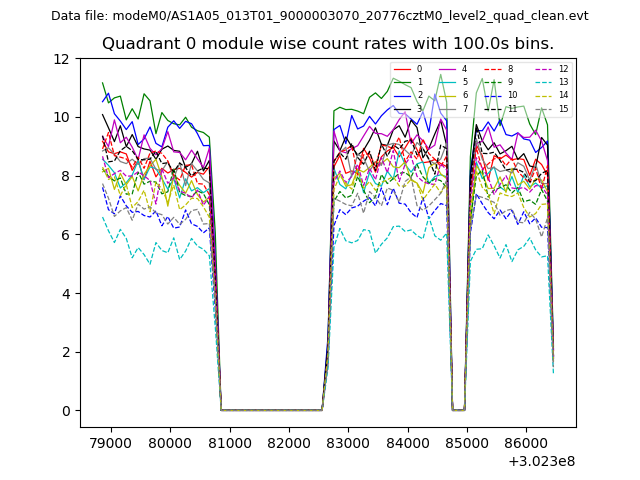
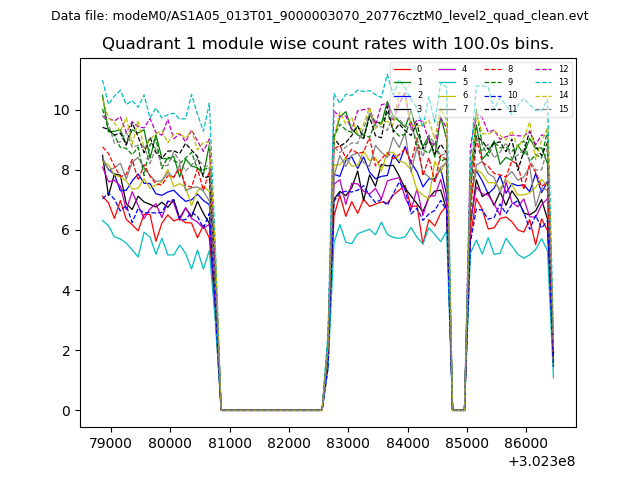
| Module-wise count rates for Quadrant A Data is divided into 100 sec bins |
 |
 |
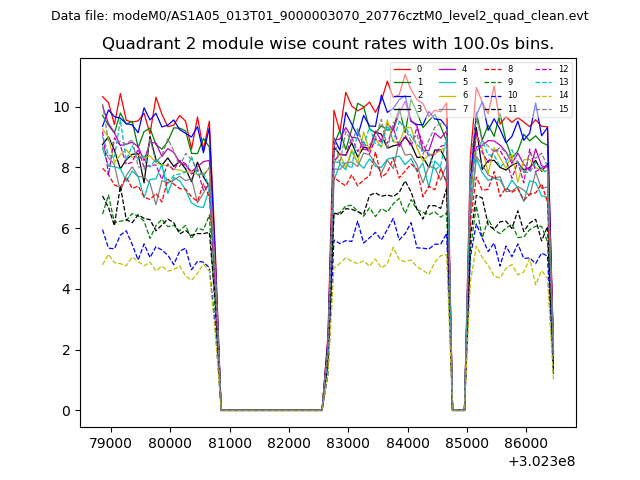
| Module-wise count rates for Quadrant B Data is divided into 100 sec bins |
 |
 |
| Module-wise count rates for Quadrant C Data is divided into 100 sec bins |
 |
 |
| Module-wise count rates for Quadrant D Data is divided into 100 sec bins |
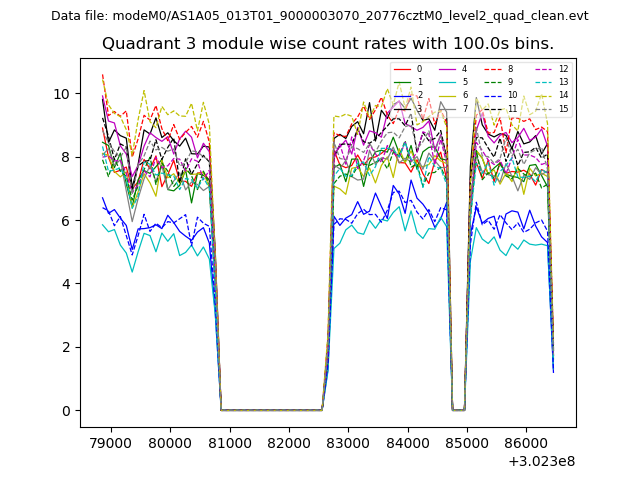 |
 |
| Parameter | Plot |
|---|---|
| CZT HV Monitor | 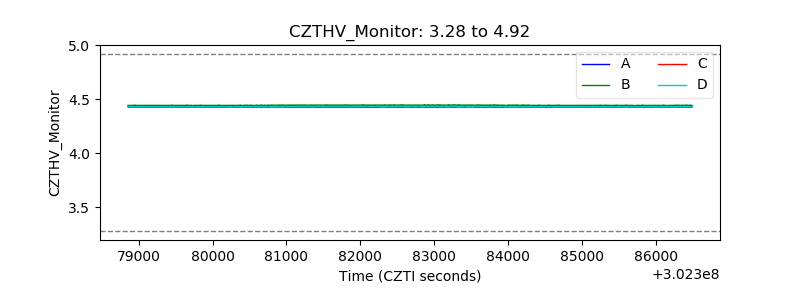 |
| D_VDD | 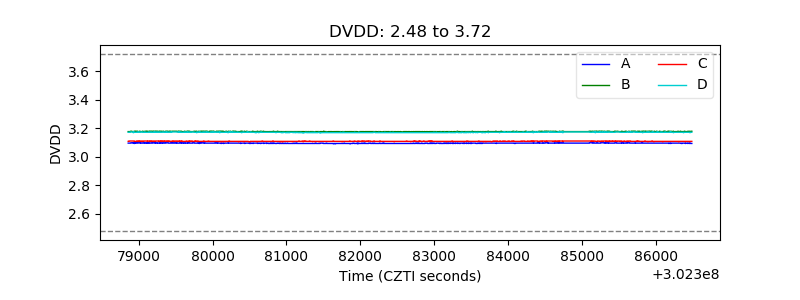 |
| Temperature 1 | 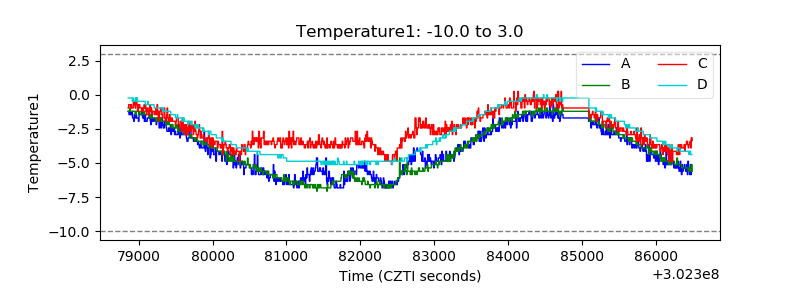 |
| Veto HV Monitor | 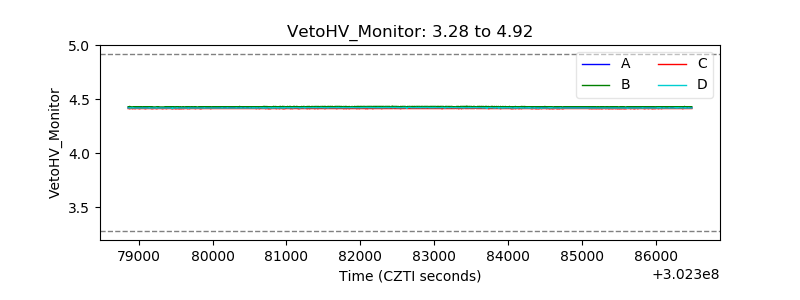 |
| Veto LLD | 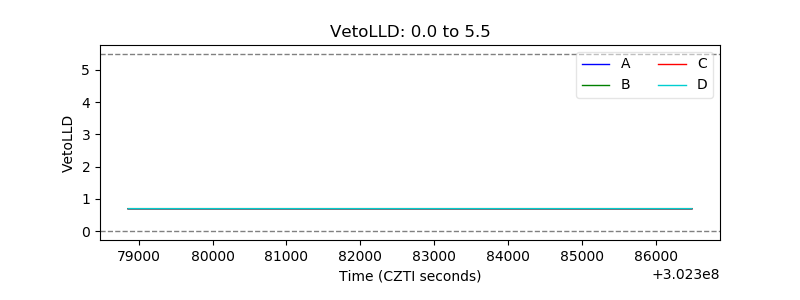 |
| Alpha Counter | 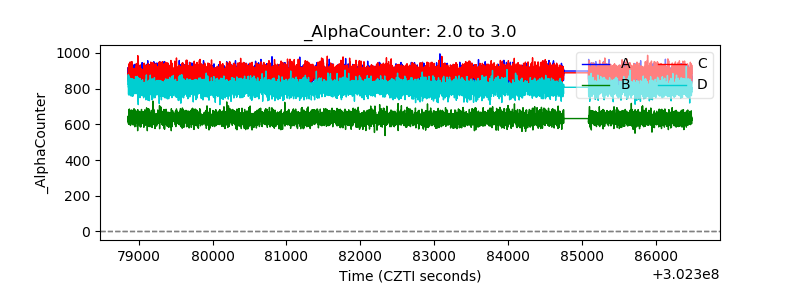 |
| _CPM_Rate | 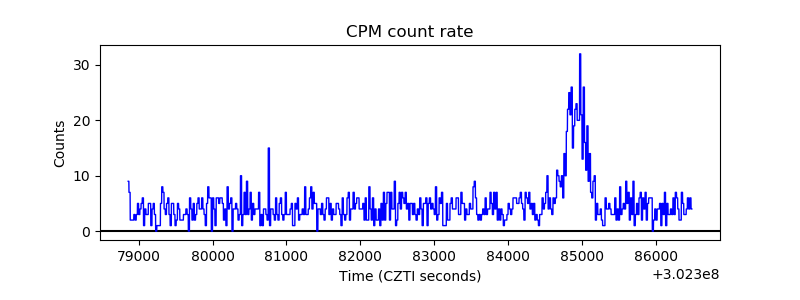 |
| CZT Counter | 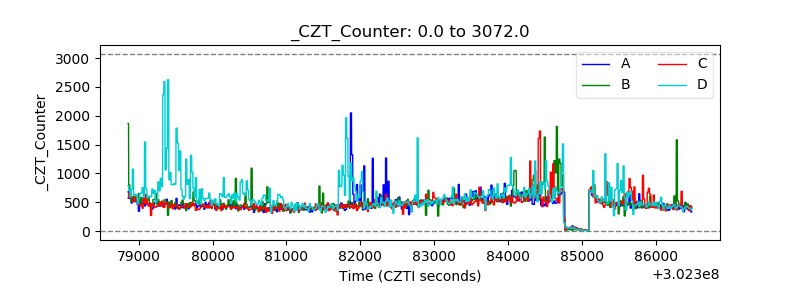 |
| +2.5 Volts monitor |  |
| +5 Volts monitor |  |
| _ROLL_ROT | 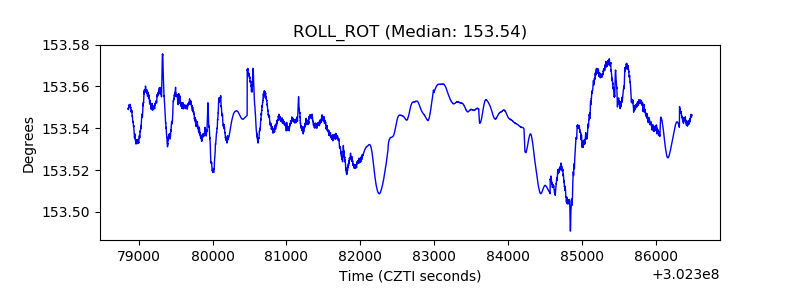 |
| _Roll_DEC |  |
| _Roll_RA | 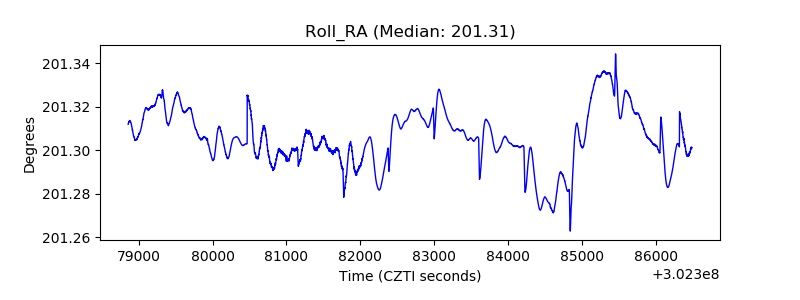 |
| Veto Counter | 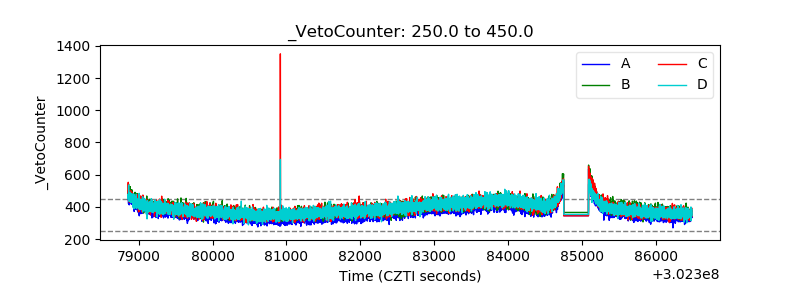 |