| Param | Original file | Final file |
|---|---|---|
| Filename | modeM0/AS1A05_013T01_9000003070_20777cztM0_level2.evt | modeM0/AS1A05_013T01_9000003070_20777cztM0_level2_quad_clean.evt |
| Size (bytes) | 324,000,000 | 58,737,600 |
| Size | 309.0 MB | 56.0 MB |
| Events in quadrant A | 1,838,578 | 402,878 |
| Events in quadrant B | 1,954,504 | 401,845 |
| Events in quadrant C | 1,873,822 | 390,998 |
| Events in quadrant D | 3,883,601 | 311,693 |
| Mode SS | |||
|---|---|---|---|
| Quadrant | BADHDUFLAG | Total packets | Discarded packets |
| A | 0 | 116 | 38 |
| B | 0 | 116 | 38 |
| C | 0 | 118 | 40 |
| D | 0 | 118 | 42 |
| Mode M0 | |||
|---|---|---|---|
| Quadrant | BADHDUFLAG | Total packets | Discarded packets |
| A | 0 | 11559 | 3598 |
| B | 0 | 11977 | 3734 |
| C | 0 | 12294 | 4293 |
| D | 0 | 22912 | 8977 |
| Mode M9 | |||
|---|---|---|---|
| Quadrant | BADHDUFLAG | Total packets | Discarded packets |
| A | 0 | 5 | 0 |
| B | 0 | 5 | 0 |
| C | 0 | 5 | 0 |
| D | 0 | 5 | 0 |
| Quadrant | Total seconds | Saturated seconds | Saturation percentage |
|---|---|---|---|
| A | 3914 | 18 | 0.459888% |
| B | 3907 | 34 | 0.870233% |
| C | 3880 | 27 | 0.695876% |
| D | 3628 | 854 | 23.539140% |
Noise dominated data is calculated using 1-second bins in cleaned event files. If a bin has >2000 counts, and if more than 50% of those come from <1% of pixels, then it is considered to be noise-dominated and hence unusable.
| Quadrant | # 1 sec bins | Bins with >0 counts | Bins with >2000 counts | High rate bins dominated by noise | Noise dominated (total time) | Noise dominated (detector-on time) | Marked lightcurve |
|---|---|---|---|---|---|---|---|
| A | 6252 | 4201 | 0 | 0 | 0.00% | 0.00% | 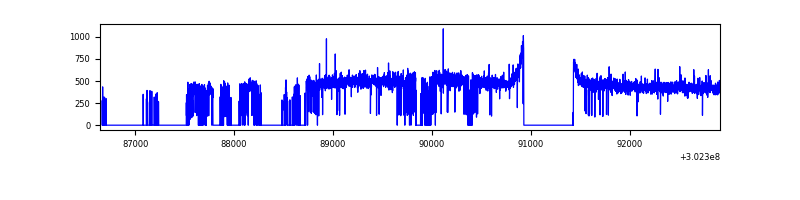 |
| B | 6271 | 4202 | 11 | 11 | 0.18% | 0.26% | 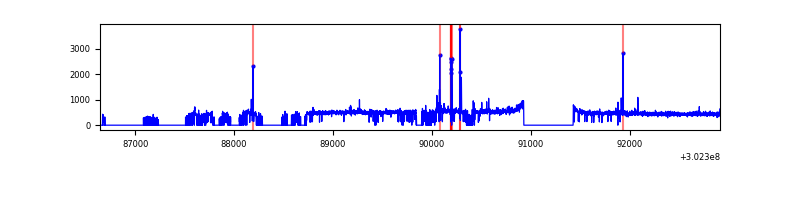 |
| C | 6234 | 4149 | 1 | 1 | 0.02% | 0.02% | 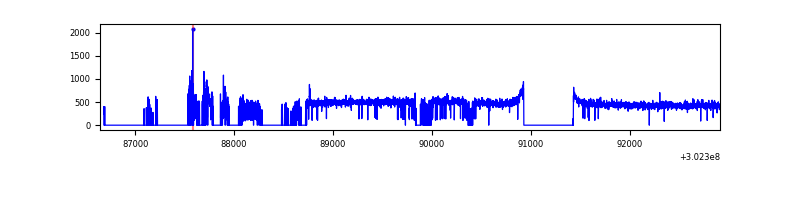 |
| D | 6236 | 3811 | 768 | 768 | 12.32% | 20.15% | 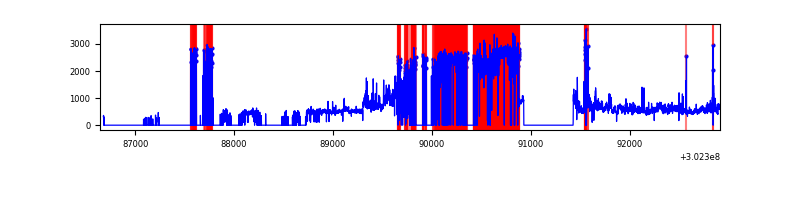 |
Top three noisy pixels from each quadrant. If the there are fewer than three noisy pixels in the level2.evt file, extra rows are filled as -1
| Pixel properties | Quadrant properties | ||||||
|---|---|---|---|---|---|---|---|
| Quadrant | DetID | PixID | Counts | Sigma | Mean | Median | Sigma |
| A | 0 | 226 | 4144 | 37.62 | 478 | 467 | 97.7 |
| A | 3 | 137 | 3914 | 35.27 | 478 | 467 | 97.7 |
| A | 12 | 194 | 3463 | 30.66 | 478 | 467 | 97.7 |
| B | 3 | 64 | 39272 | 424.34 | 469 | 456 | 91.5 |
| B | 0 | 189 | 21788 | 233.2 | 469 | 456 | 91.5 |
| B | 7 | 220 | 18462 | 196.84 | 469 | 456 | 91.5 |
| C | 14 | 238 | 70246 | 661.07 | 448 | 451 | 105.6 |
| C | 9 | 54 | 54003 | 507.22 | 448 | 451 | 105.6 |
| C | 13 | 61 | 3168 | 25.73 | 448 | 451 | 105.6 |
| D | 1 | 20 | 1552338 | 16556.45 | 382 | 371 | 93.7 |
| D | 1 | 52 | 707855 | 7547.47 | 382 | 371 | 93.7 |
| D | 12 | 227 | 63675 | 675.33 | 382 | 371 | 93.7 |
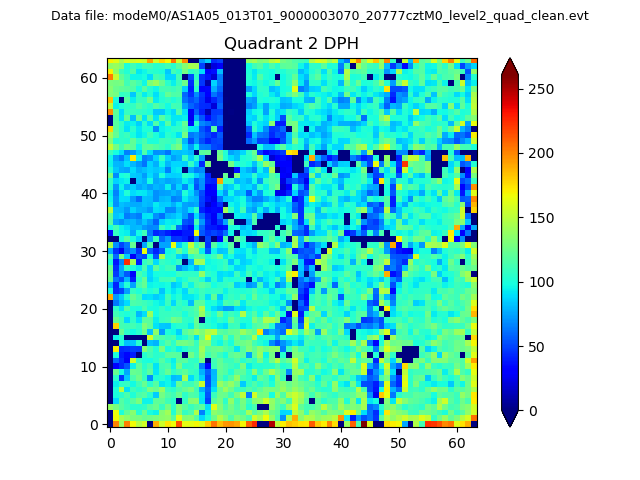
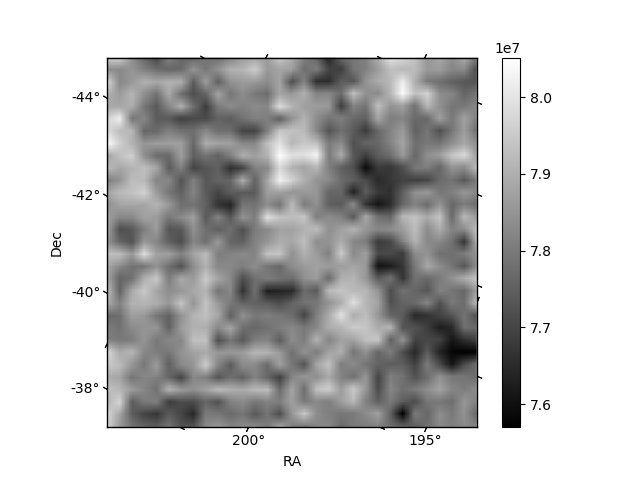
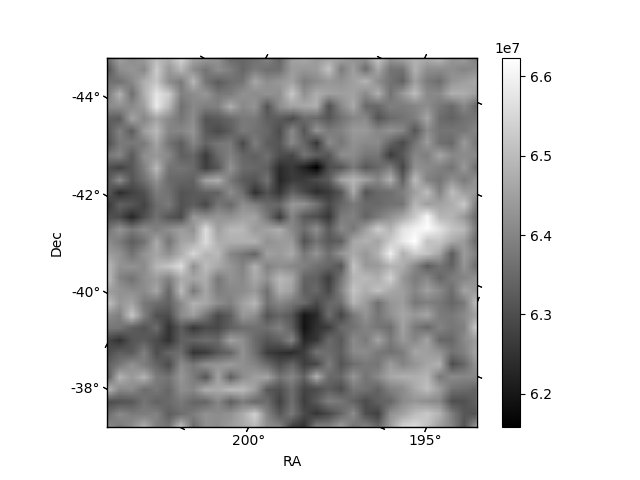
Histogram calculated using DETX and DETY for each event in the final _common_clean file
| Quadrant A | 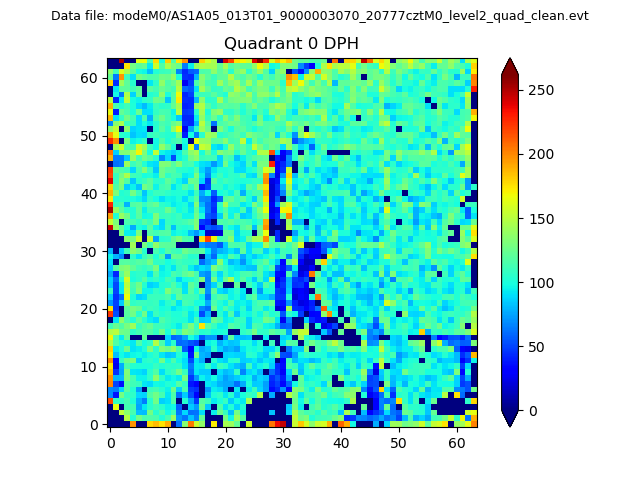 |
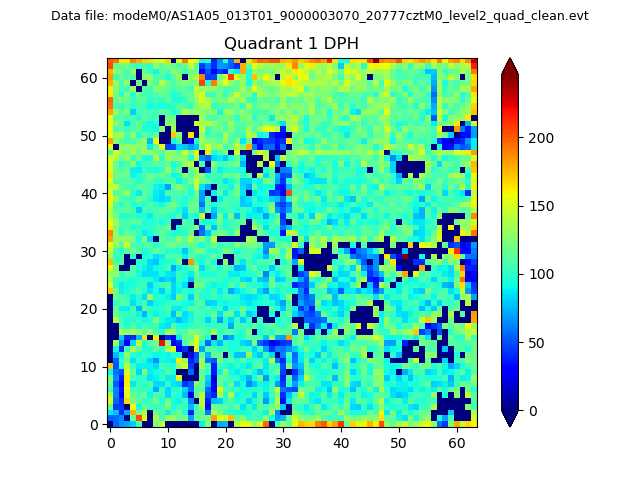 |
Quadrant B |
|---|---|---|---|
| Quadrant D | 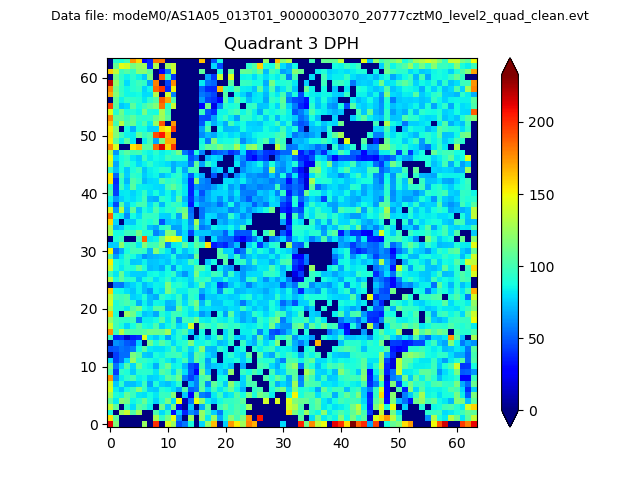 |
 |
Quadrant C |
| Plot type | Count rate plots | Images |
|---|---|---|
| Comparison with Poisson distribution Blue bars denote a histogram of data divided into 1 sec bins. Red curve is a Poisson curve with rate = median count rate of data. |
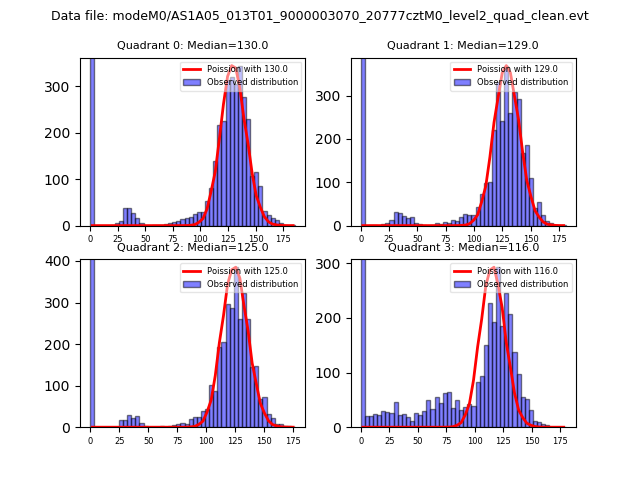 |
 |
| Quadrant-wise count rates Data is divided into 100 sec bins |
 |
|
| Module-wise count rates for Quadrant A Data is divided into 100 sec bins |
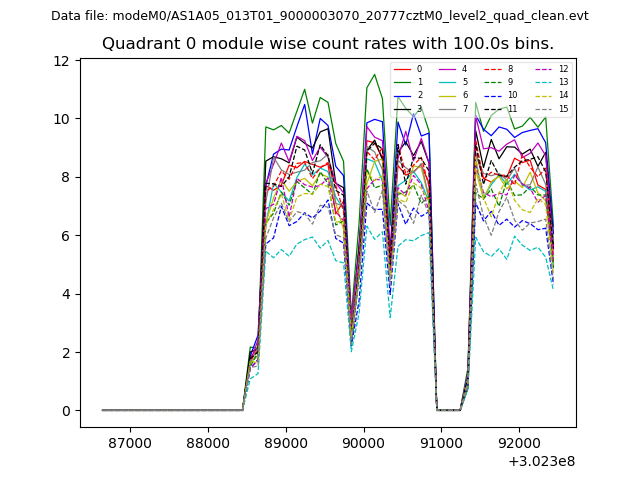 |
 |
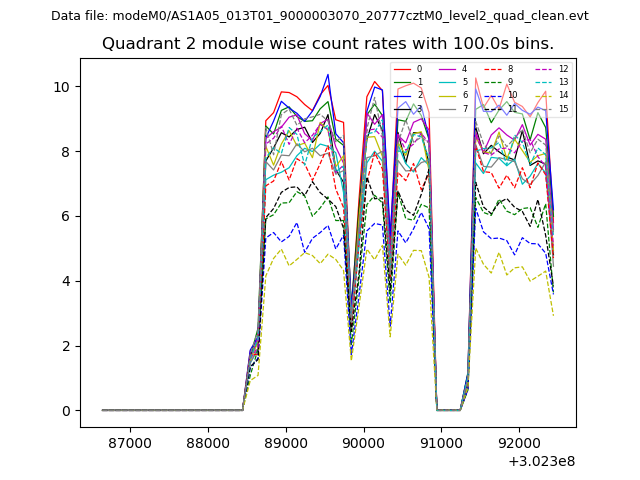
| Module-wise count rates for Quadrant B Data is divided into 100 sec bins |
 |
 |
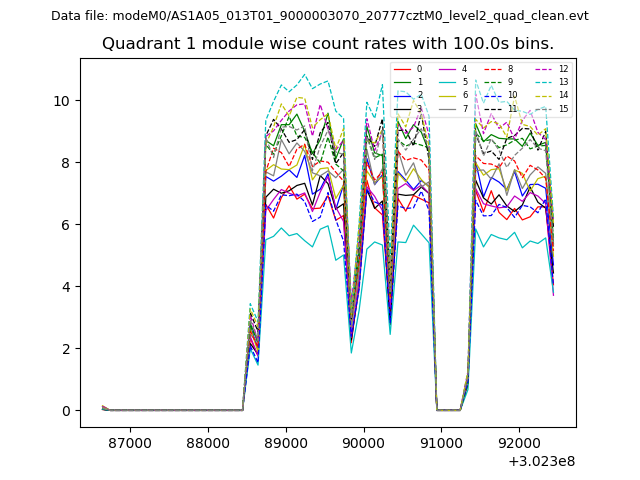
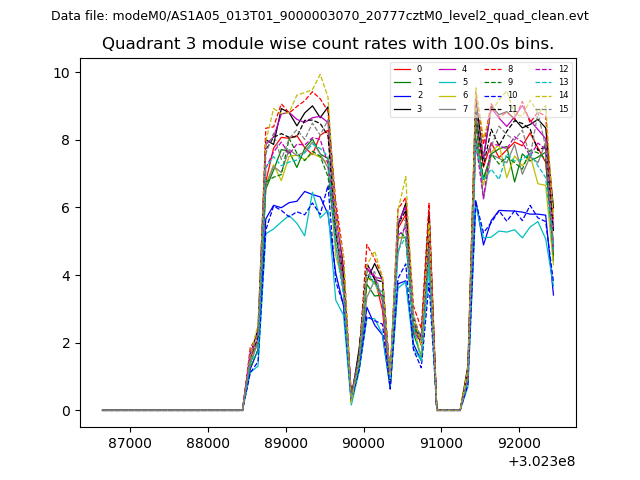
| Module-wise count rates for Quadrant C Data is divided into 100 sec bins |
 |
 |
| Module-wise count rates for Quadrant D Data is divided into 100 sec bins |
 |
 |
| Parameter | Plot |
|---|---|
| CZT HV Monitor | 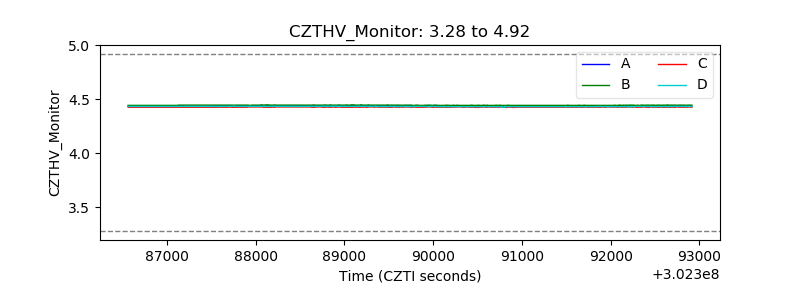 |
| D_VDD | 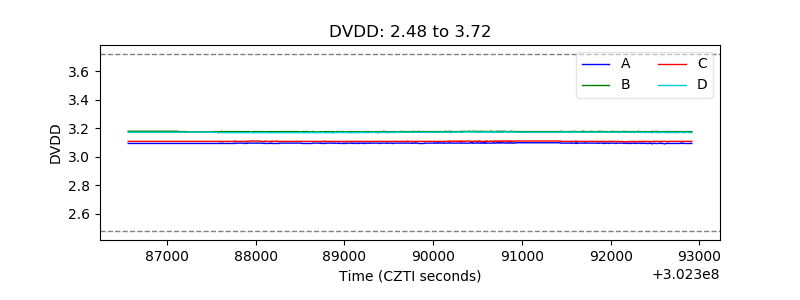 |
| Temperature 1 | 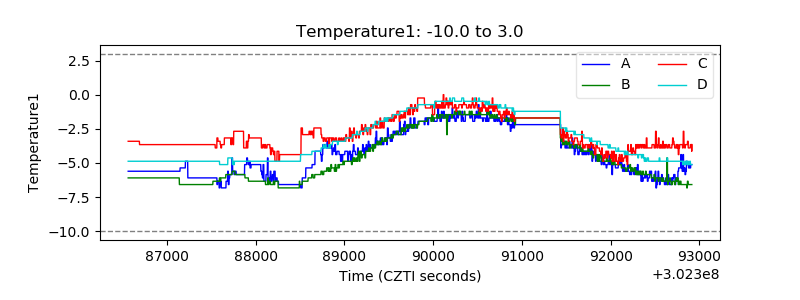 |
| Veto HV Monitor | 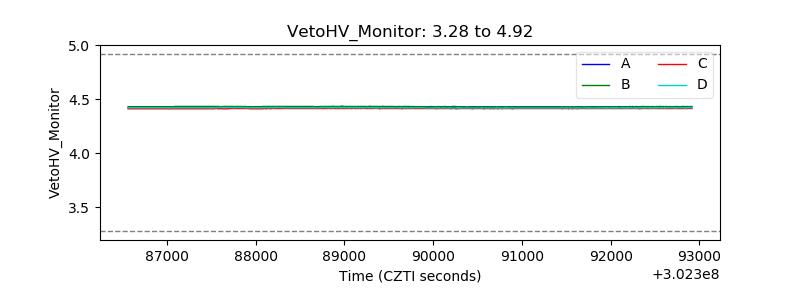 |
| Veto LLD | 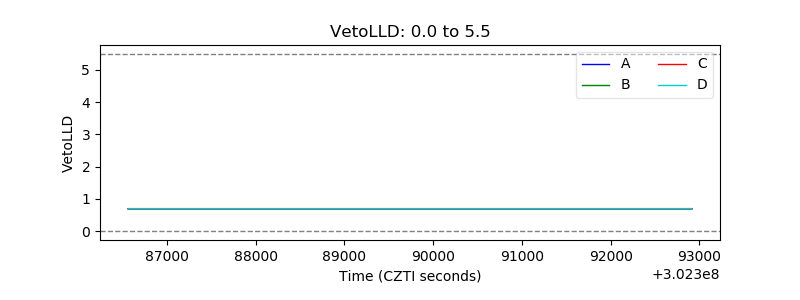 |
| Alpha Counter | 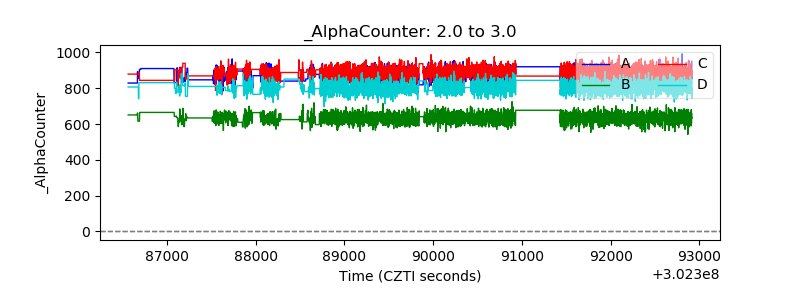 |
| _CPM_Rate |  |
| CZT Counter | 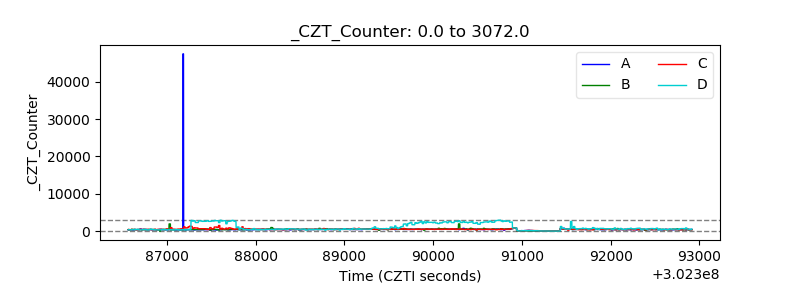 |
| +2.5 Volts monitor |  |
| +5 Volts monitor | 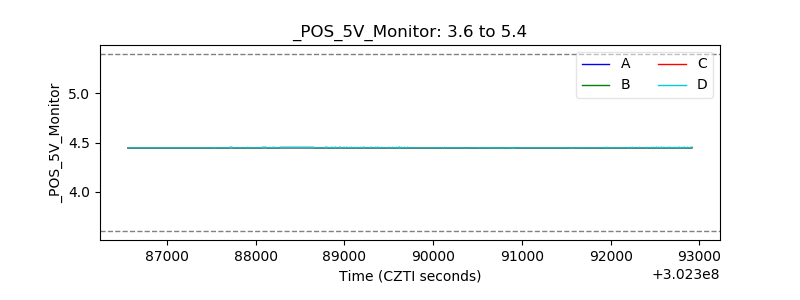 |
| _ROLL_ROT | 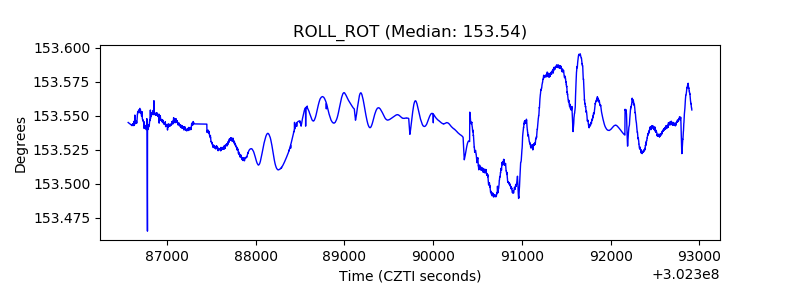 |
| _Roll_DEC | 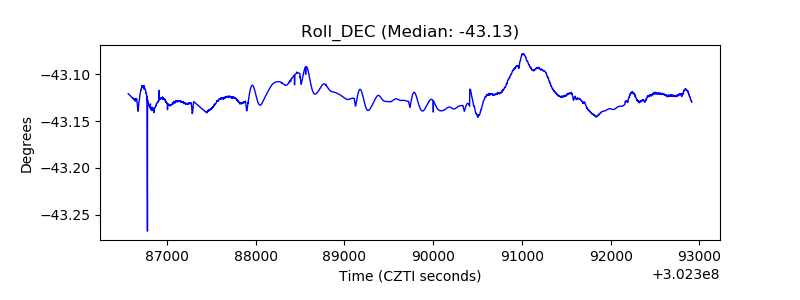 |
| _Roll_RA | 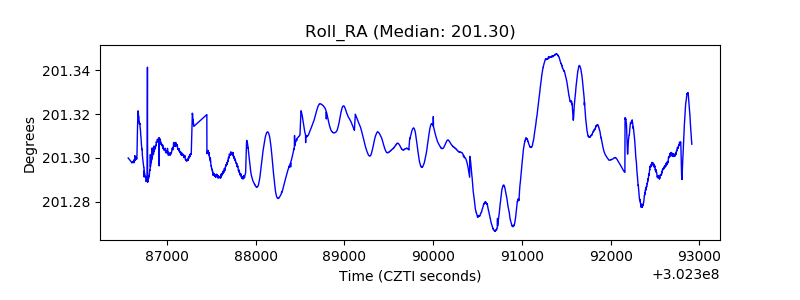 |
| Veto Counter | 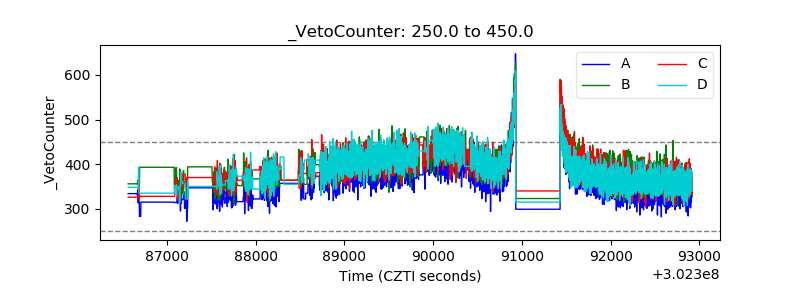 |