| Param | Original file | Final file |
|---|---|---|
| Filename | modeM0/AS1A05_013T01_9000003070_20779cztM0_level2.evt | modeM0/AS1A05_013T01_9000003070_20779cztM0_level2_quad_clean.evt |
| Size (bytes) | 601,404,480 | 107,565,120 |
| Size | 573.5 MB | 102.6 MB |
| Events in quadrant A | 3,923,845 | 686,019 |
| Events in quadrant B | 4,505,866 | 676,281 |
| Events in quadrant C | 3,941,788 | 660,274 |
| Events in quadrant D | 5,268,610 | 647,639 |
| Mode SS | |||
|---|---|---|---|
| Quadrant | BADHDUFLAG | Total packets | Discarded packets |
| A | 0 | 176 | 6 |
| B | 0 | 176 | 4 |
| C | 0 | 176 | 2 |
| D | 0 | 176 | 4 |
| Mode M0 | |||
|---|---|---|---|
| Quadrant | BADHDUFLAG | Total packets | Discarded packets |
| A | 0 | 17654 | 534 |
| B | 0 | 19308 | 554 |
| C | 0 | 17639 | 503 |
| D | 0 | 21769 | 669 |
| Mode M9 | |||
|---|---|---|---|
| Quadrant | BADHDUFLAG | Total packets | Discarded packets |
| A | 0 | 15 | 0 |
| B | 0 | 15 | 1 |
| C | 0 | 15 | 1 |
| D | 0 | 15 | 1 |
| Quadrant | Total seconds | Saturated seconds | Saturation percentage |
|---|---|---|---|
| A | 8453 | 31 | 0.366734% |
| B | 8453 | 90 | 1.064711% |
| C | 8466 | 55 | 0.649657% |
| D | 8441 | 166 | 1.966592% |
Noise dominated data is calculated using 1-second bins in cleaned event files. If a bin has >2000 counts, and if more than 50% of those come from <1% of pixels, then it is considered to be noise-dominated and hence unusable.
| Quadrant | # 1 sec bins | Bins with >0 counts | Bins with >2000 counts | High rate bins dominated by noise | Noise dominated (total time) | Noise dominated (detector-on time) | Marked lightcurve |
|---|---|---|---|---|---|---|---|
| A | 10133 | 8595 | 0 | 0 | 0.00% | 0.00% | 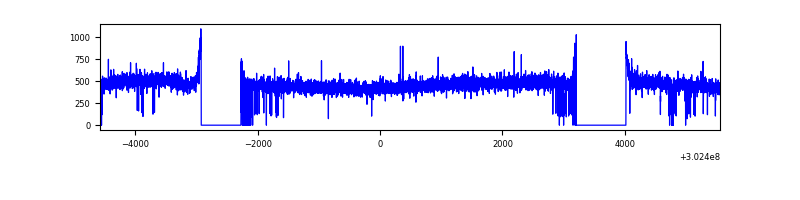 |
| B | 10138 | 8594 | 29 | 29 | 0.29% | 0.34% | 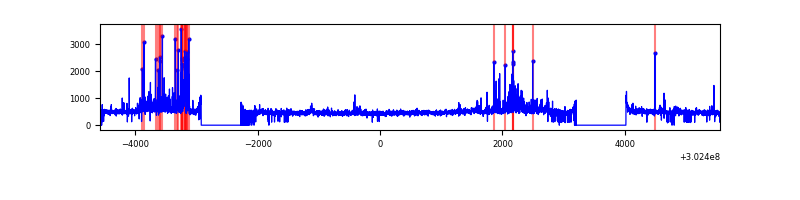 |
| C | 10128 | 8594 | 1 | 1 | 0.01% | 0.01% | 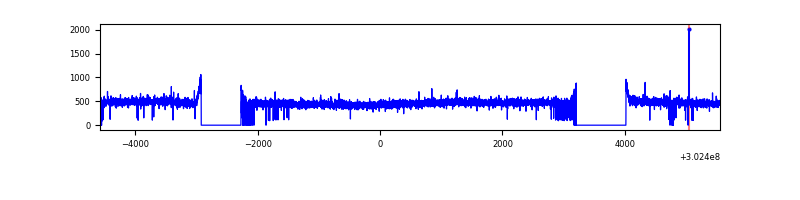 |
| D | 10133 | 8589 | 106 | 106 | 1.05% | 1.23% | 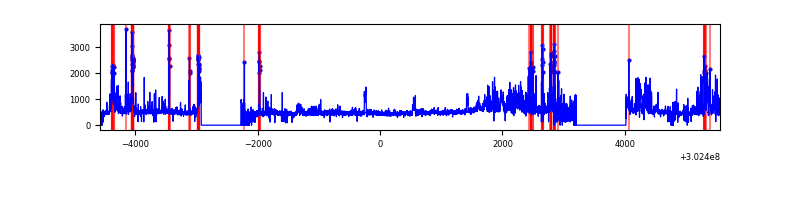 |
Top three noisy pixels from each quadrant. If the there are fewer than three noisy pixels in the level2.evt file, extra rows are filled as -1
| Pixel properties | Quadrant properties | ||||||
|---|---|---|---|---|---|---|---|
| Quadrant | DetID | PixID | Counts | Sigma | Mean | Median | Sigma |
| A | 0 | 226 | 8980 | 39.09 | 1019 | 999 | 204.2 |
| A | 3 | 137 | 8231 | 35.42 | 1019 | 999 | 204.2 |
| A | 12 | 194 | 7300 | 30.86 | 1019 | 999 | 204.2 |
| B | 7 | 220 | 329622 | 1719.99 | 1006 | 982 | 191.1 |
| B | 0 | 189 | 63970 | 329.66 | 1006 | 982 | 191.1 |
| B | 0 | 219 | 34478 | 175.31 | 1006 | 982 | 191.1 |
| C | 14 | 238 | 151882 | 665.54 | 969 | 973 | 226.7 |
| C | 7 | 247 | 9057 | 35.65 | 969 | 973 | 226.7 |
| C | 13 | 61 | 6796 | 25.68 | 969 | 973 | 226.7 |
| D | 1 | 52 | 539013 | 2290.69 | 978 | 950 | 234.9 |
| D | 1 | 20 | 375736 | 1595.57 | 978 | 950 | 234.9 |
| D | 1 | 239 | 326105 | 1384.28 | 978 | 950 | 234.9 |
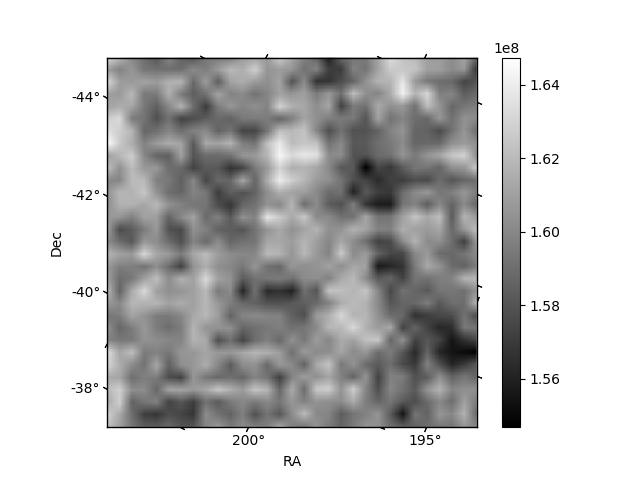
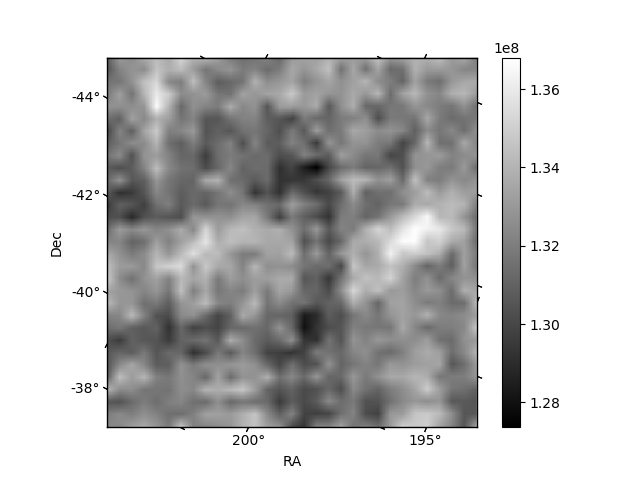
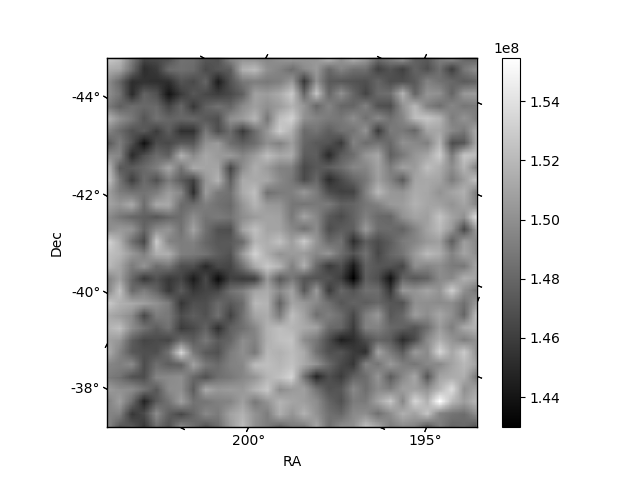
Histogram calculated using DETX and DETY for each event in the final _common_clean file
| Quadrant A | 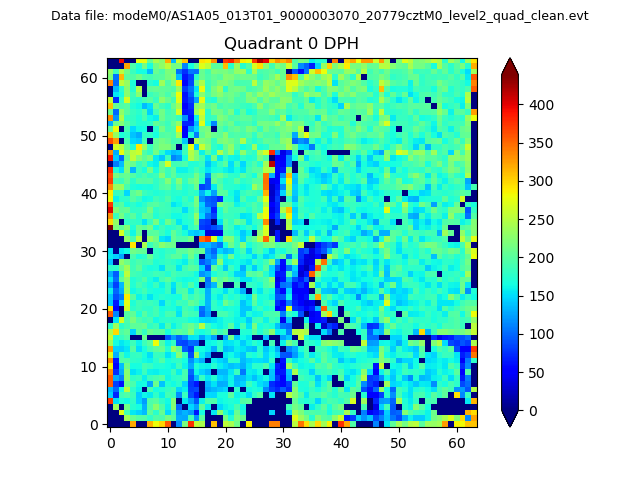 |
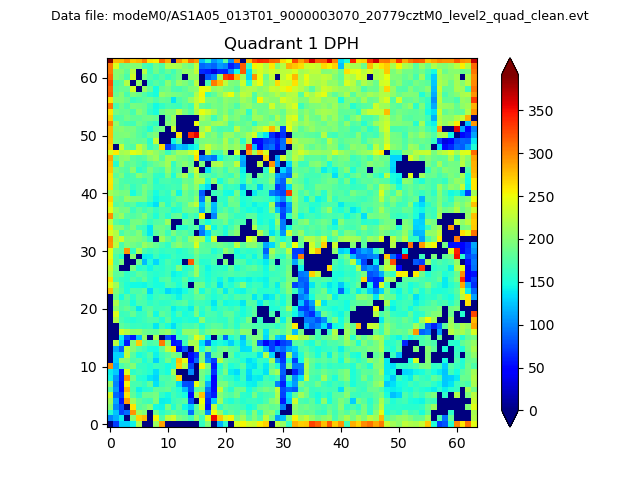 |
Quadrant B |
|---|---|---|---|
| Quadrant D |  |
 |
Quadrant C |
| Plot type | Count rate plots | Images |
|---|---|---|
| Comparison with Poisson distribution Blue bars denote a histogram of data divided into 1 sec bins. Red curve is a Poisson curve with rate = median count rate of data. |
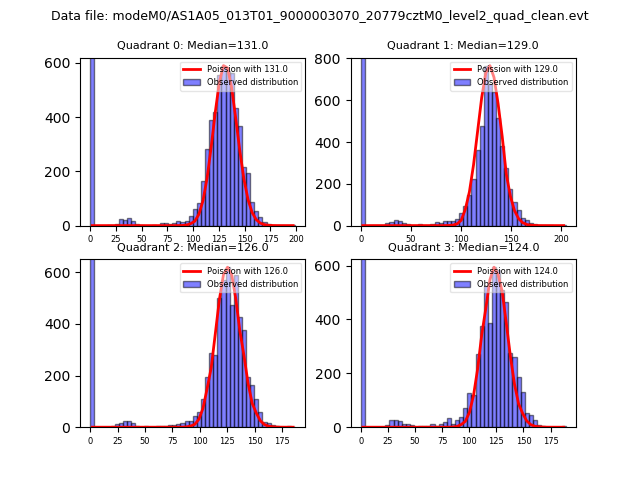 |
 |
| Quadrant-wise count rates Data is divided into 100 sec bins |
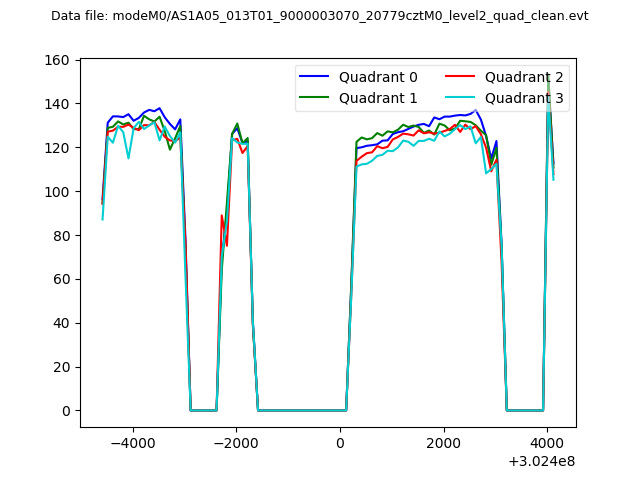 |
|
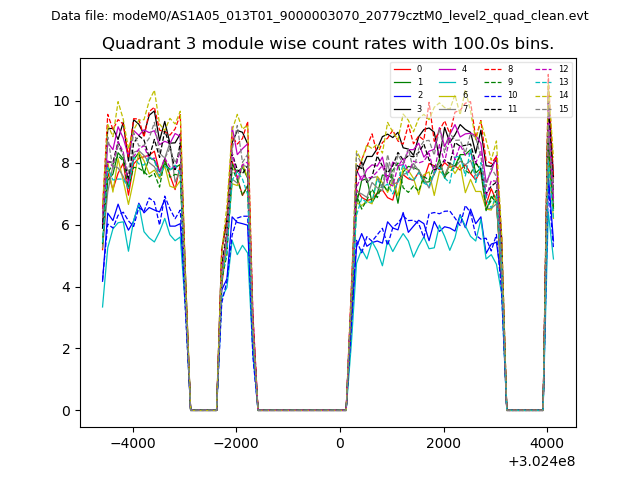
| Module-wise count rates for Quadrant A Data is divided into 100 sec bins |
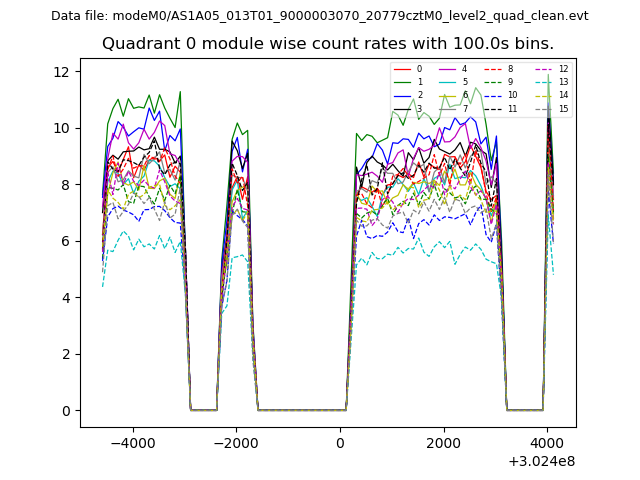 |
 |
| Module-wise count rates for Quadrant B Data is divided into 100 sec bins |
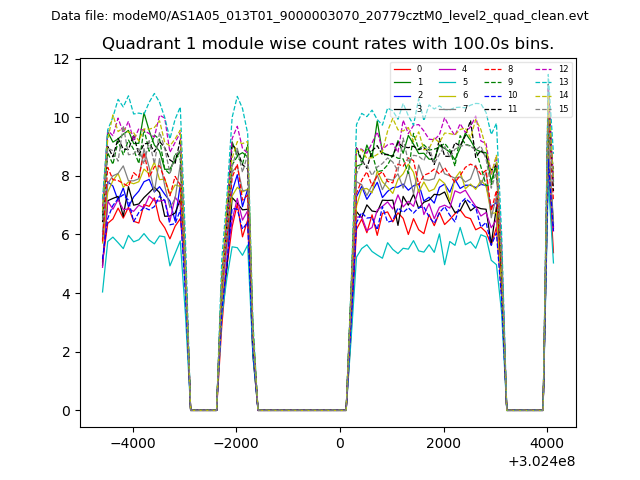 |
 |
| Module-wise count rates for Quadrant C Data is divided into 100 sec bins |
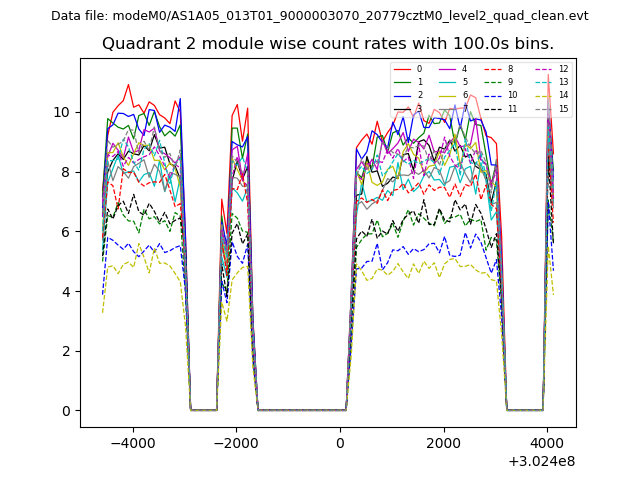 |
 |
| Module-wise count rates for Quadrant D Data is divided into 100 sec bins |
 |
 |
| Parameter | Plot |
|---|---|
| CZT HV Monitor | 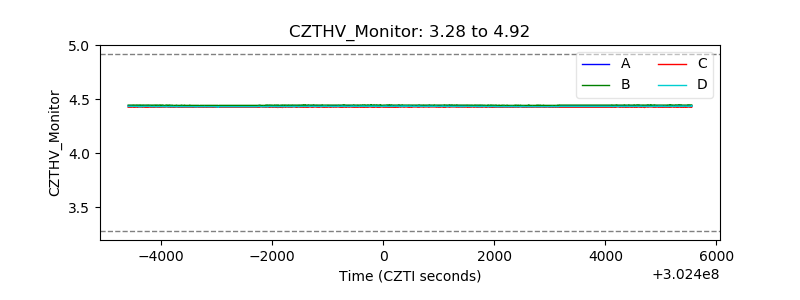 |
| D_VDD | 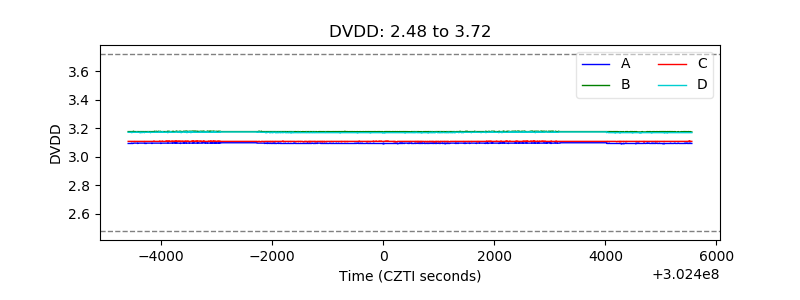 |
| Temperature 1 | 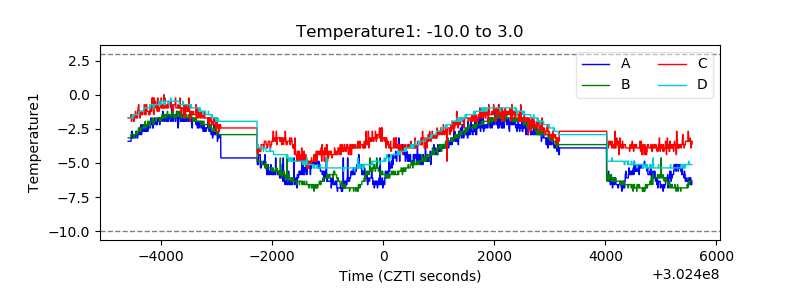 |
| Veto HV Monitor | 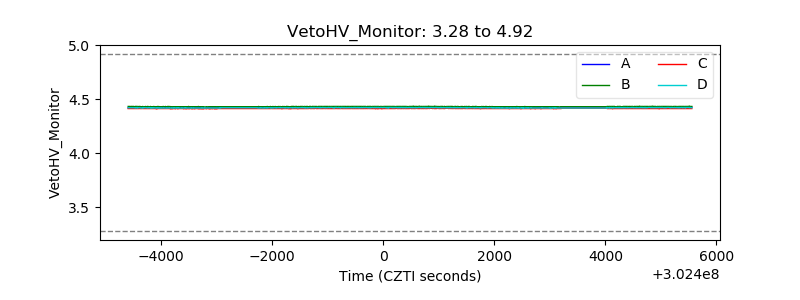 |
| Veto LLD | 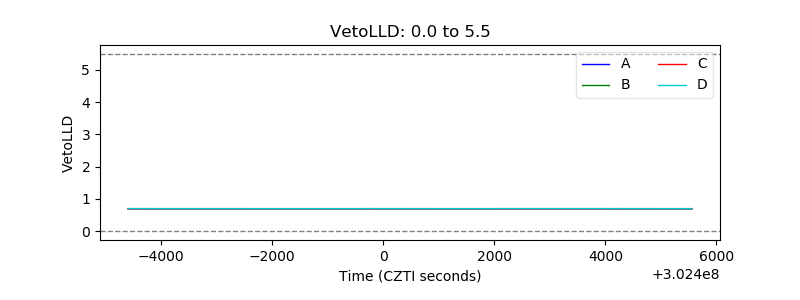 |
| Alpha Counter | 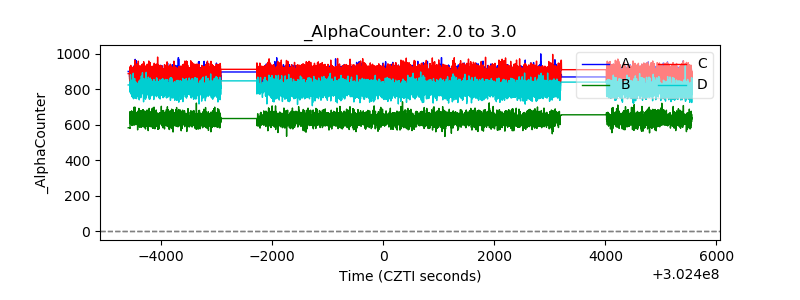 |
| _CPM_Rate | 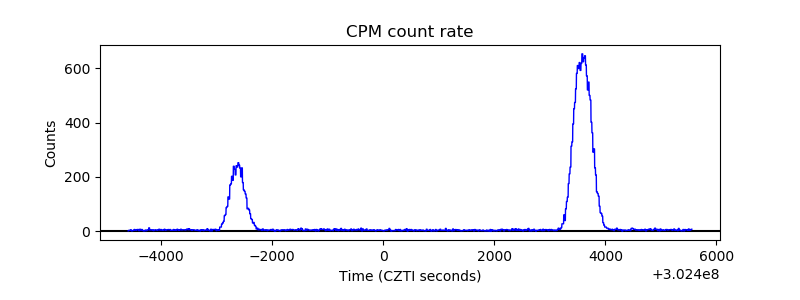 |
| CZT Counter |  |
| +2.5 Volts monitor |  |
| +5 Volts monitor | 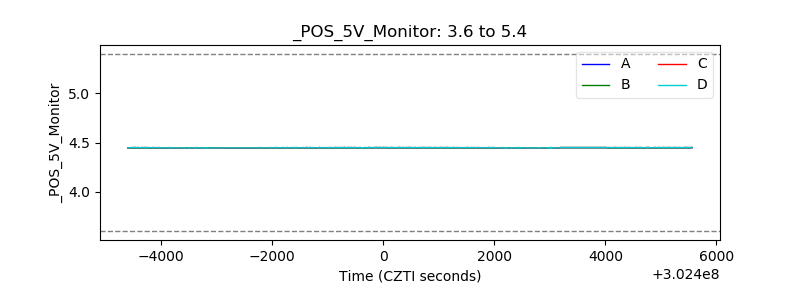 |
| _ROLL_ROT | 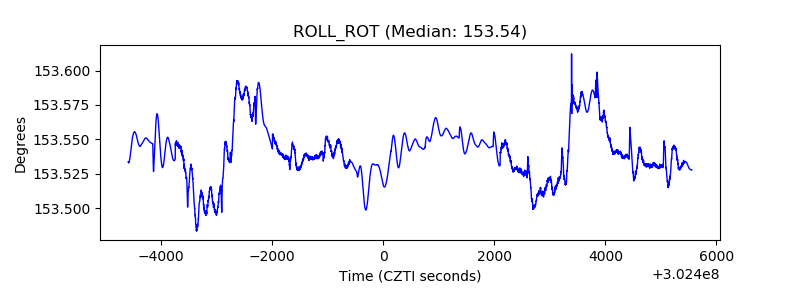 |
| _Roll_DEC | 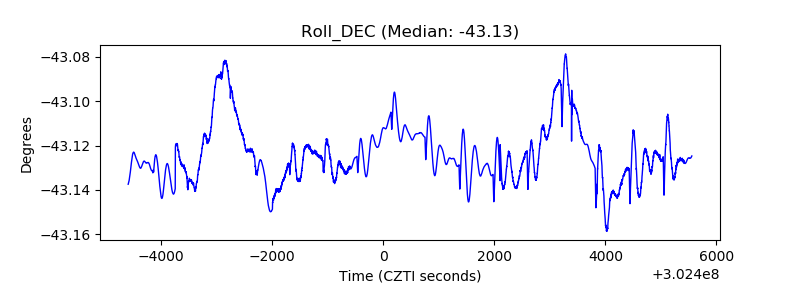 |
| _Roll_RA | 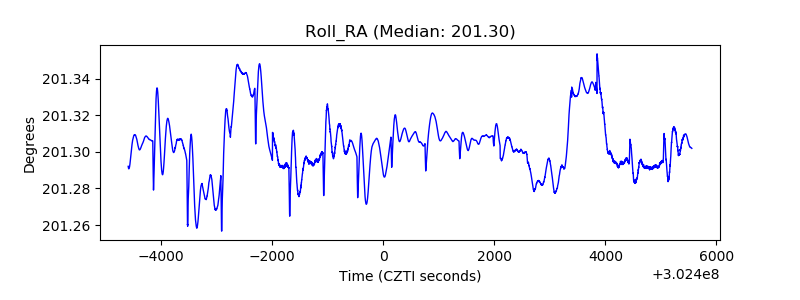 |
| Veto Counter | 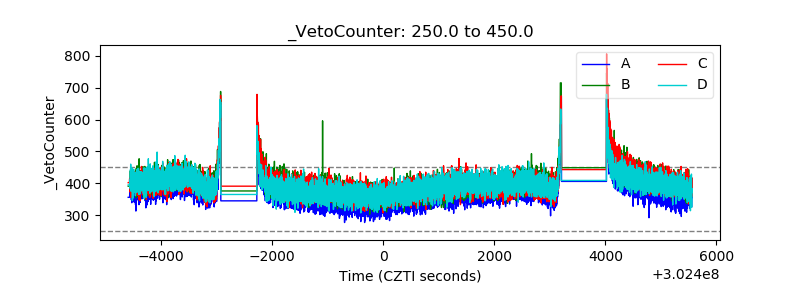 |