| Param | Original file | Final file |
|---|---|---|
| Filename | modeM0/AS1A05_013T01_9000003070_20780cztM0_level2.evt | modeM0/AS1A05_013T01_9000003070_20780cztM0_level2_quad_clean.evt |
| Size (bytes) | 192,617,280 | 25,128,000 |
| Size | 183.7 MB | 24.0 MB |
| Events in quadrant A | 1,213,101 | 144,621 |
| Events in quadrant B | 1,460,065 | 143,145 |
| Events in quadrant C | 1,269,621 | 139,780 |
| Events in quadrant D | 1,702,771 | 137,192 |
| Mode SS | |||
|---|---|---|---|
| Quadrant | BADHDUFLAG | Total packets | Discarded packets |
| A | 0 | 68 | 12 |
| B | 0 | 72 | 14 |
| C | 0 | 69 | 13 |
| D | 0 | 68 | 12 |
| Mode M0 | |||
|---|---|---|---|
| Quadrant | BADHDUFLAG | Total packets | Discarded packets |
| A | 0 | 6881 | 1405 |
| B | 0 | 7668 | 1524 |
| C | 0 | 6938 | 1402 |
| D | 0 | 8725 | 1916 |
| Mode M9 | |||
|---|---|---|---|
| Quadrant | BADHDUFLAG | Total packets | Discarded packets |
| A | 1 | 140131715414920 | 46 |
| B | 1 | -1 | -1 |
| C | 1 | -1 | -1 |
| D | 1 | -1 | -1 |
| Quadrant | Total seconds | Saturated seconds | Saturation percentage |
|---|---|---|---|
| A | 2731 | 1 | 0.036617% |
| B | 2731 | 48 | 1.757598% |
| C | 2737 | 18 | 0.657654% |
| D | 2703 | 68 | 2.515723% |
Noise dominated data is calculated using 1-second bins in cleaned event files. If a bin has >2000 counts, and if more than 50% of those come from <1% of pixels, then it is considered to be noise-dominated and hence unusable.
| Quadrant | # 1 sec bins | Bins with >0 counts | Bins with >2000 counts | High rate bins dominated by noise | Noise dominated (total time) | Noise dominated (detector-on time) | Marked lightcurve |
|---|---|---|---|---|---|---|---|
| A | 6688 | 2795 | 0 | 0 | 0.00% | 0.00% | 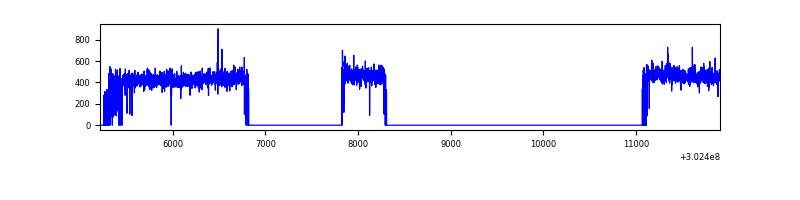 |
| B | 6651 | 2800 | 30 | 30 | 0.45% | 1.07% | 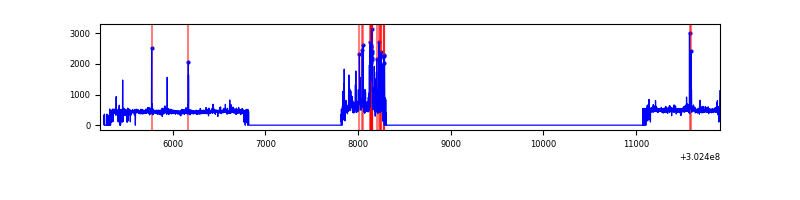 |
| C | 6663 | 2808 | 2 | 2 | 0.03% | 0.07% |  |
| D | 6641 | 2780 | 59 | 59 | 0.89% | 2.12% | 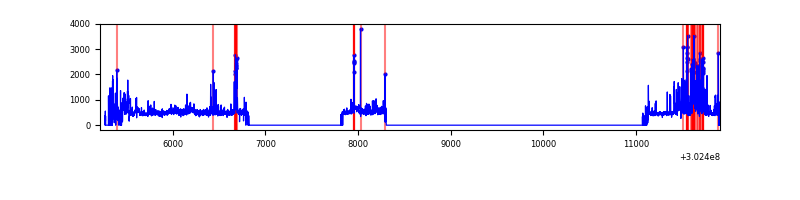 |
Top three noisy pixels from each quadrant. If the there are fewer than three noisy pixels in the level2.evt file, extra rows are filled as -1
| Pixel properties | Quadrant properties | ||||||
|---|---|---|---|---|---|---|---|
| Quadrant | DetID | PixID | Counts | Sigma | Mean | Median | Sigma |
| A | 15 | 174 | 3763 | 52.97 | 314 | 307 | 65.2 |
| A | 0 | 226 | 2706 | 36.77 | 314 | 307 | 65.2 |
| A | 3 | 137 | 2516 | 33.86 | 314 | 307 | 65.2 |
| B | 7 | 220 | 135936 | 2271.4 | 311 | 303 | 59.7 |
| B | 0 | 219 | 44809 | 745.33 | 311 | 303 | 59.7 |
| B | 6 | 36 | 35125 | 583.15 | 311 | 303 | 59.7 |
| C | 14 | 238 | 48270 | 666.9 | 305 | 306 | 71.9 |
| C | 9 | 54 | 13143 | 178.49 | 305 | 306 | 71.9 |
| C | 7 | 247 | 11789 | 159.66 | 305 | 306 | 71.9 |
| D | 13 | 153 | 201974 | 2715.43 | 302 | 293 | 74.3 |
| D | 1 | 52 | 185213 | 2489.76 | 302 | 293 | 74.3 |
| D | 1 | 239 | 94832 | 1272.87 | 302 | 293 | 74.3 |
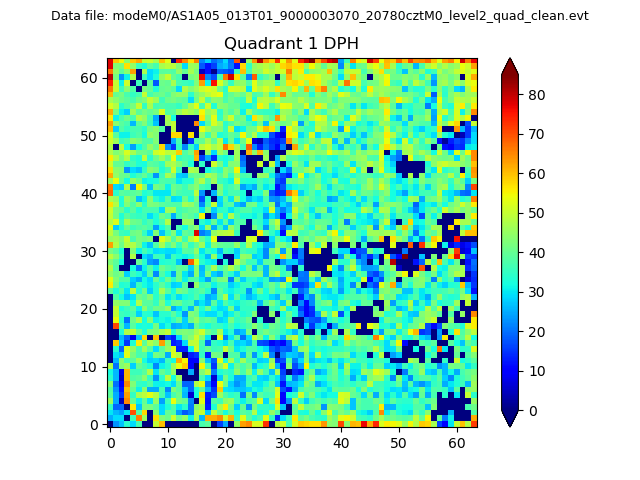
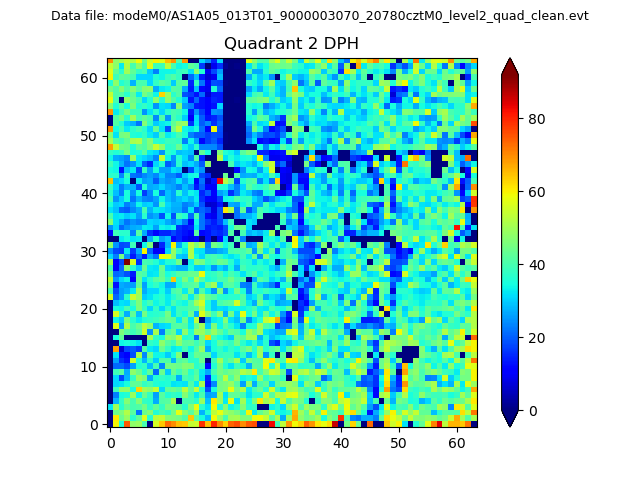
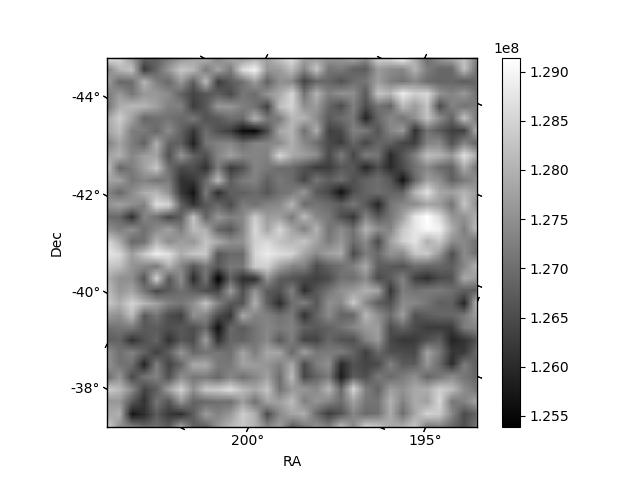
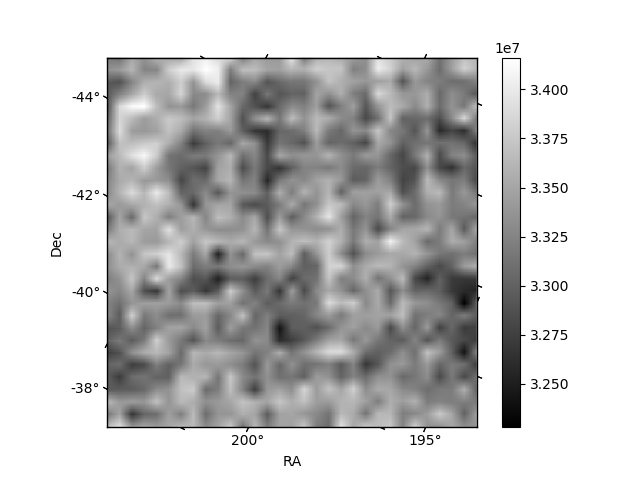
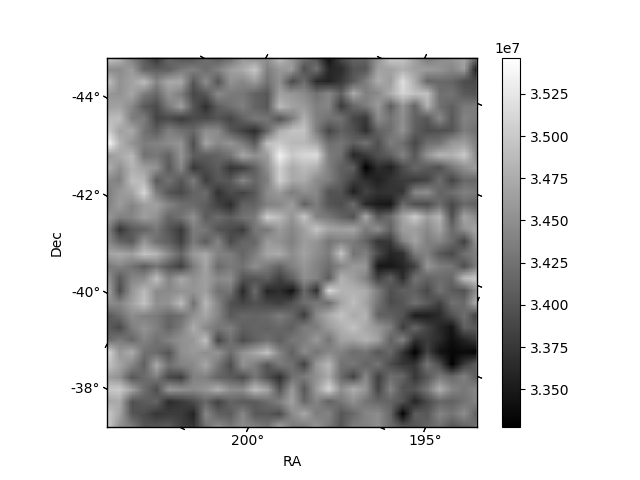
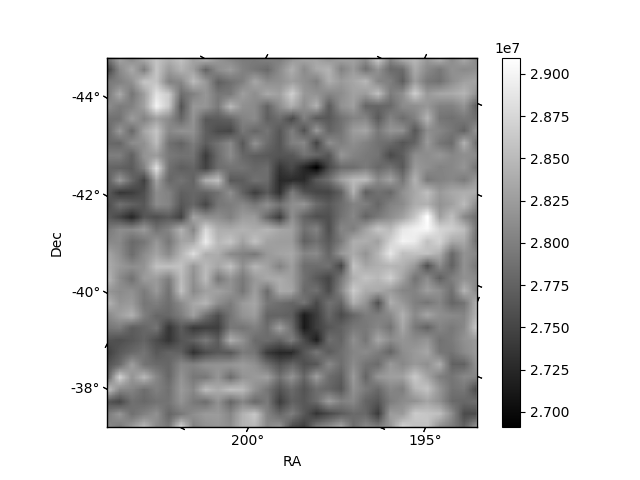
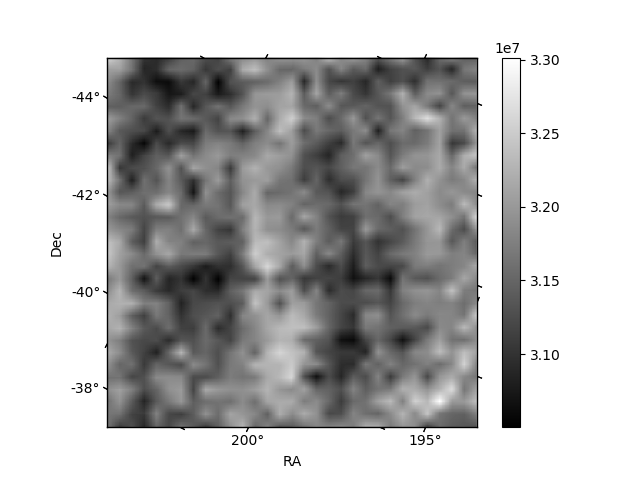
Histogram calculated using DETX and DETY for each event in the final _common_clean file
| Quadrant A | 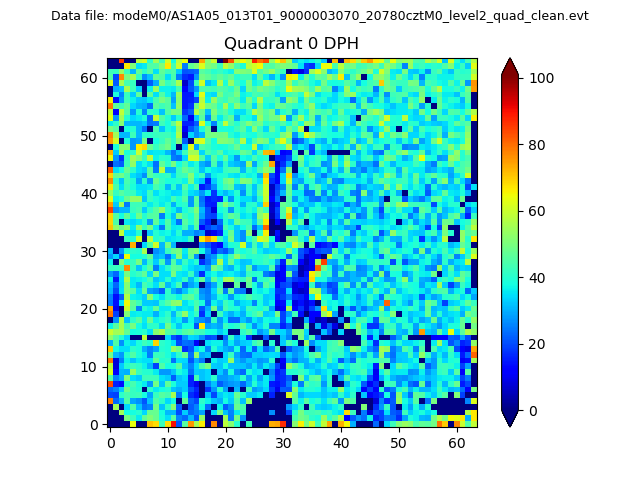 |
 |
Quadrant B |
|---|---|---|---|
| Quadrant D | 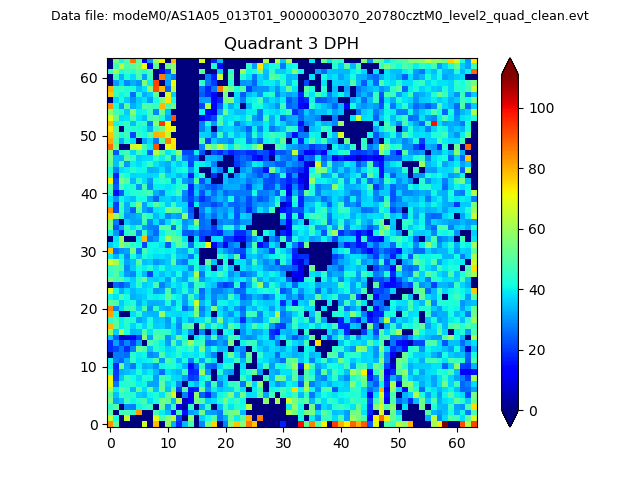 |
 |
Quadrant C |
| Plot type | Count rate plots | Images |
|---|---|---|
| Comparison with Poisson distribution Blue bars denote a histogram of data divided into 1 sec bins. Red curve is a Poisson curve with rate = median count rate of data. |
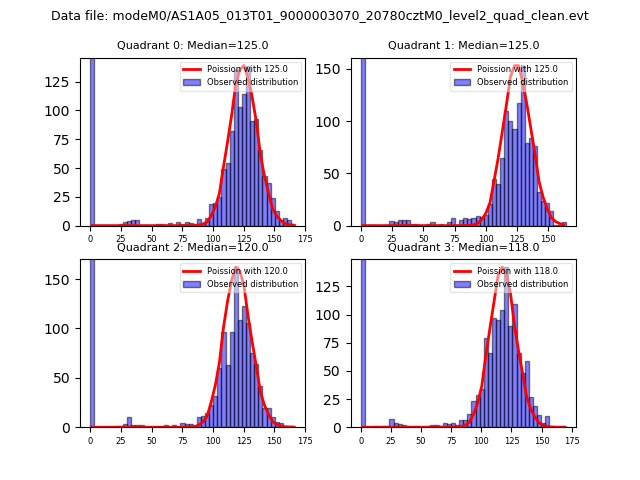 |
 |
| Quadrant-wise count rates Data is divided into 100 sec bins |
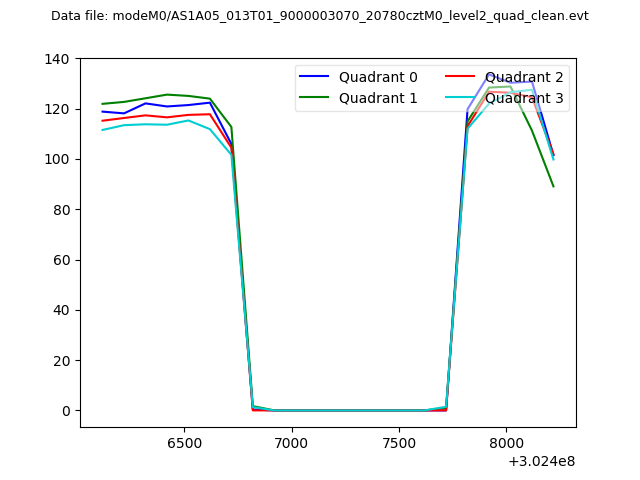 |
|
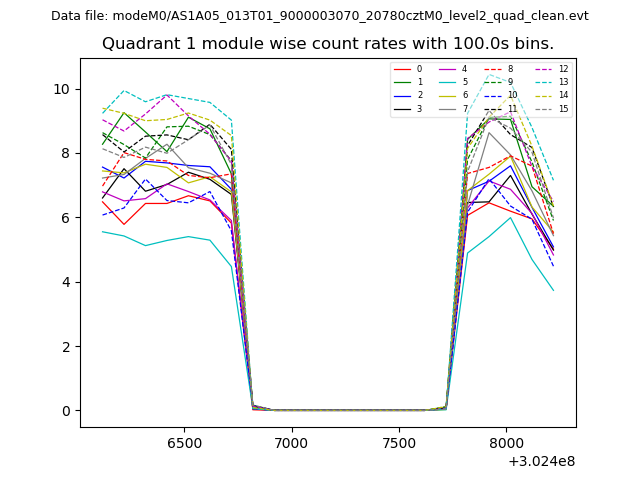
| Module-wise count rates for Quadrant A Data is divided into 100 sec bins |
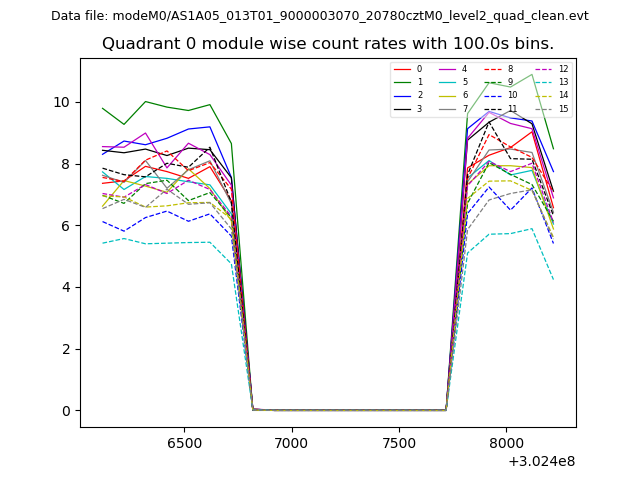 |
 |
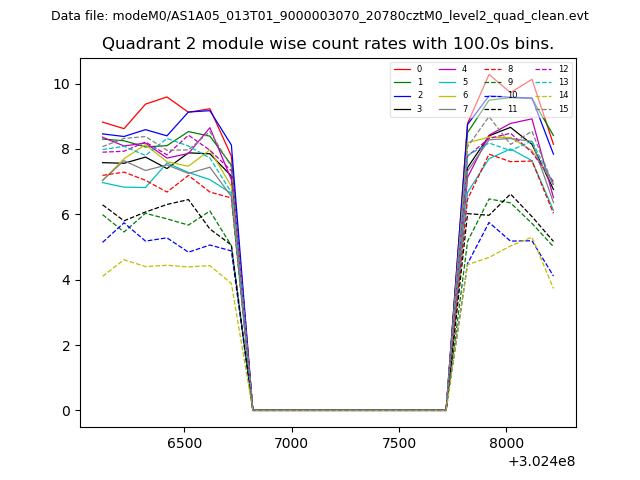
| Module-wise count rates for Quadrant B Data is divided into 100 sec bins |
 |
 |
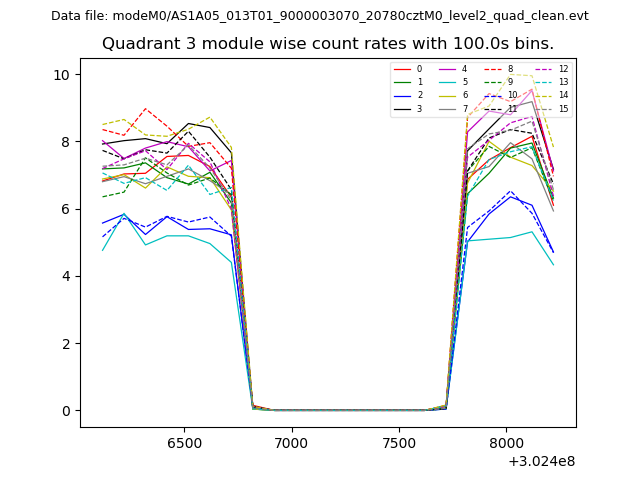
| Module-wise count rates for Quadrant C Data is divided into 100 sec bins |
 |
 |
| Module-wise count rates for Quadrant D Data is divided into 100 sec bins |
 |
 |
| Parameter | Plot |
|---|---|
| CZT HV Monitor | 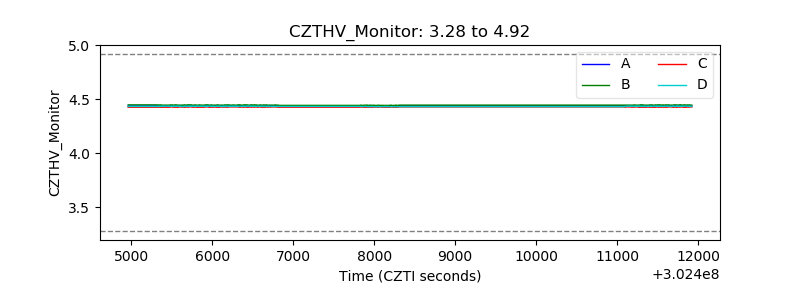 |
| D_VDD | 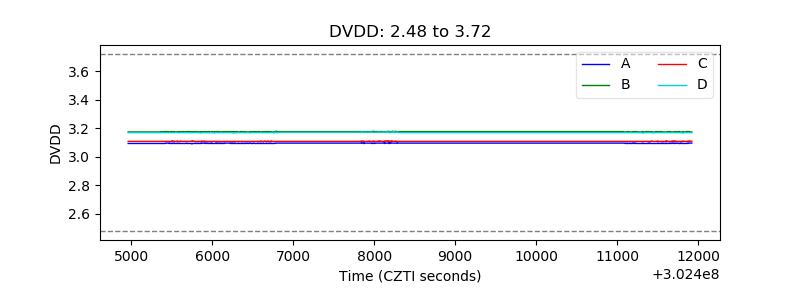 |
| Temperature 1 | 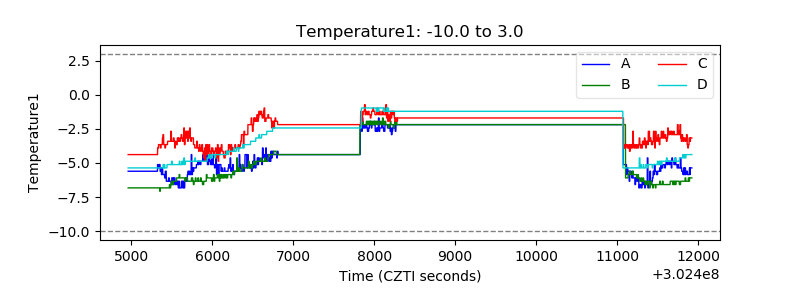 |
| Veto HV Monitor |  |
| Veto LLD | 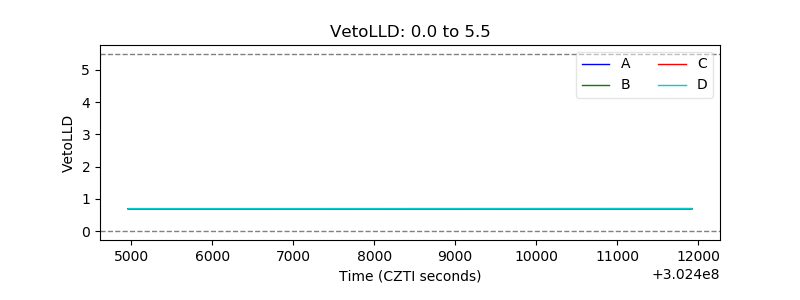 |
| Alpha Counter | 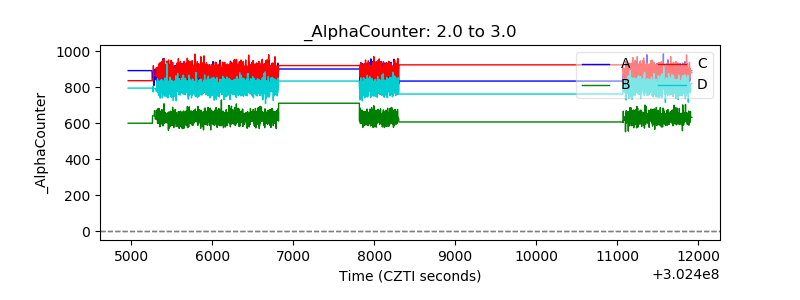 |
| _CPM_Rate | 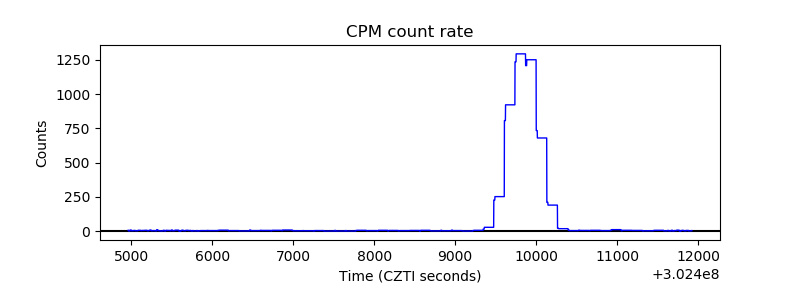 |
| CZT Counter | 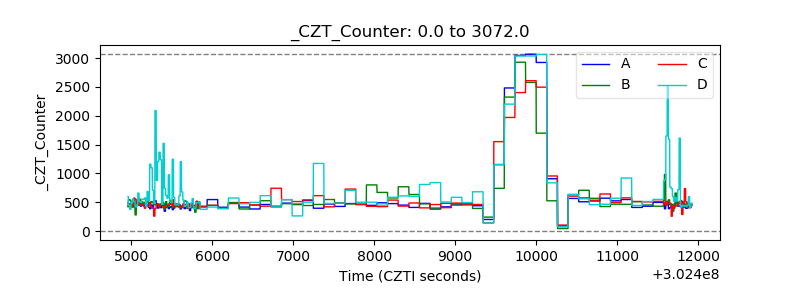 |
| +2.5 Volts monitor |  |
| +5 Volts monitor |  |
| _ROLL_ROT | 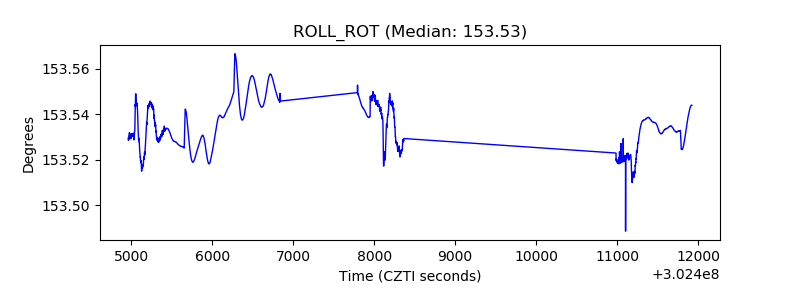 |
| _Roll_DEC | 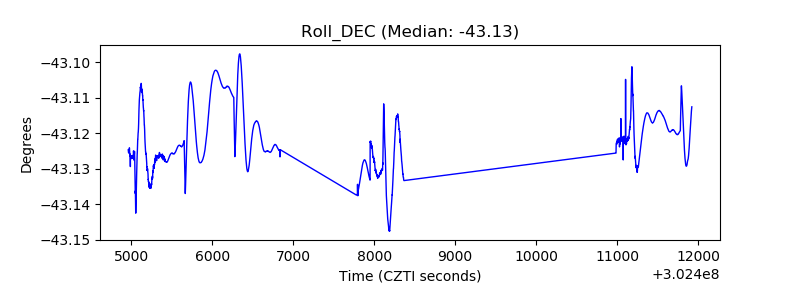 |
| _Roll_RA | 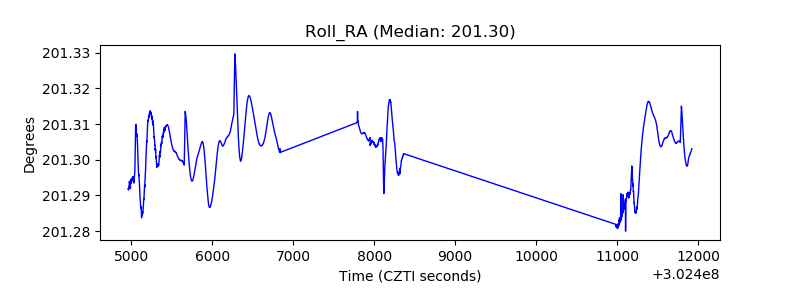 |
| Veto Counter | 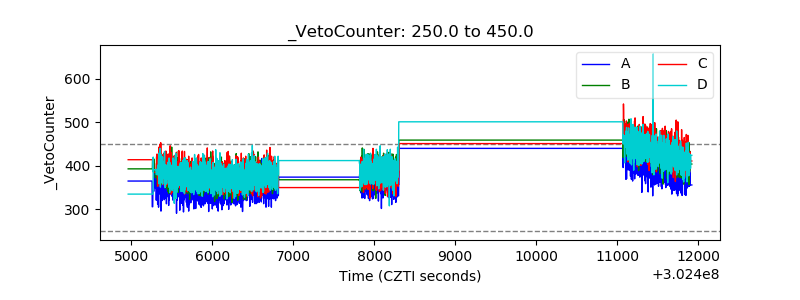 |