| Param | Original file | Final file |
|---|---|---|
| Filename | modeM0/AS1A05_013T01_9000003070_20782cztM0_level2.evt | modeM0/AS1A05_013T01_9000003070_20782cztM0_level2_quad_clean.evt |
| Size (bytes) | 1,629,671,040 | 270,273,600 |
| Size | 1.5 GB | 257.8 MB |
| Events in quadrant A | 10,273,951 | 1,724,391 |
| Events in quadrant B | 11,308,362 | 1,706,500 |
| Events in quadrant C | 10,566,070 | 1,659,247 |
| Events in quadrant D | 15,703,681 | 1,564,465 |
| Mode SS | |||
|---|---|---|---|
| Quadrant | BADHDUFLAG | Total packets | Discarded packets |
| A | 0 | 502 | 51 |
| B | 0 | 498 | 47 |
| C | 0 | 502 | 51 |
| D | 0 | 504 | 54 |
| Mode M0 | |||
|---|---|---|---|
| Quadrant | BADHDUFLAG | Total packets | Discarded packets |
| A | 0 | 50060 | 4705 |
| B | 0 | 53474 | 5589 |
| C | 0 | 51039 | 5121 |
| D | 0 | 69609 | 8109 |
| Mode M9 | |||
|---|---|---|---|
| Quadrant | BADHDUFLAG | Total packets | Discarded packets |
| A | 0 | 34 | 9 |
| B | 0 | 33 | 7 |
| C | 0 | 33 | 6 |
| D | 0 | 36 | 9 |
| Quadrant | Total seconds | Saturated seconds | Saturation percentage |
|---|---|---|---|
| A | 22276 | 99 | 0.444424% |
| B | 22287 | 217 | 0.973662% |
| C | 22242 | 203 | 0.912688% |
| D | 22130 | 1333 | 6.023498% |
Noise dominated data is calculated using 1-second bins in cleaned event files. If a bin has >2000 counts, and if more than 50% of those come from <1% of pixels, then it is considered to be noise-dominated and hence unusable.
| Quadrant | # 1 sec bins | Bins with >0 counts | Bins with >2000 counts | High rate bins dominated by noise | Noise dominated (total time) | Noise dominated (detector-on time) | Marked lightcurve |
|---|---|---|---|---|---|---|---|
| A | 31831 | 22638 | 0 | 0 | 0.00% | 0.00% | 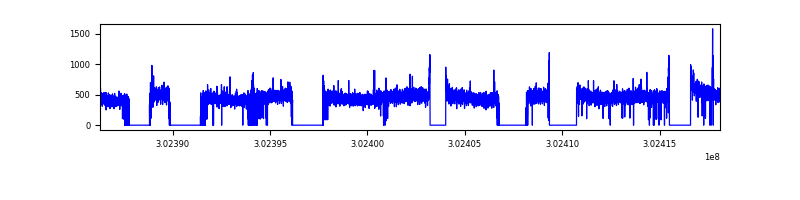 |
| B | 31831 | 22613 | 59 | 59 | 0.19% | 0.26% | 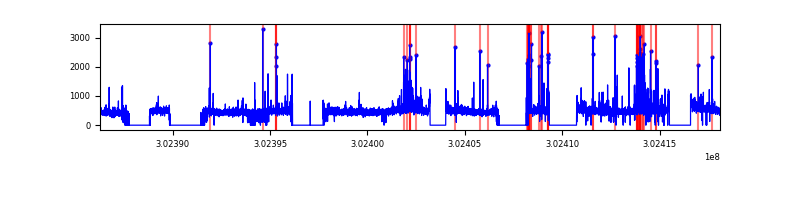 |
| C | 31831 | 22589 | 2 | 2 | 0.01% | 0.01% | 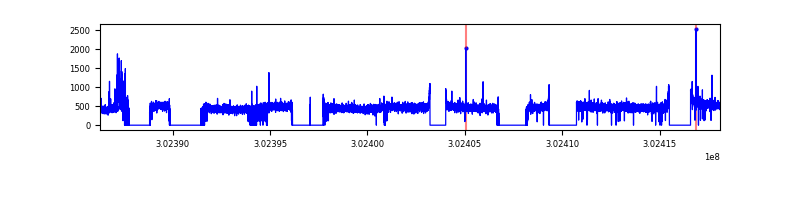 |
| D | 31831 | 22426 | 1028 | 1028 | 3.23% | 4.58% | 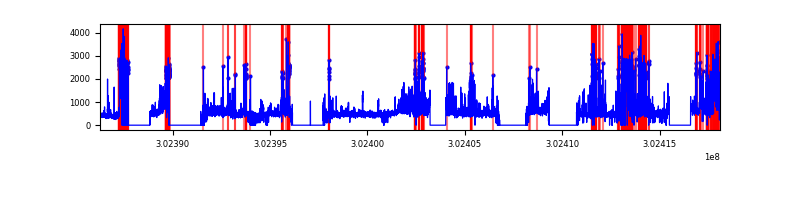 |
Top three noisy pixels from each quadrant. If the there are fewer than three noisy pixels in the level2.evt file, extra rows are filled as -1
| Pixel properties | Quadrant properties | ||||||
|---|---|---|---|---|---|---|---|
| Quadrant | DetID | PixID | Counts | Sigma | Mean | Median | Sigma |
| A | 0 | 226 | 23077 | 38.45 | 2666 | 2607 | 532.4 |
| A | 3 | 137 | 21462 | 35.42 | 2666 | 2607 | 532.4 |
| A | 13 | 252 | 19257 | 31.27 | 2666 | 2607 | 532.4 |
| B | 7 | 220 | 399983 | 803.22 | 2644 | 2579 | 494.8 |
| B | 0 | 219 | 183531 | 365.73 | 2644 | 2579 | 494.8 |
| B | 3 | 64 | 92161 | 181.06 | 2644 | 2579 | 494.8 |
| C | 14 | 238 | 400647 | 678.33 | 2545 | 2563 | 586.9 |
| C | 9 | 54 | 211477 | 355.99 | 2545 | 2563 | 586.9 |
| C | 7 | 247 | 30236 | 47.15 | 2545 | 2563 | 586.9 |
| D | 1 | 20 | 2449465 | 4076.08 | 2498 | 2426 | 600.3 |
| D | 1 | 239 | 1858430 | 3091.58 | 2498 | 2426 | 600.3 |
| D | 1 | 52 | 1235591 | 2054.11 | 2498 | 2426 | 600.3 |
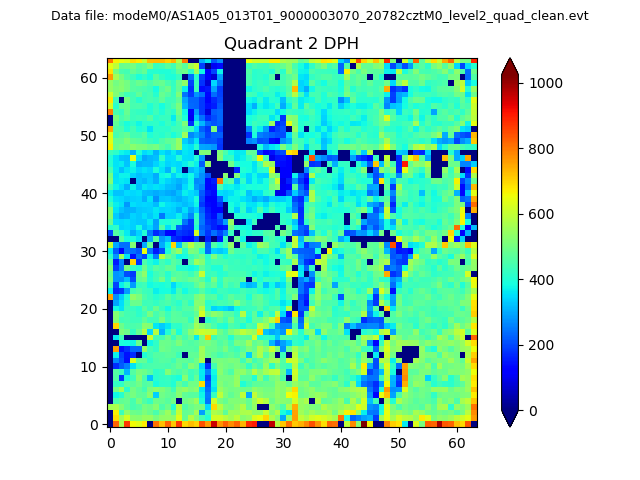
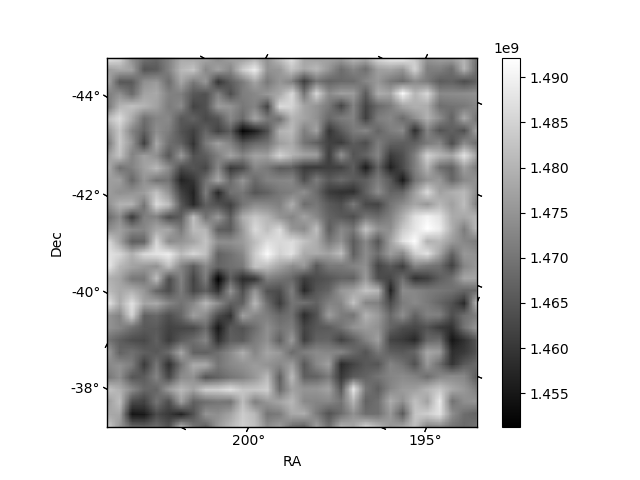
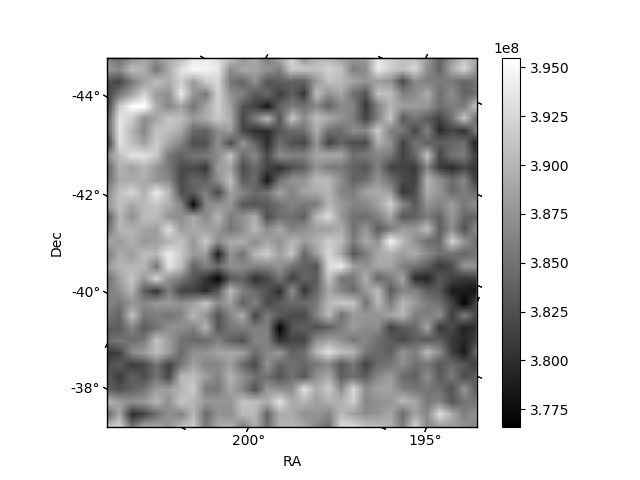
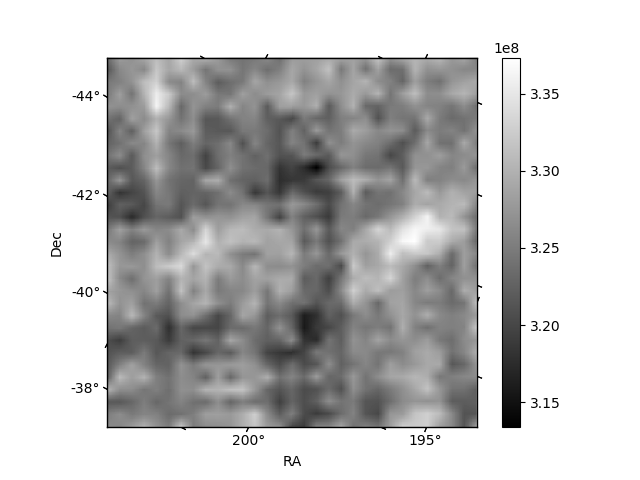
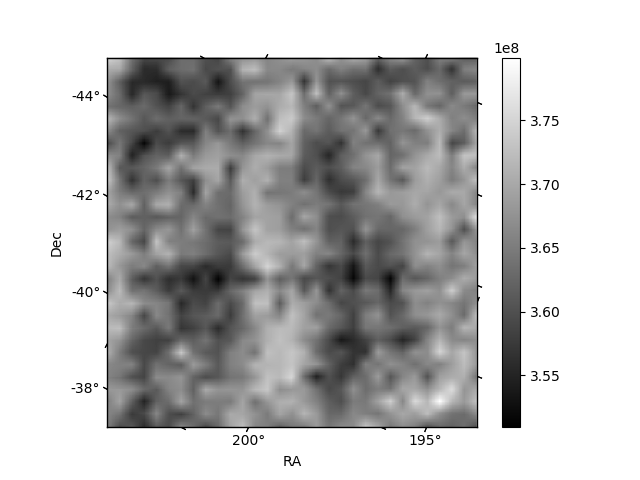
Histogram calculated using DETX and DETY for each event in the final _common_clean file
| Quadrant A | 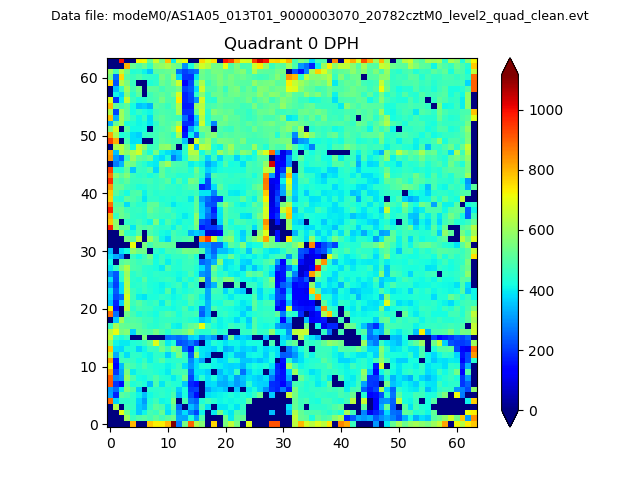 |
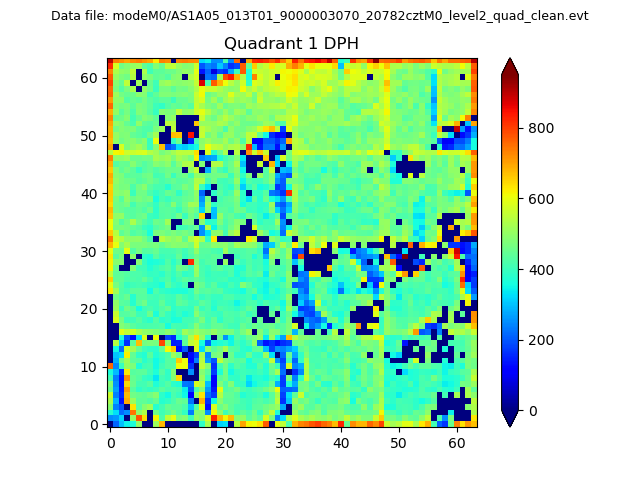 |
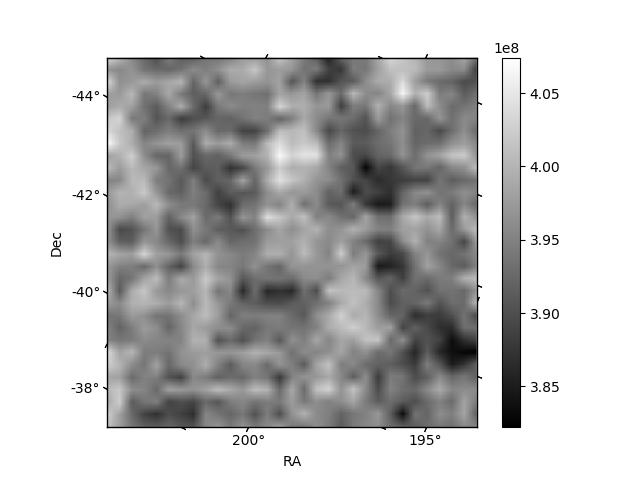
Quadrant B |
|---|---|---|---|
| Quadrant D | 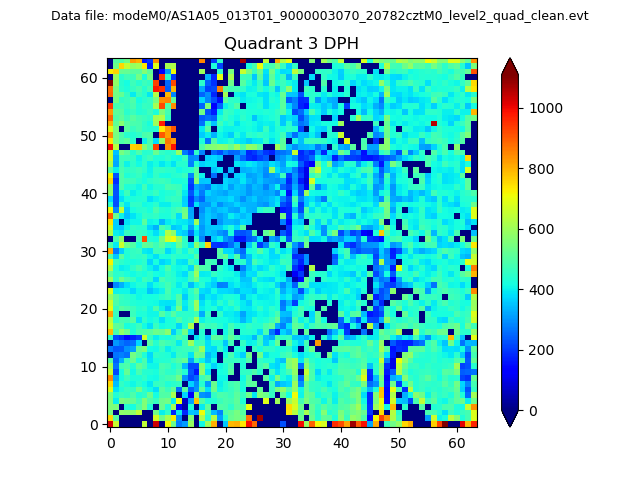 |
 |
Quadrant C |
| Plot type | Count rate plots | Images |
|---|---|---|
| Comparison with Poisson distribution Blue bars denote a histogram of data divided into 1 sec bins. Red curve is a Poisson curve with rate = median count rate of data. |
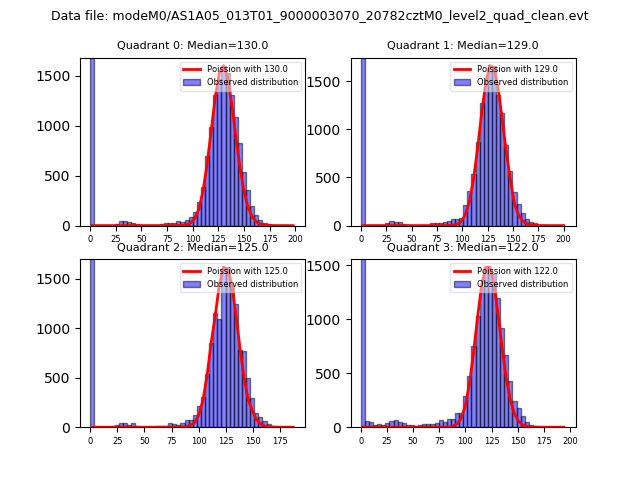 |
 |
| Quadrant-wise count rates Data is divided into 100 sec bins |
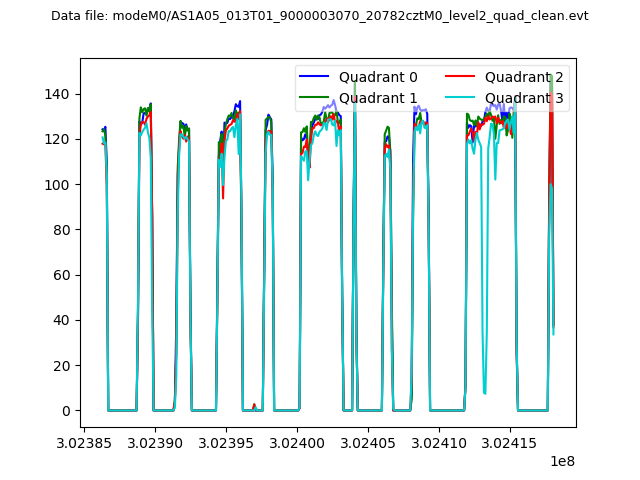 |
|
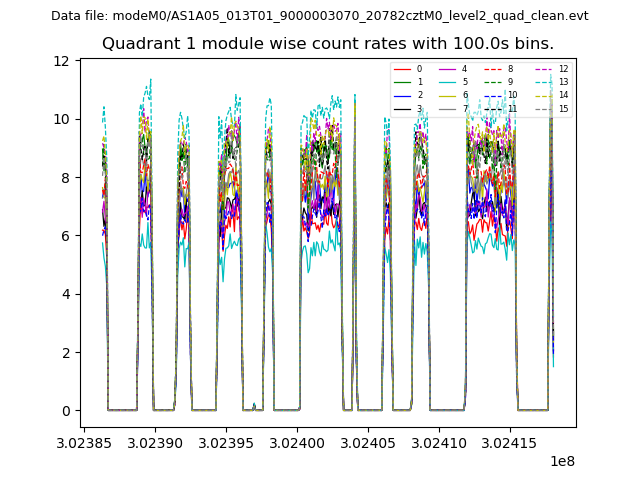
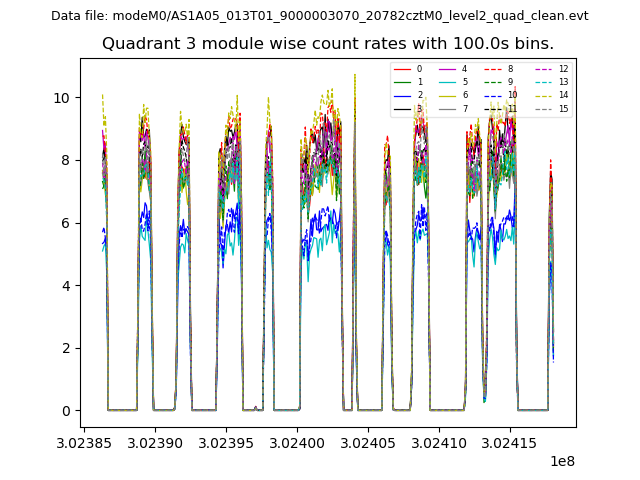
| Module-wise count rates for Quadrant A Data is divided into 100 sec bins |
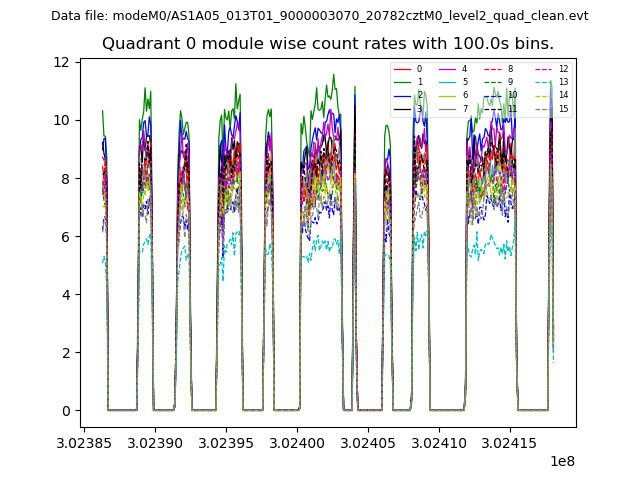 |
 |
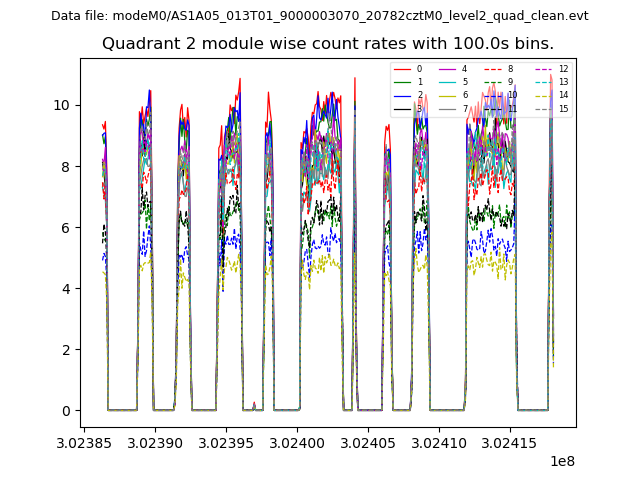
| Module-wise count rates for Quadrant B Data is divided into 100 sec bins |
 |
 |
| Module-wise count rates for Quadrant C Data is divided into 100 sec bins |
 |
 |
| Module-wise count rates for Quadrant D Data is divided into 100 sec bins |
 |
 |
| Parameter | Plot |
|---|---|
| CZT HV Monitor | 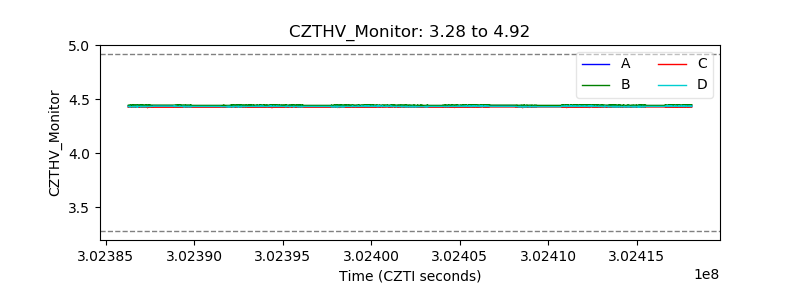 |
| D_VDD | 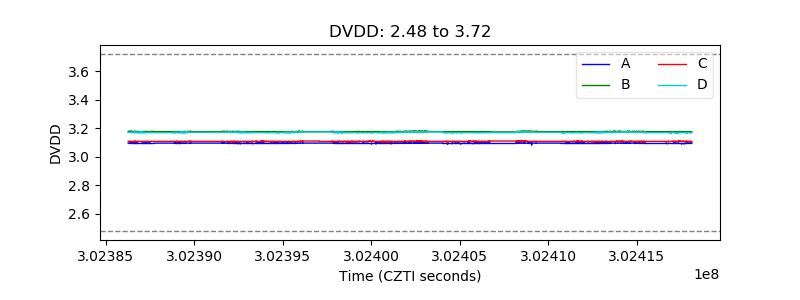 |
| Temperature 1 | 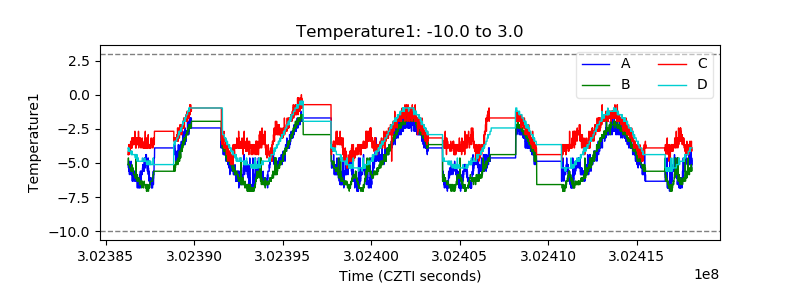 |
| Veto HV Monitor | 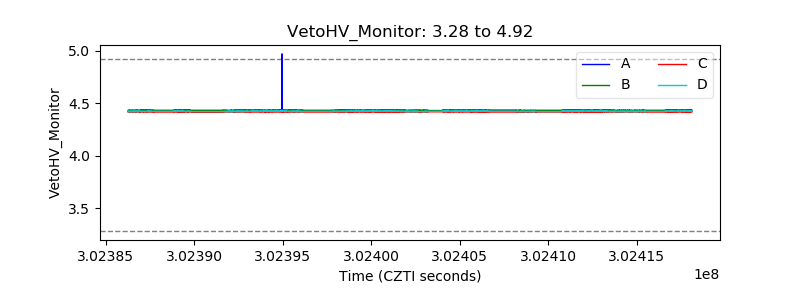 |
| Veto LLD | 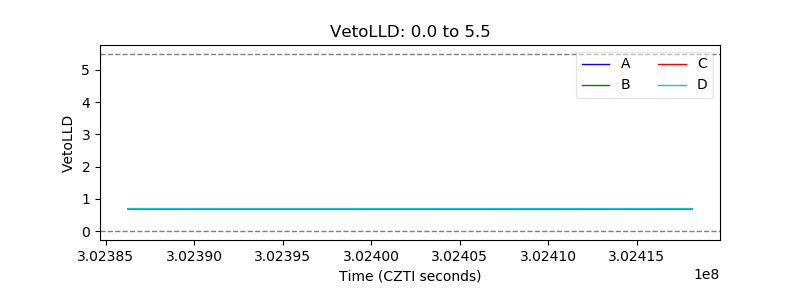 |
| Alpha Counter | 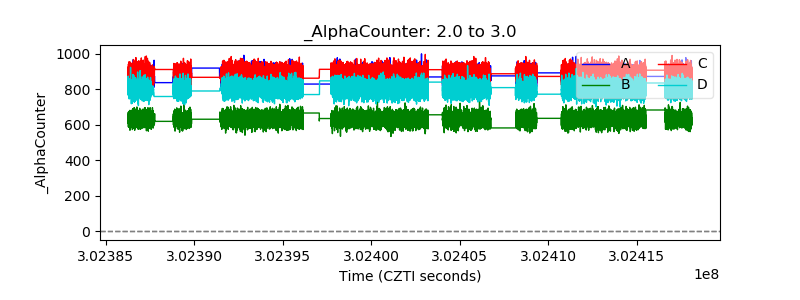 |
| _CPM_Rate | 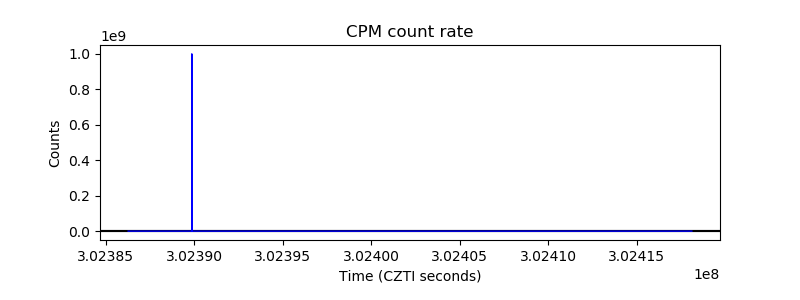 |
| CZT Counter | 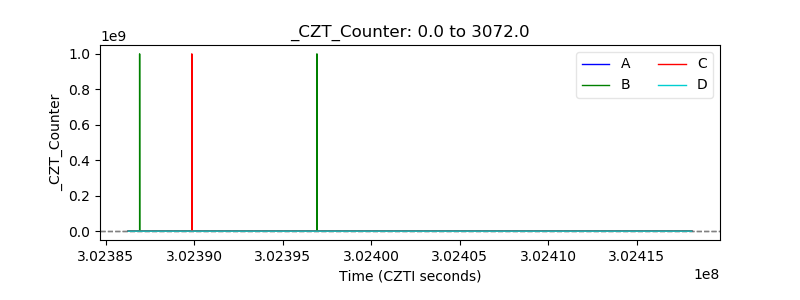 |
| +2.5 Volts monitor |  |
| +5 Volts monitor | 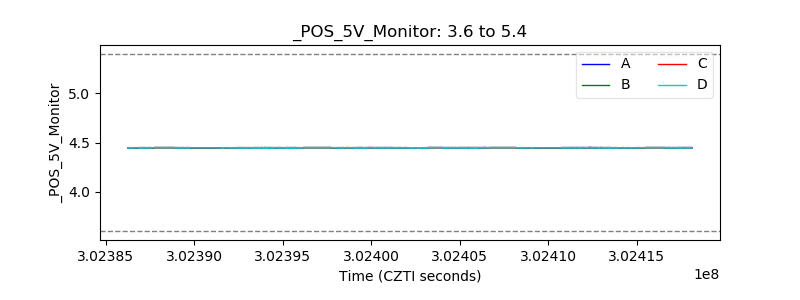 |
| _ROLL_ROT | 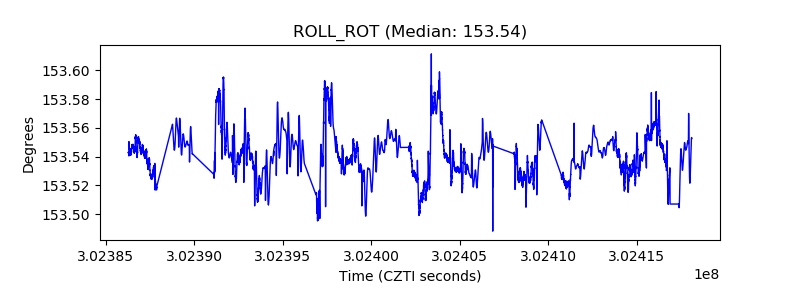 |
| _Roll_DEC | 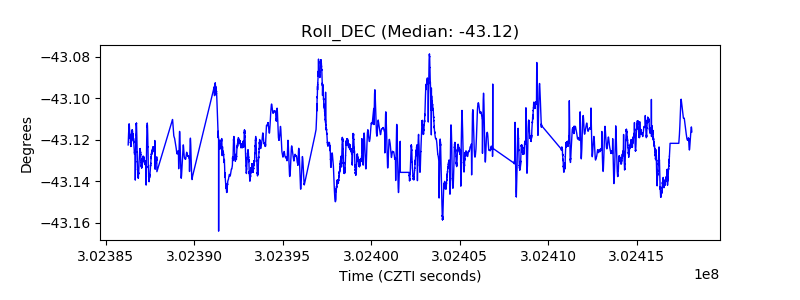 |
| _Roll_RA | 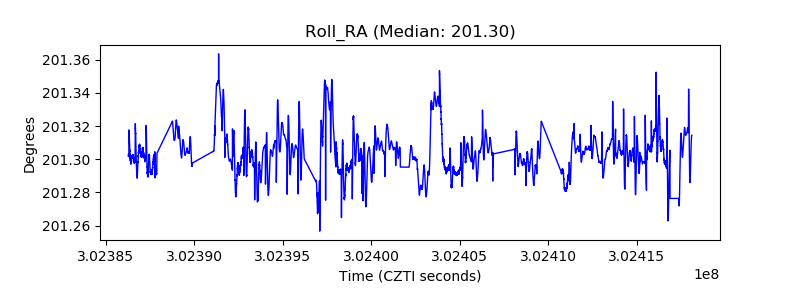 |
| Veto Counter | 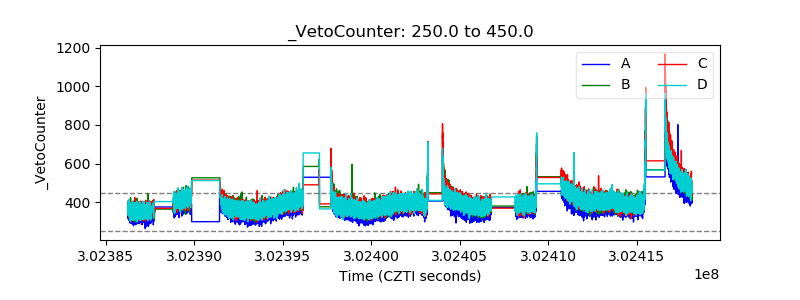 |