| Param | Original file | Final file |
|---|---|---|
| Filename | modeM0/AS1A05_013T01_9000003070_20783cztM0_level2.evt | modeM0/AS1A05_013T01_9000003070_20783cztM0_level2_quad_clean.evt |
| Size (bytes) | 1,243,503,360 | 215,899,200 |
| Size | 1.2 GB | 205.9 MB |
| Events in quadrant A | 7,487,069 | 1,432,789 |
| Events in quadrant B | 8,624,868 | 1,412,024 |
| Events in quadrant C | 7,650,874 | 1,393,787 |
| Events in quadrant D | 12,864,616 | 1,245,017 |
| Mode SS | |||
|---|---|---|---|
| Quadrant | BADHDUFLAG | Total packets | Discarded packets |
| A | 0 | 328 | 16 |
| B | 0 | 328 | 14 |
| C | 0 | 328 | 14 |
| D | 0 | 327 | 17 |
| Mode M0 | |||
|---|---|---|---|
| Quadrant | BADHDUFLAG | Total packets | Discarded packets |
| A | 0 | 33618 | 1535 |
| B | 0 | 37523 | 2133 |
| C | 0 | 34023 | 1521 |
| D | 0 | 52591 | 4074 |
| Mode M9 | |||
|---|---|---|---|
| Quadrant | BADHDUFLAG | Total packets | Discarded packets |
| A | 0 | 33 | 0 |
| B | 0 | 33 | 0 |
| C | 0 | 33 | 0 |
| D | 0 | 33 | 0 |
| Quadrant | Total seconds | Saturated seconds | Saturation percentage |
|---|---|---|---|
| A | 15332 | 114 | 0.743543% |
| B | 15312 | 329 | 2.148642% |
| C | 15357 | 233 | 1.517223% |
| D | 15126 | 1280 | 8.462250% |
Noise dominated data is calculated using 1-second bins in cleaned event files. If a bin has >2000 counts, and if more than 50% of those come from <1% of pixels, then it is considered to be noise-dominated and hence unusable.
| Quadrant | # 1 sec bins | Bins with >0 counts | Bins with >2000 counts | High rate bins dominated by noise | Noise dominated (total time) | Noise dominated (detector-on time) | Marked lightcurve |
|---|---|---|---|---|---|---|---|
| A | 19375 | 15591 | 0 | 0 | 0.00% | 0.00% | 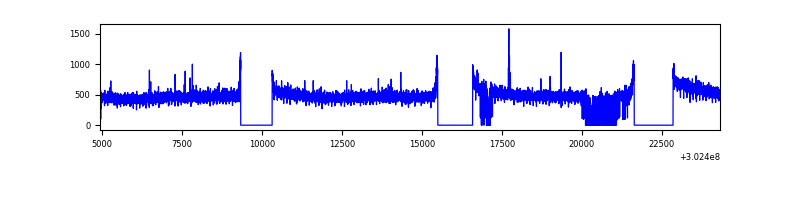 |
| B | 19373 | 15538 | 132 | 132 | 0.68% | 0.85% | 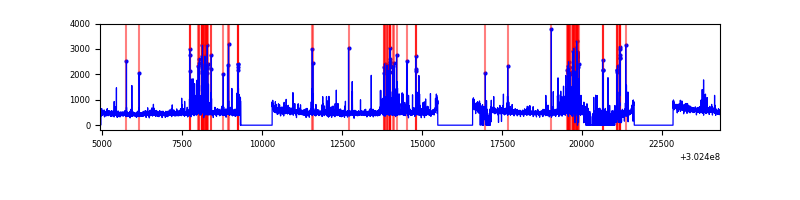 |
| C | 19375 | 15613 | 4 | 4 | 0.02% | 0.03% | 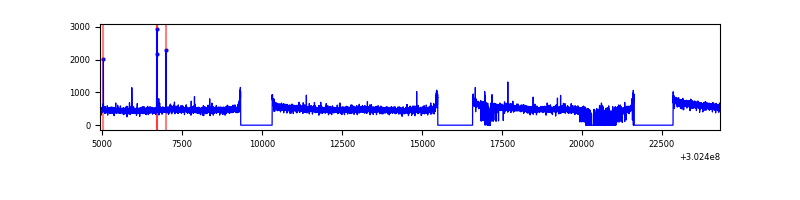 |
| D | 19376 | 15320 | 965 | 965 | 4.98% | 6.30% | 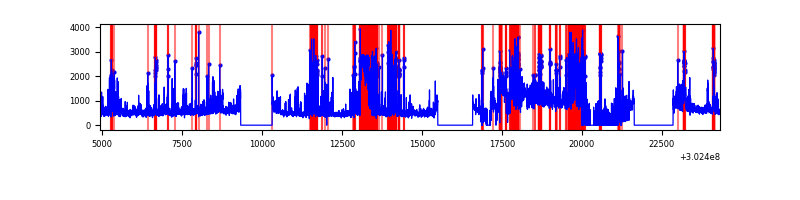 |
Top three noisy pixels from each quadrant. If the there are fewer than three noisy pixels in the level2.evt file, extra rows are filled as -1
| Pixel properties | Quadrant properties | ||||||
|---|---|---|---|---|---|---|---|
| Quadrant | DetID | PixID | Counts | Sigma | Mean | Median | Sigma |
| A | 15 | 174 | 18862 | 43.93 | 1943 | 1906 | 386.0 |
| A | 0 | 226 | 16954 | 38.98 | 1943 | 1906 | 386.0 |
| A | 3 | 137 | 15294 | 34.68 | 1943 | 1906 | 386.0 |
| B | 7 | 220 | 537096 | 1520.56 | 1906 | 1860 | 352.0 |
| B | 3 | 64 | 183738 | 516.7 | 1906 | 1860 | 352.0 |
| B | 0 | 219 | 180755 | 508.23 | 1906 | 1860 | 352.0 |
| C | 14 | 238 | 296541 | 691.45 | 1866 | 1882 | 426.1 |
| C | 7 | 247 | 36561 | 81.38 | 1866 | 1882 | 426.1 |
| C | 3 | 233 | 25044 | 54.35 | 1866 | 1882 | 426.1 |
| D | 1 | 20 | 2193606 | 5156.55 | 1791 | 1746 | 425.1 |
| D | 1 | 239 | 1654606 | 3888.5 | 1791 | 1746 | 425.1 |
| D | 1 | 52 | 1600246 | 3760.62 | 1791 | 1746 | 425.1 |
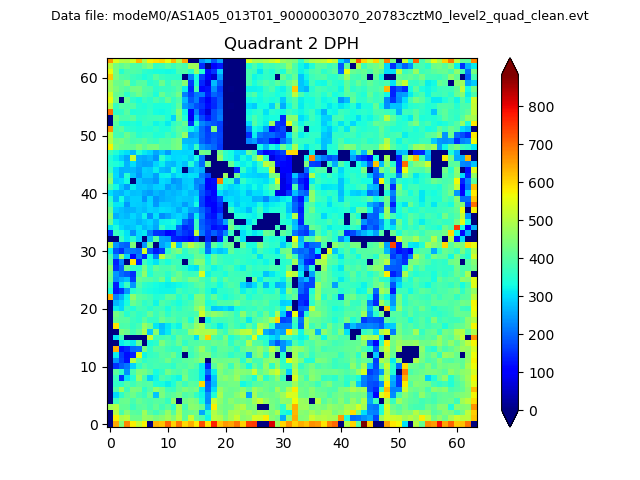
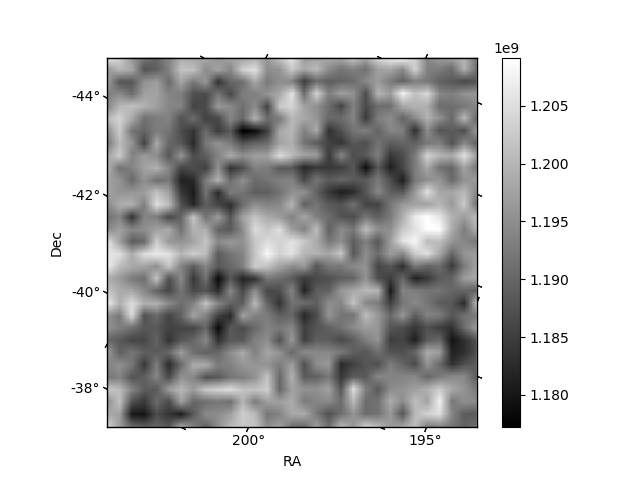
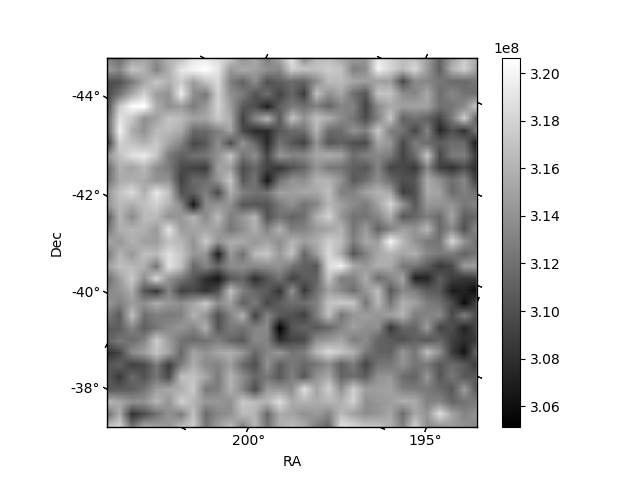
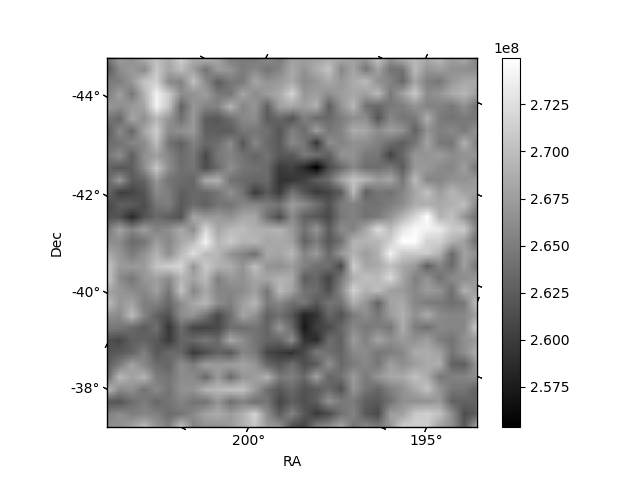
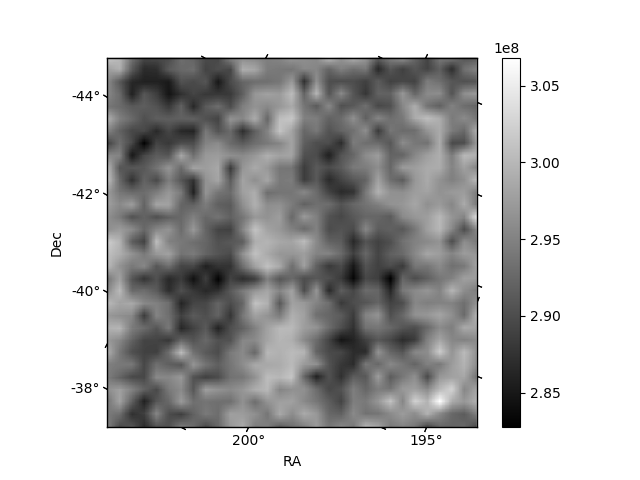
Histogram calculated using DETX and DETY for each event in the final _common_clean file
| Quadrant A | 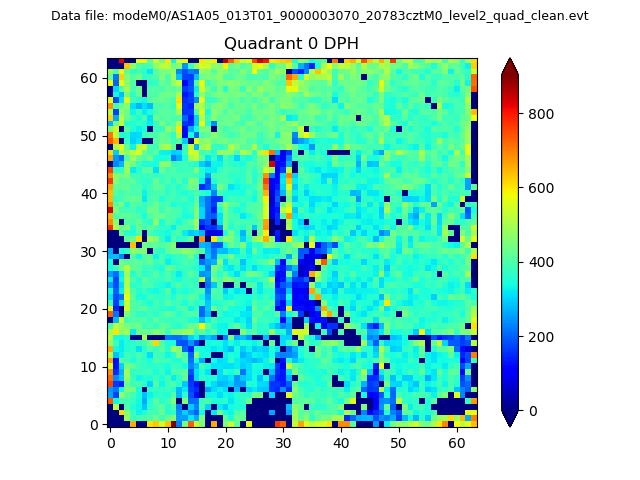 |
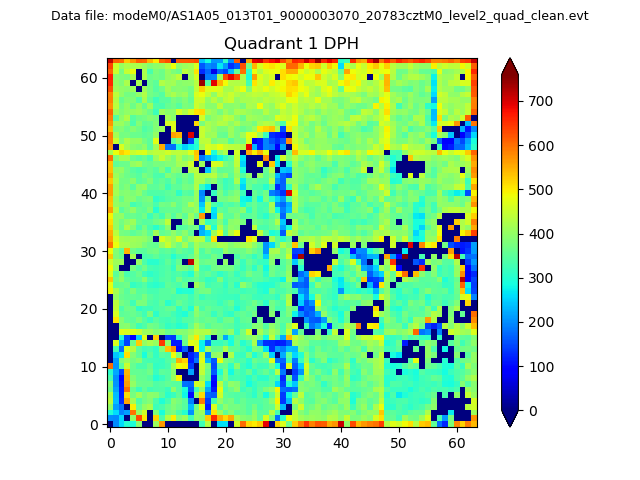 |
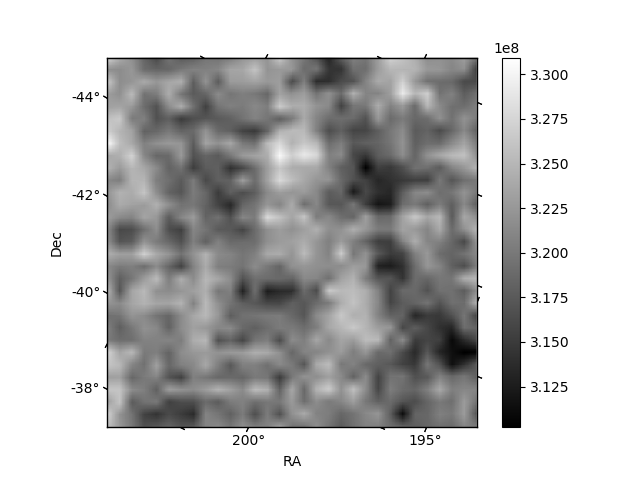
Quadrant B |
|---|---|---|---|
| Quadrant D | 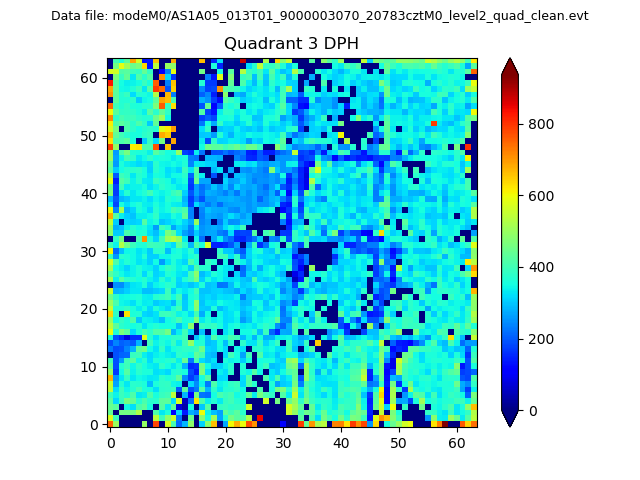 |
 |
Quadrant C |
| Plot type | Count rate plots | Images |
|---|---|---|
| Comparison with Poisson distribution Blue bars denote a histogram of data divided into 1 sec bins. Red curve is a Poisson curve with rate = median count rate of data. |
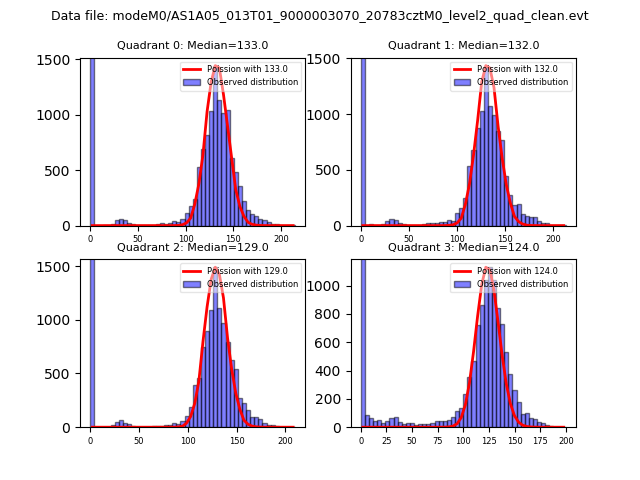 |
 |
| Quadrant-wise count rates Data is divided into 100 sec bins |
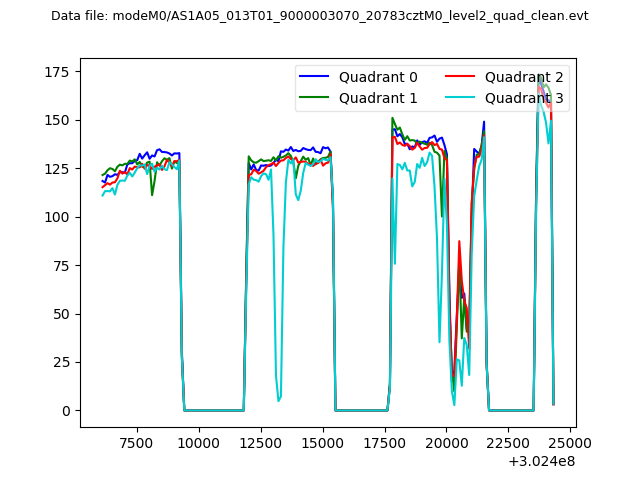 |
|
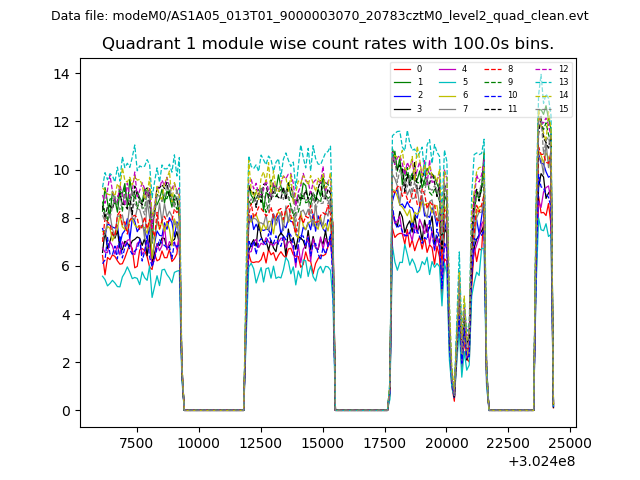
| Module-wise count rates for Quadrant A Data is divided into 100 sec bins |
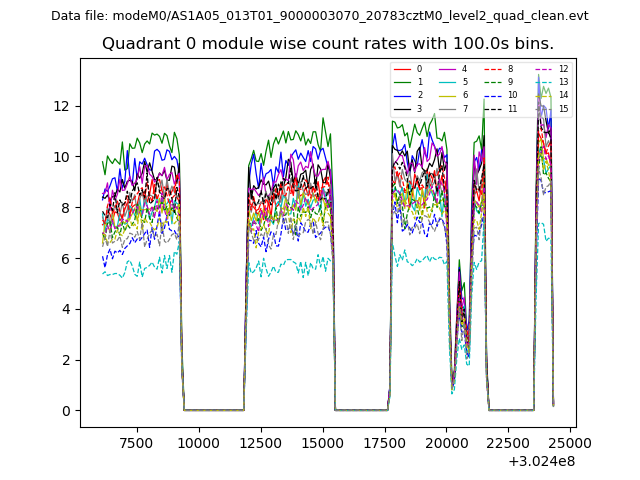 |
 |
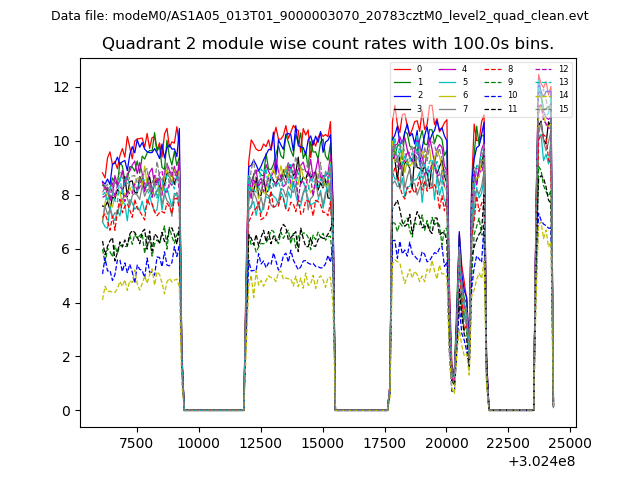
| Module-wise count rates for Quadrant B Data is divided into 100 sec bins |
 |
 |
| Module-wise count rates for Quadrant C Data is divided into 100 sec bins |
 |
 |
| Module-wise count rates for Quadrant D Data is divided into 100 sec bins |
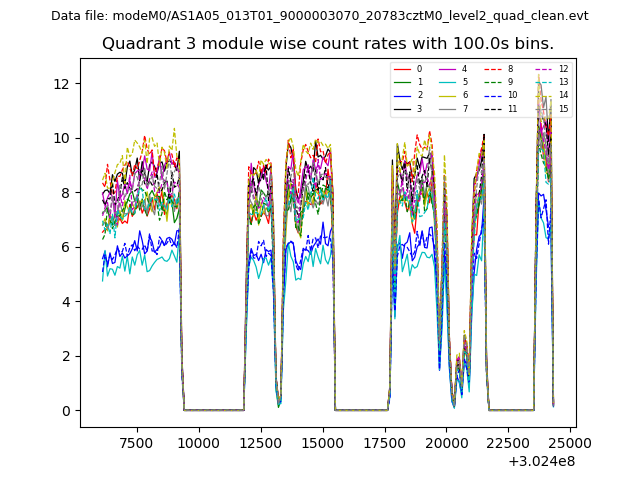 |
 |
| Parameter | Plot |
|---|---|
| CZT HV Monitor | 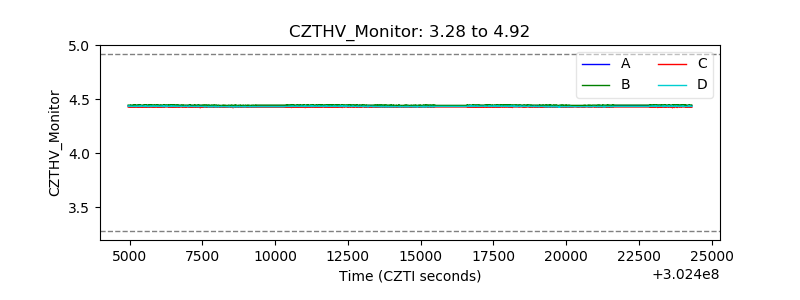 |
| D_VDD | 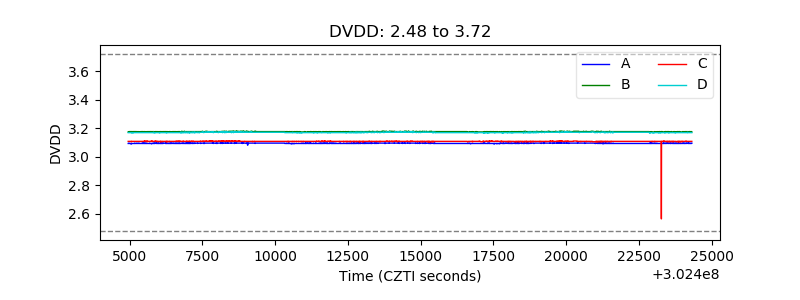 |
| Temperature 1 | 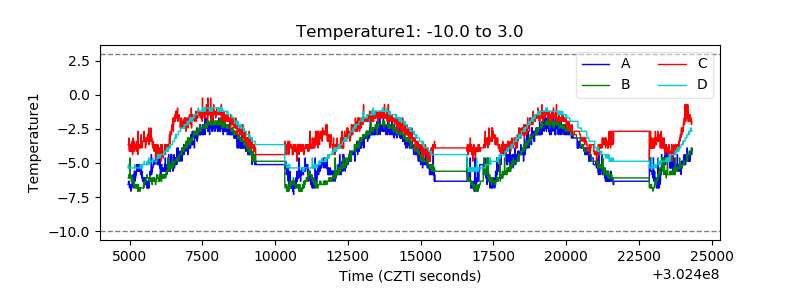 |
| Veto HV Monitor | 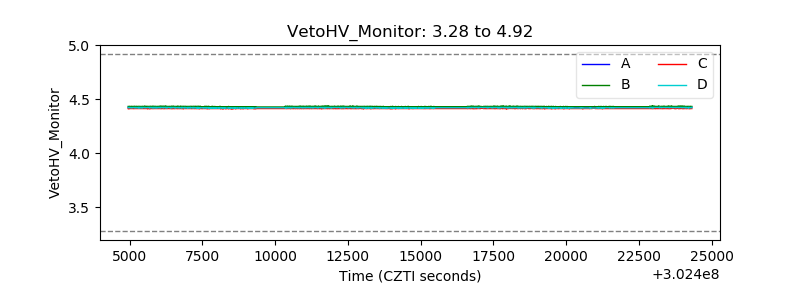 |
| Veto LLD | 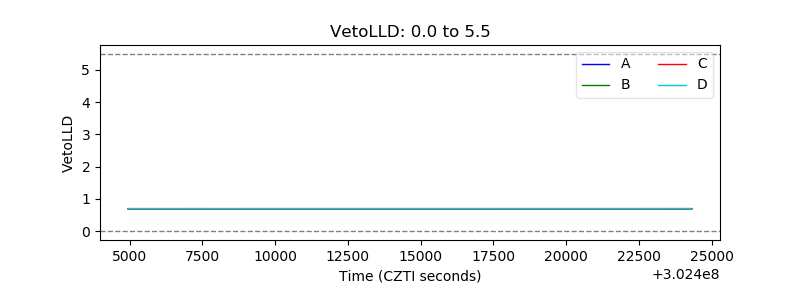 |
| Alpha Counter |  |
| _CPM_Rate | 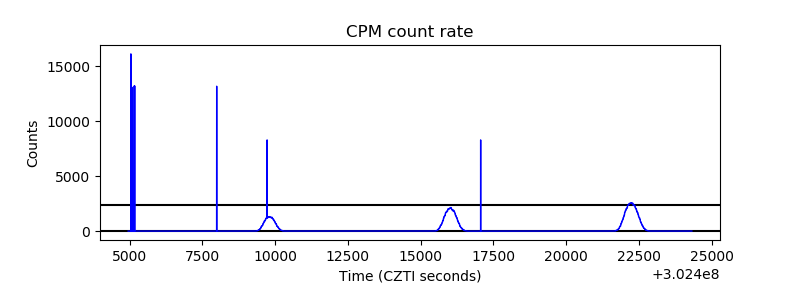 |
| CZT Counter | 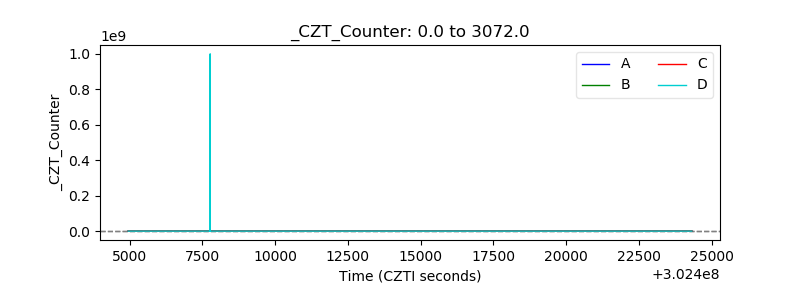 |
| +2.5 Volts monitor |  |
| +5 Volts monitor |  |
| _ROLL_ROT | 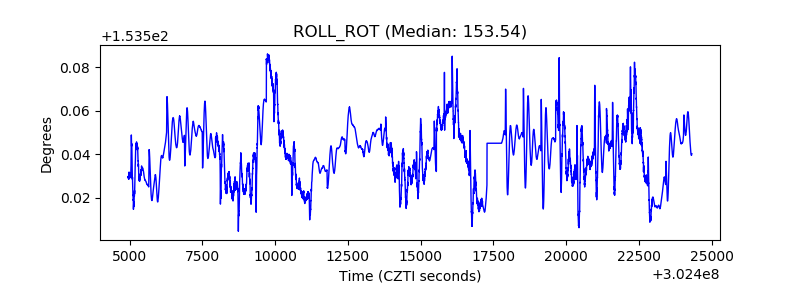 |
| _Roll_DEC | 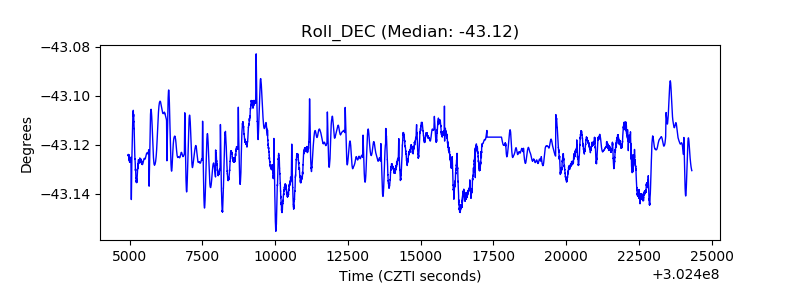 |
| _Roll_RA |  |
| Veto Counter | 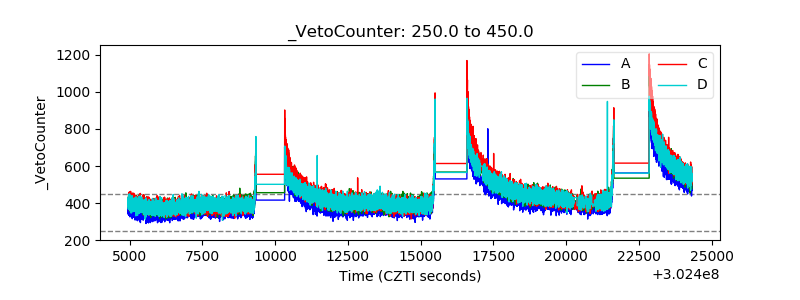 |