| Param | Original file | Final file |
|---|---|---|
| Filename | modeM0/AS1A05_013T01_9000003070_20785cztM0_level2.evt | modeM0/AS1A05_013T01_9000003070_20785cztM0_level2_quad_clean.evt |
| Size (bytes) | 471,078,720 | 122,040,000 |
| Size | 449.3 MB | 116.4 MB |
| Events in quadrant A | 3,151,706 | 852,358 |
| Events in quadrant B | 3,435,195 | 838,728 |
| Events in quadrant C | 3,130,598 | 810,907 |
| Events in quadrant D | 4,159,303 | 792,931 |
| Mode SS | |||
|---|---|---|---|
| Quadrant | BADHDUFLAG | Total packets | Discarded packets |
| A | 0 | 118 | 0 |
| B | 0 | 118 | 0 |
| C | 0 | 118 | 2 |
| D | 0 | 118 | 0 |
| Mode M0 | |||
|---|---|---|---|
| Quadrant | BADHDUFLAG | Total packets | Discarded packets |
| A | 0 | 12995 | 17 |
| B | 0 | 14034 | 89 |
| C | 0 | 12991 | 28 |
| D | 0 | 16159 | 48 |
| Mode M9 | |||
|---|---|---|---|
| Quadrant | BADHDUFLAG | Total packets | Discarded packets |
| A | 0 | 13 | 0 |
| B | 0 | 13 | 0 |
| C | 0 | 13 | 0 |
| D | 0 | 13 | 0 |
| Quadrant | Total seconds | Saturated seconds | Saturation percentage |
|---|---|---|---|
| A | 5746 | 119 | 2.071006% |
| B | 5740 | 192 | 3.344948% |
| C | 5741 | 157 | 2.734715% |
| D | 5741 | 234 | 4.075945% |
Noise dominated data is calculated using 1-second bins in cleaned event files. If a bin has >2000 counts, and if more than 50% of those come from <1% of pixels, then it is considered to be noise-dominated and hence unusable.
| Quadrant | # 1 sec bins | Bins with >0 counts | Bins with >2000 counts | High rate bins dominated by noise | Noise dominated (total time) | Noise dominated (detector-on time) | Marked lightcurve |
|---|---|---|---|---|---|---|---|
| A | 7064 | 5753 | 1 | 1 | 0.01% | 0.02% | 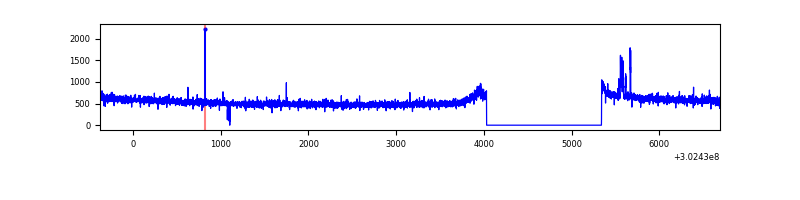 |
| B | 7065 | 5744 | 53 | 53 | 0.75% | 0.92% |  |
| C | 7064 | 5749 | 0 | 0 | 0.00% | 0.00% | 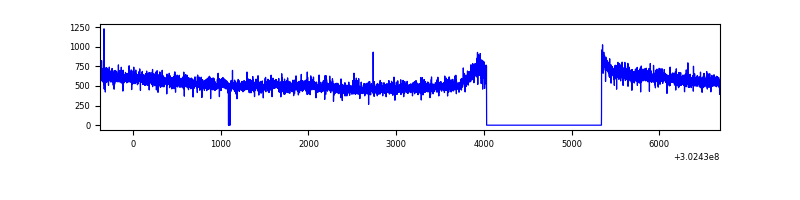 |
| D | 7064 | 5748 | 75 | 75 | 1.06% | 1.30% | 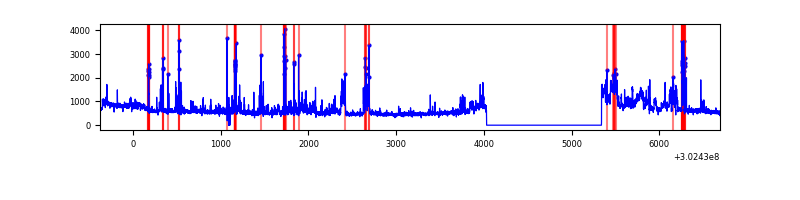 |
Top three noisy pixels from each quadrant. If the there are fewer than three noisy pixels in the level2.evt file, extra rows are filled as -1
| Pixel properties | Quadrant properties | ||||||
|---|---|---|---|---|---|---|---|
| Quadrant | DetID | PixID | Counts | Sigma | Mean | Median | Sigma |
| A | 15 | 174 | 38250 | 235.59 | 810 | 799 | 159.0 |
| A | 0 | 226 | 7242 | 40.53 | 810 | 799 | 159.0 |
| A | 12 | 194 | 5949 | 32.4 | 810 | 799 | 159.0 |
| B | 7 | 220 | 136044 | 935.22 | 783 | 765 | 144.6 |
| B | 0 | 197 | 100695 | 690.85 | 783 | 765 | 144.6 |
| B | 0 | 219 | 73501 | 502.85 | 783 | 765 | 144.6 |
| C | 14 | 238 | 123277 | 707.59 | 762 | 768 | 173.1 |
| C | 7 | 247 | 31905 | 179.84 | 762 | 768 | 173.1 |
| C | 13 | 61 | 5254 | 25.91 | 762 | 768 | 173.1 |
| D | 1 | 20 | 469782 | 2519.65 | 784 | 764 | 186.1 |
| D | 1 | 52 | 455239 | 2441.52 | 784 | 764 | 186.1 |
| D | 7 | 38 | 127034 | 678.34 | 784 | 764 | 186.1 |
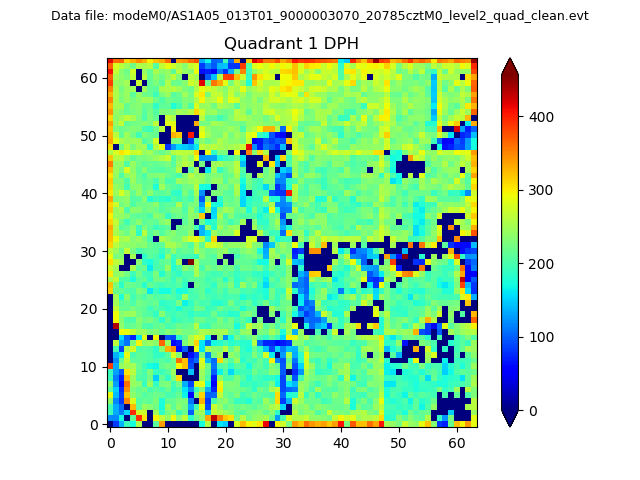
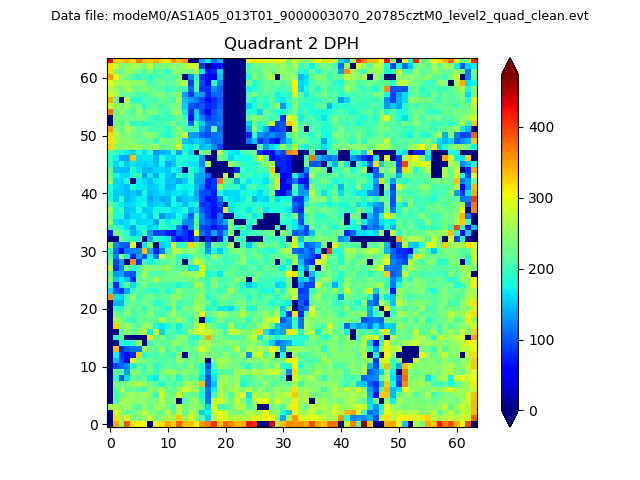
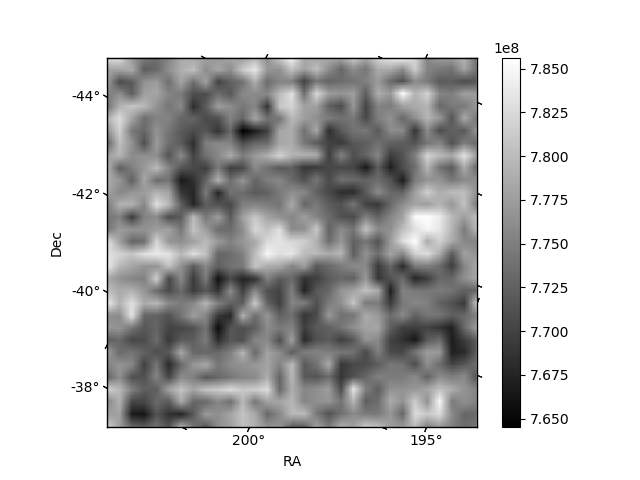
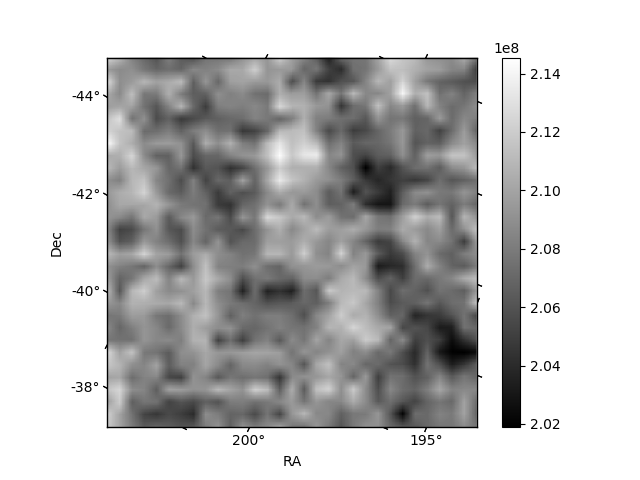
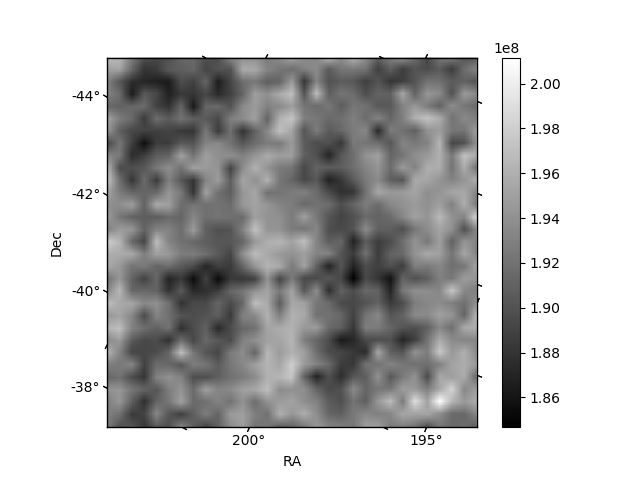
Histogram calculated using DETX and DETY for each event in the final _common_clean file
| Quadrant A | 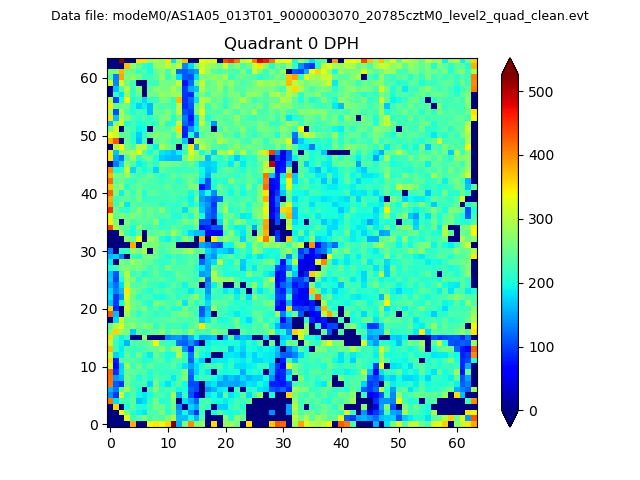 |
 |
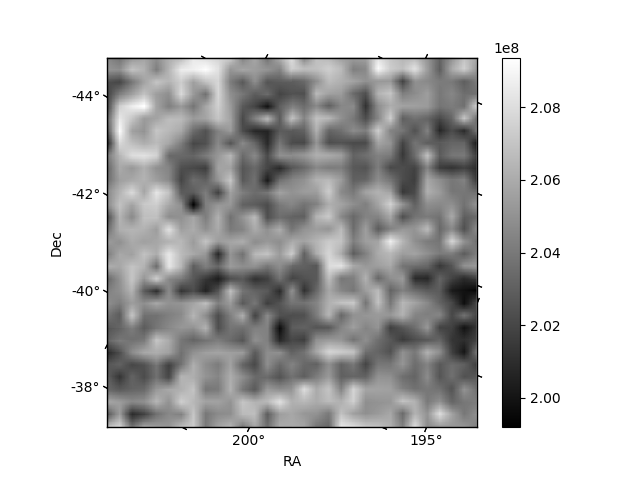
Quadrant B |
|---|---|---|---|
| Quadrant D | 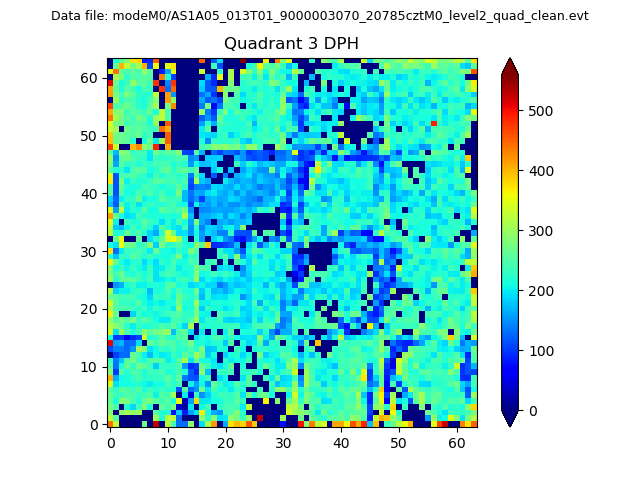 |
 |
Quadrant C |
| Plot type | Count rate plots | Images |
|---|---|---|
| Comparison with Poisson distribution Blue bars denote a histogram of data divided into 1 sec bins. Red curve is a Poisson curve with rate = median count rate of data. |
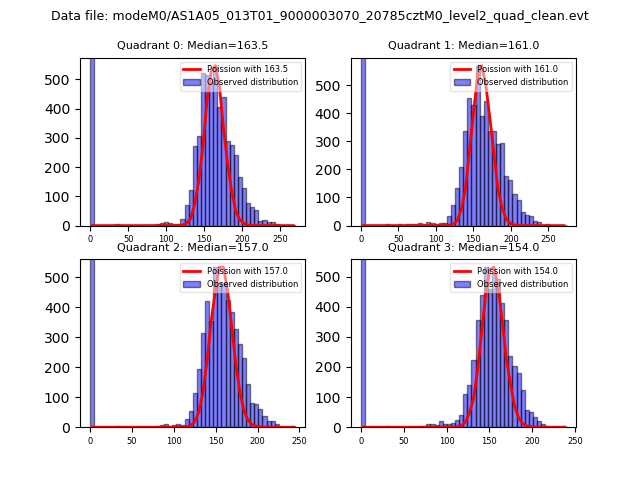 |
 |
| Quadrant-wise count rates Data is divided into 100 sec bins |
 |
|
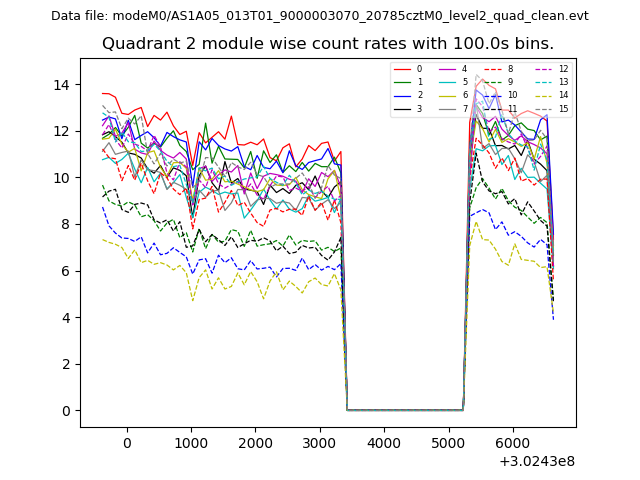
| Module-wise count rates for Quadrant A Data is divided into 100 sec bins |
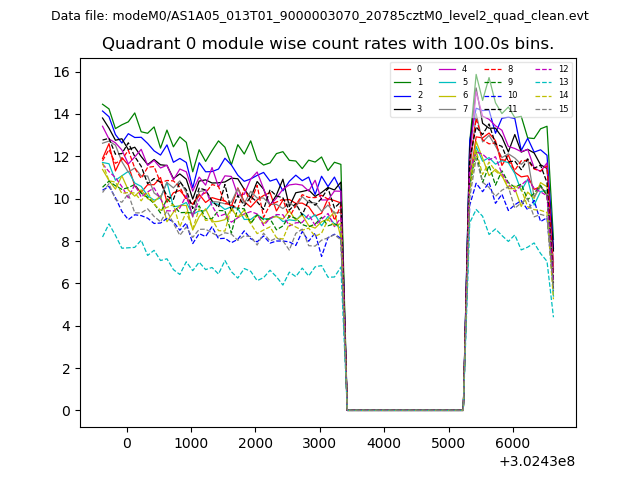 |
 |
| Module-wise count rates for Quadrant B Data is divided into 100 sec bins |
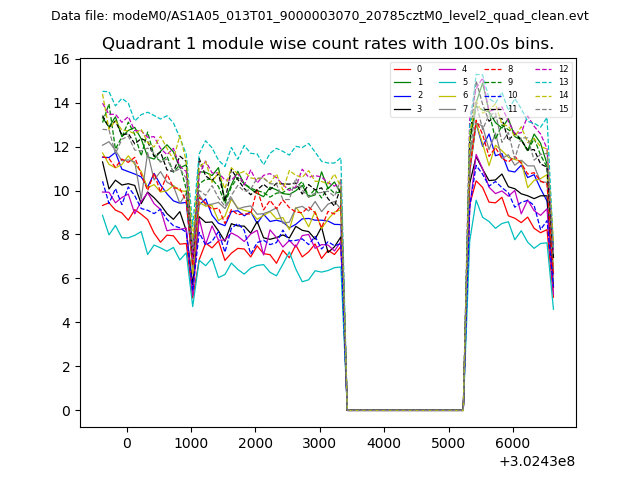 |
 |
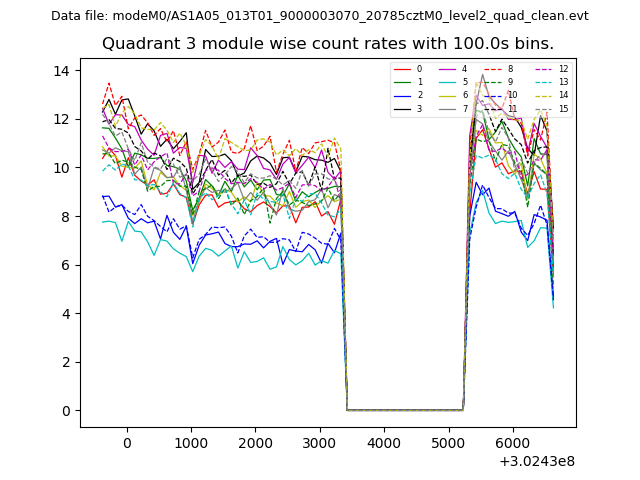
| Module-wise count rates for Quadrant C Data is divided into 100 sec bins |
 |
 |
| Module-wise count rates for Quadrant D Data is divided into 100 sec bins |
 |
 |
| Parameter | Plot |
|---|---|
| CZT HV Monitor | 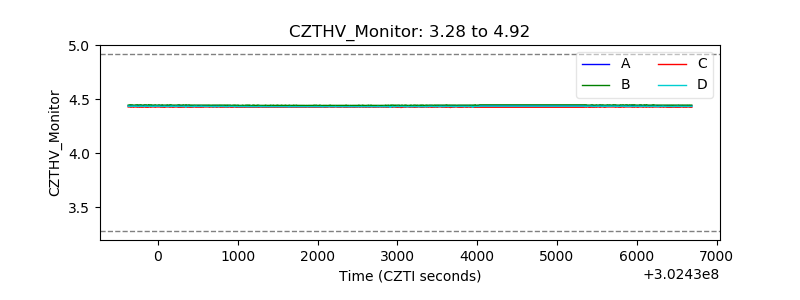 |
| D_VDD | 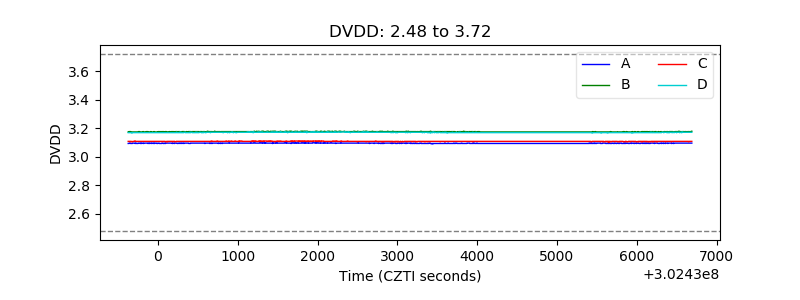 |
| Temperature 1 |  |
| Veto HV Monitor | 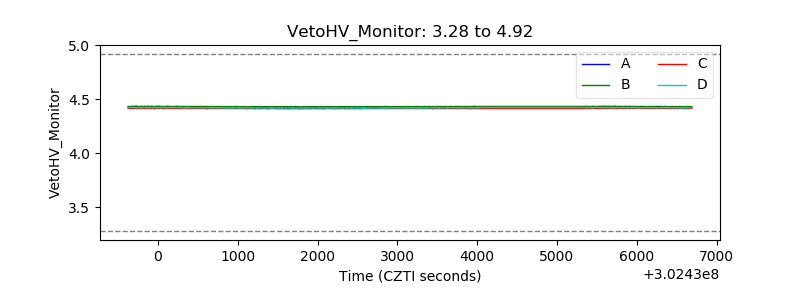 |
| Veto LLD | 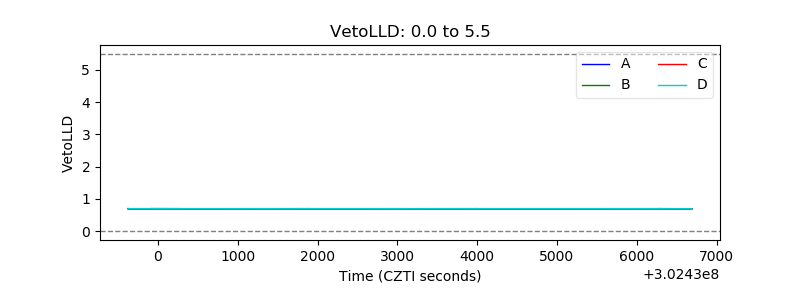 |
| Alpha Counter | 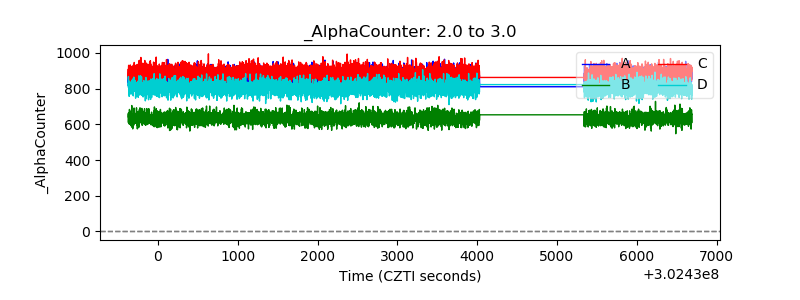 |
| _CPM_Rate | 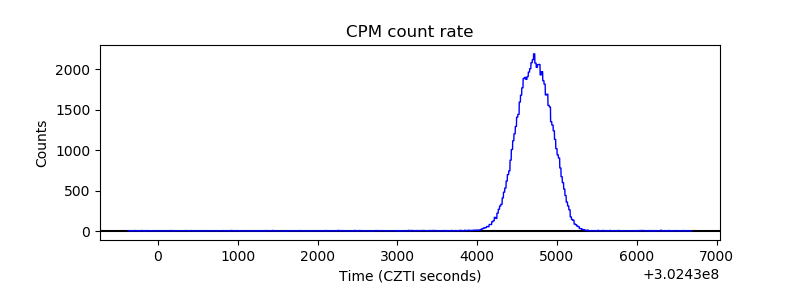 |
| CZT Counter | 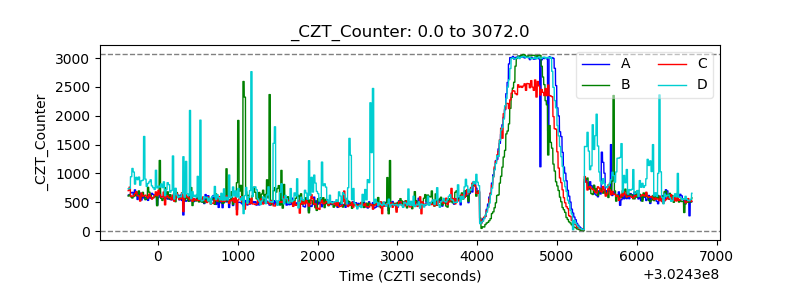 |
| +2.5 Volts monitor |  |
| +5 Volts monitor |  |
| _ROLL_ROT | 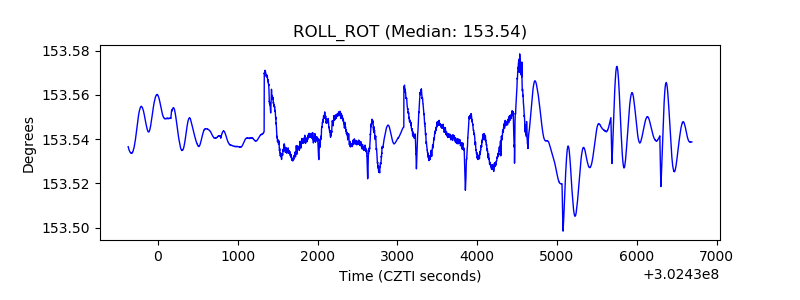 |
| _Roll_DEC | 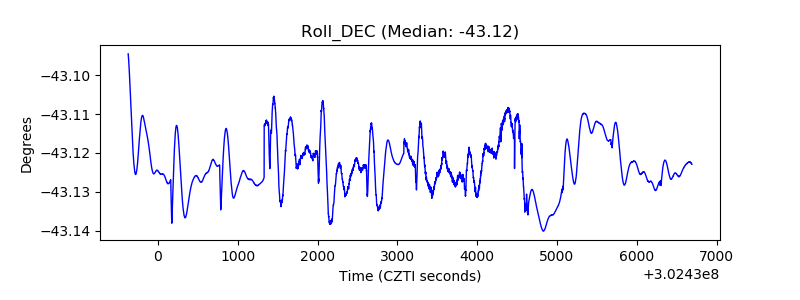 |
| _Roll_RA | 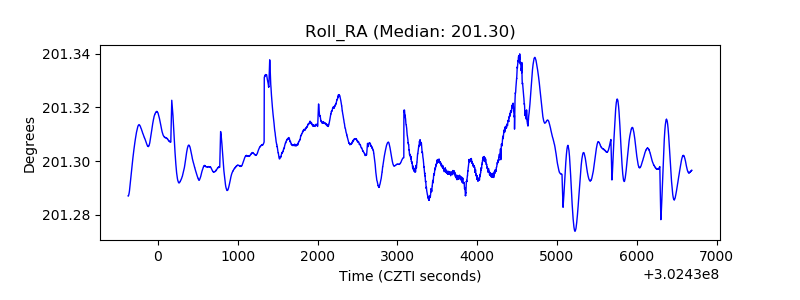 |
| Veto Counter | 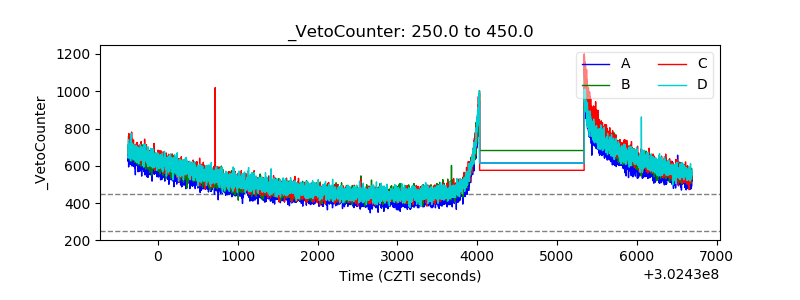 |