| Param | Original file | Final file |
|---|---|---|
| Filename | modeM0/AS1A05_013T01_9000003070_20786cztM0_level2.evt | modeM0/AS1A05_013T01_9000003070_20786cztM0_level2_quad_clean.evt |
| Size (bytes) | 509,065,920 | 114,572,160 |
| Size | 485.5 MB | 109.3 MB |
| Events in quadrant A | 3,143,319 | 798,483 |
| Events in quadrant B | 3,615,571 | 776,655 |
| Events in quadrant C | 3,102,709 | 754,596 |
| Events in quadrant D | 5,148,675 | 721,251 |
| Mode SS | |||
|---|---|---|---|
| Quadrant | BADHDUFLAG | Total packets | Discarded packets |
| A | 0 | 122 | 0 |
| B | 0 | 122 | 0 |
| C | 0 | 122 | 0 |
| D | 0 | 122 | 0 |
| Mode M0 | |||
|---|---|---|---|
| Quadrant | BADHDUFLAG | Total packets | Discarded packets |
| A | 0 | 12999 | 2 |
| B | 0 | 14586 | 2 |
| C | 0 | 12919 | 2 |
| D | 0 | 19434 | 2 |
| Mode M9 | |||
|---|---|---|---|
| Quadrant | BADHDUFLAG | Total packets | Discarded packets |
| A | 0 | 13 | 0 |
| B | 0 | 13 | 0 |
| C | 0 | 13 | 0 |
| D | 0 | 13 | 0 |
| Quadrant | Total seconds | Saturated seconds | Saturation percentage |
|---|---|---|---|
| A | 5997 | 104 | 1.734200% |
| B | 5997 | 158 | 2.634651% |
| C | 5997 | 136 | 2.267801% |
| D | 5997 | 506 | 8.437552% |
Noise dominated data is calculated using 1-second bins in cleaned event files. If a bin has >2000 counts, and if more than 50% of those come from <1% of pixels, then it is considered to be noise-dominated and hence unusable.
| Quadrant | # 1 sec bins | Bins with >0 counts | Bins with >2000 counts | High rate bins dominated by noise | Noise dominated (total time) | Noise dominated (detector-on time) | Marked lightcurve |
|---|---|---|---|---|---|---|---|
| A | 7312 | 5998 | 0 | 0 | 0.00% | 0.00% |  |
| B | 7312 | 5998 | 45 | 45 | 0.62% | 0.75% | 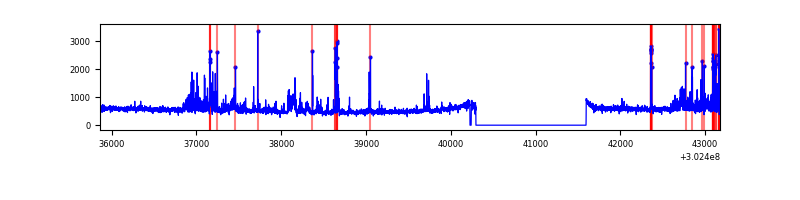 |
| C | 7312 | 5998 | 0 | 0 | 0.00% | 0.00% |  |
| D | 7312 | 5998 | 410 | 410 | 5.61% | 6.84% | 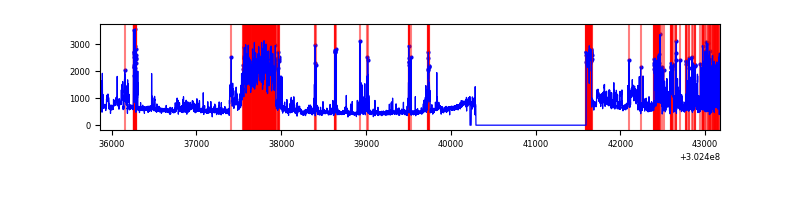 |
Top three noisy pixels from each quadrant. If the there are fewer than three noisy pixels in the level2.evt file, extra rows are filled as -1
| Pixel properties | Quadrant properties | ||||||
|---|---|---|---|---|---|---|---|
| Quadrant | DetID | PixID | Counts | Sigma | Mean | Median | Sigma |
| A | 0 | 226 | 7365 | 40.32 | 817 | 803 | 162.7 |
| A | 12 | 194 | 5938 | 31.55 | 817 | 803 | 162.7 |
| A | 3 | 137 | 5842 | 30.96 | 817 | 803 | 162.7 |
| B | 7 | 220 | 235337 | 1601.18 | 787 | 771 | 146.5 |
| B | 0 | 182 | 112775 | 764.56 | 787 | 771 | 146.5 |
| B | 3 | 64 | 79552 | 537.77 | 787 | 771 | 146.5 |
| C | 14 | 238 | 122992 | 704.57 | 761 | 768 | 173.5 |
| C | 9 | 54 | 5655 | 28.17 | 761 | 768 | 173.5 |
| C | 13 | 61 | 5390 | 26.64 | 761 | 768 | 173.5 |
| D | 1 | 52 | 1257932 | 6763.29 | 773 | 753 | 185.9 |
| D | 7 | 38 | 619056 | 3326.31 | 773 | 753 | 185.9 |
| D | 1 | 20 | 183185 | 981.44 | 773 | 753 | 185.9 |
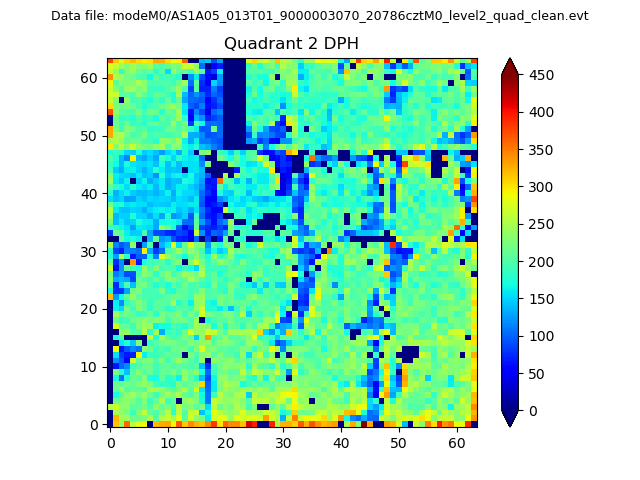
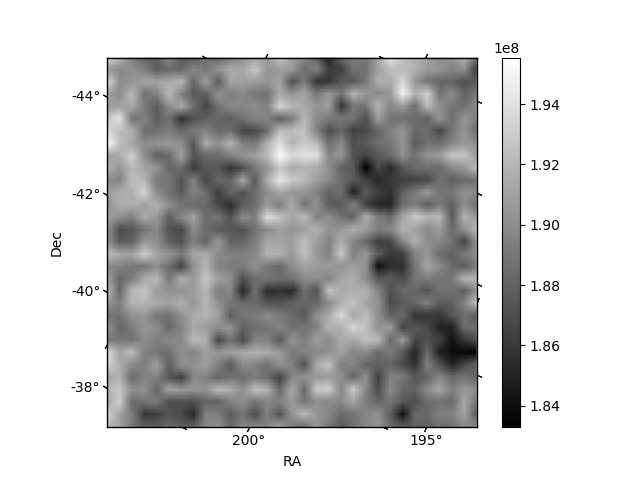
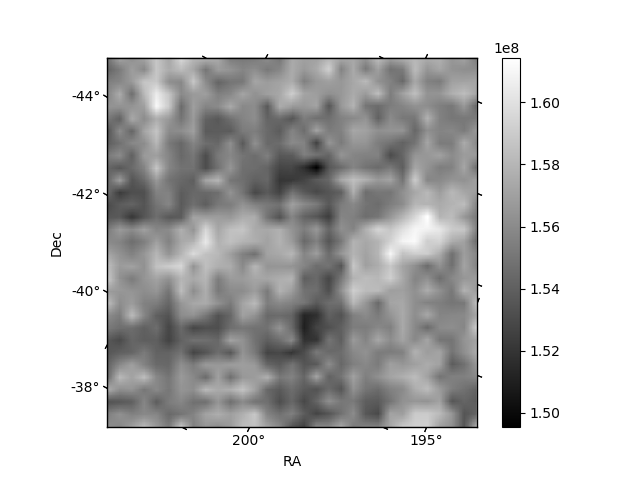
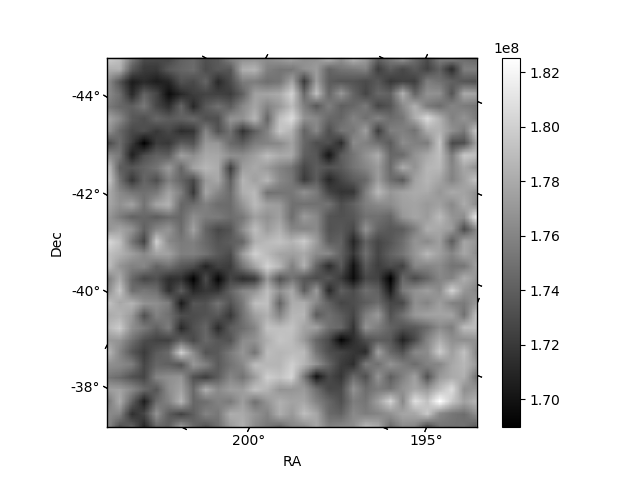
Histogram calculated using DETX and DETY for each event in the final _common_clean file
| Quadrant A | 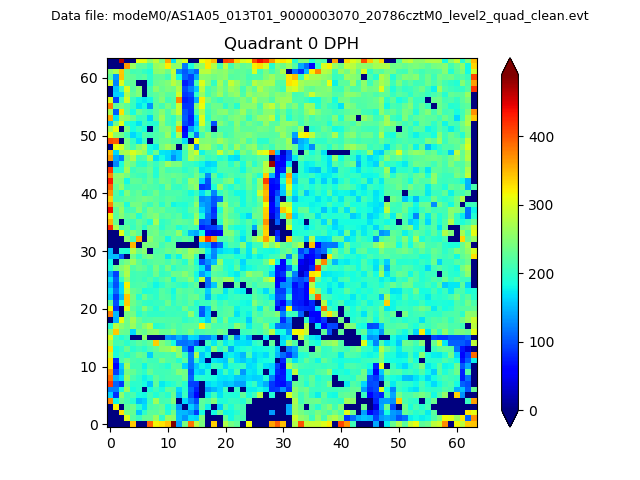 |
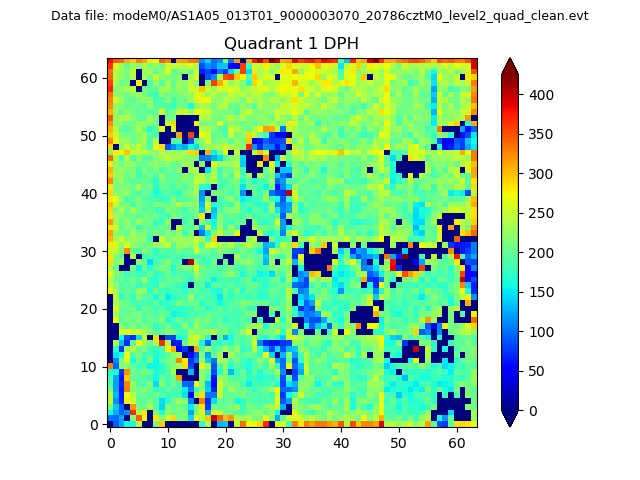 |
Quadrant B |
|---|---|---|---|
| Quadrant D | 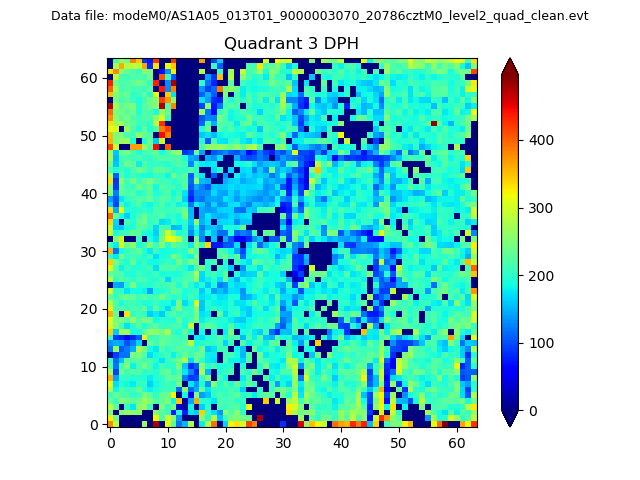 |
 |
Quadrant C |
| Plot type | Count rate plots | Images |
|---|---|---|
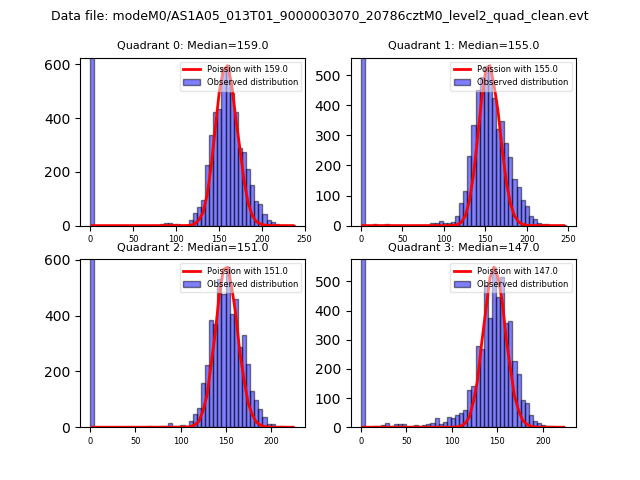
| Comparison with Poisson distribution Blue bars denote a histogram of data divided into 1 sec bins. Red curve is a Poisson curve with rate = median count rate of data. |
 |
 |
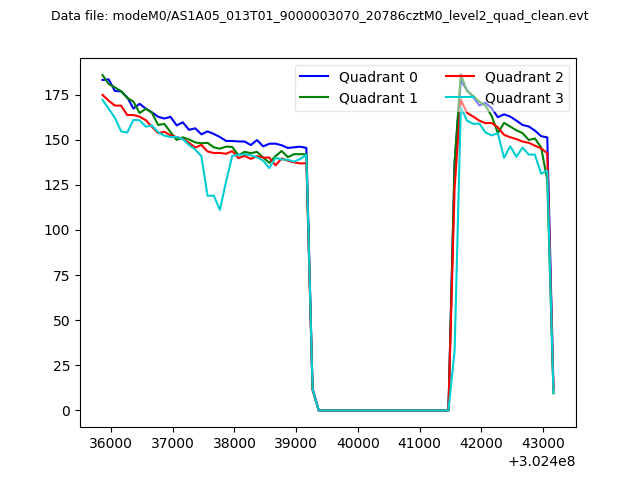
| Quadrant-wise count rates Data is divided into 100 sec bins |
 |
|
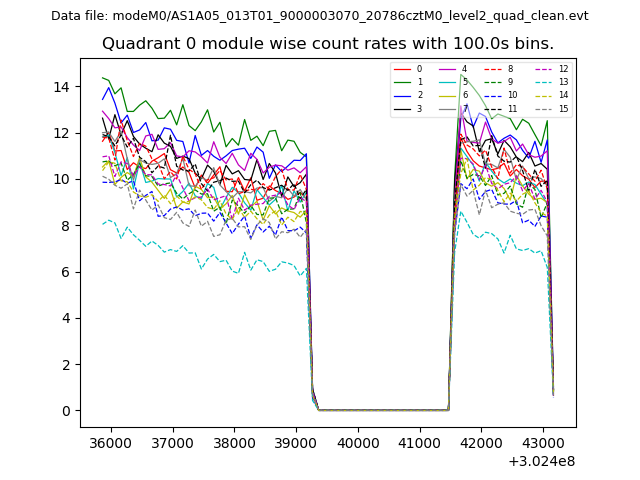
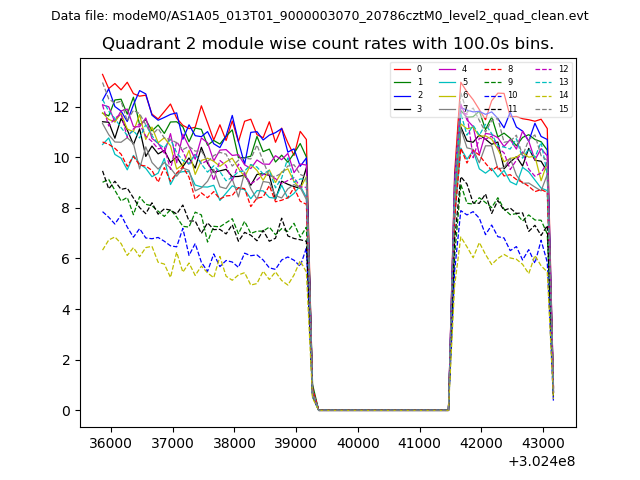
| Module-wise count rates for Quadrant A Data is divided into 100 sec bins |
 |
 |
| Module-wise count rates for Quadrant B Data is divided into 100 sec bins |
 |
 |
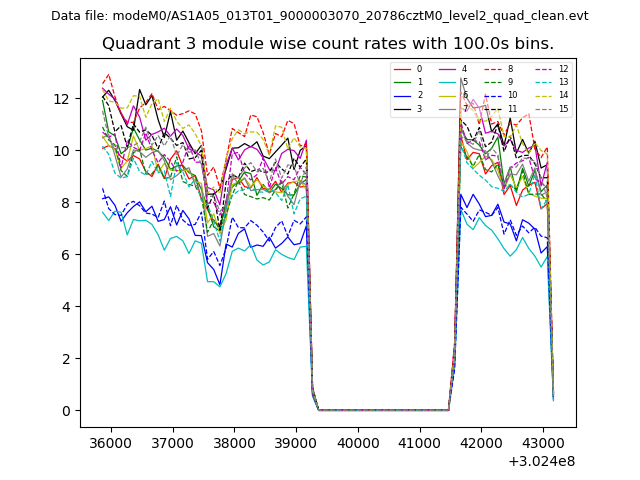
| Module-wise count rates for Quadrant C Data is divided into 100 sec bins |
 |
 |
| Module-wise count rates for Quadrant D Data is divided into 100 sec bins |
 |
 |
| Parameter | Plot |
|---|---|
| CZT HV Monitor |  |
| D_VDD | 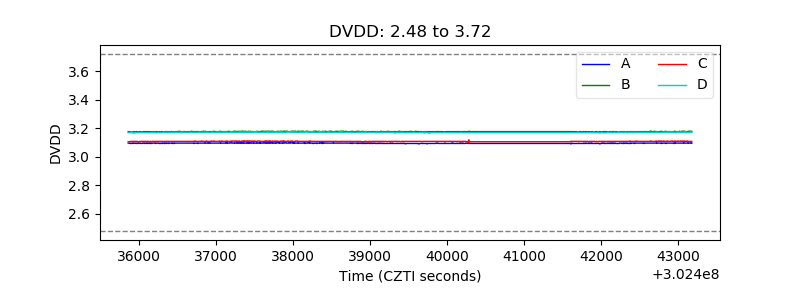 |
| Temperature 1 | 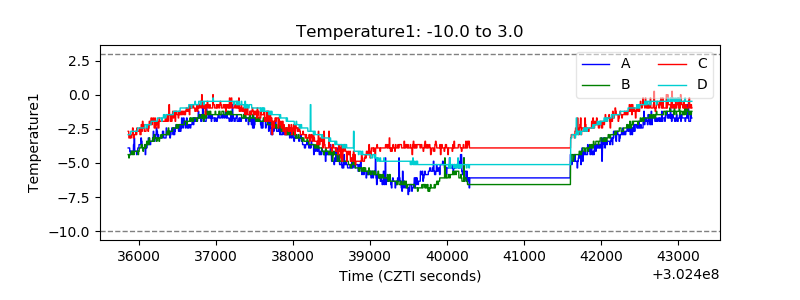 |
| Veto HV Monitor | 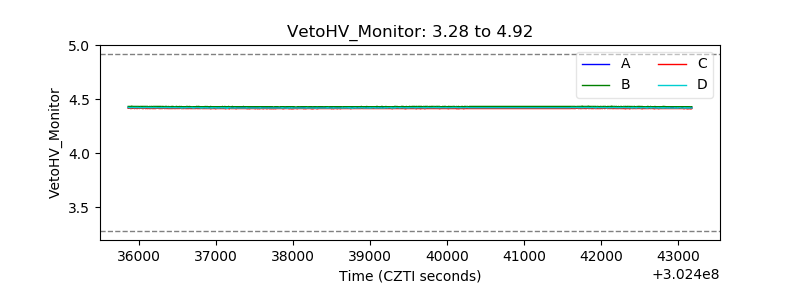 |
| Veto LLD |  |
| Alpha Counter | 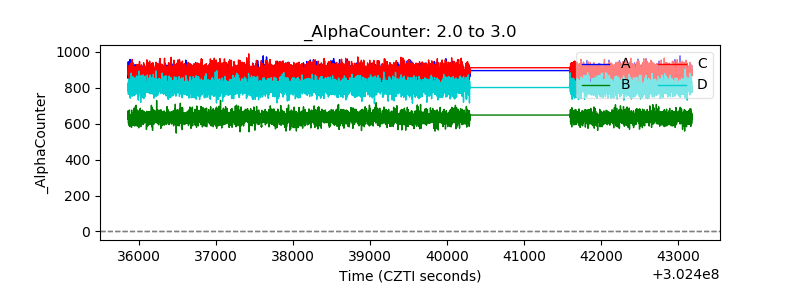 |
| _CPM_Rate | 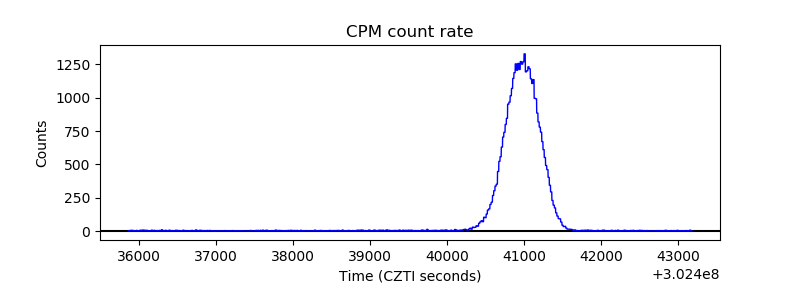 |
| CZT Counter | 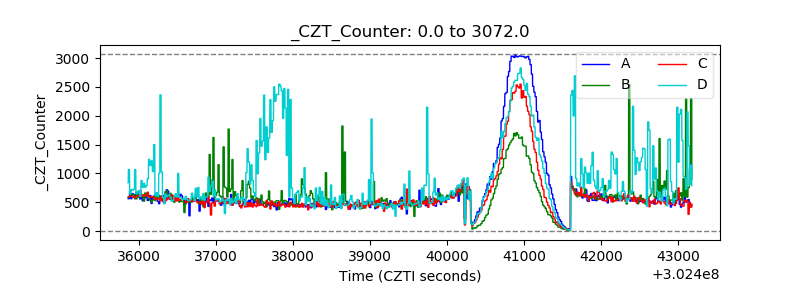 |
| +2.5 Volts monitor |  |
| +5 Volts monitor | 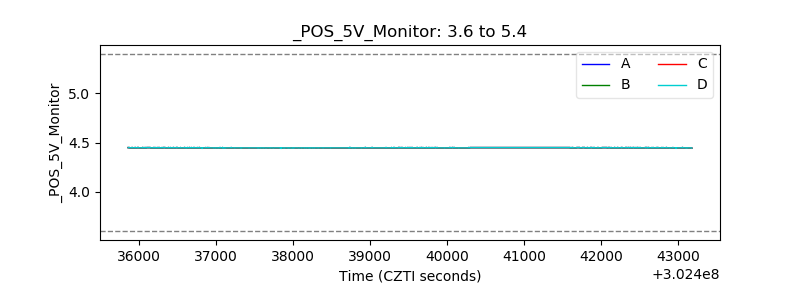 |
| _ROLL_ROT | 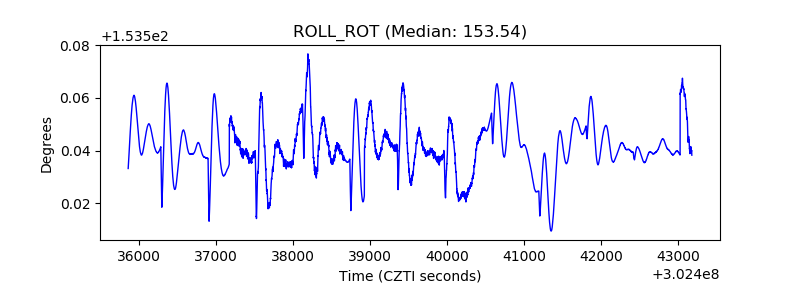 |
| _Roll_DEC | 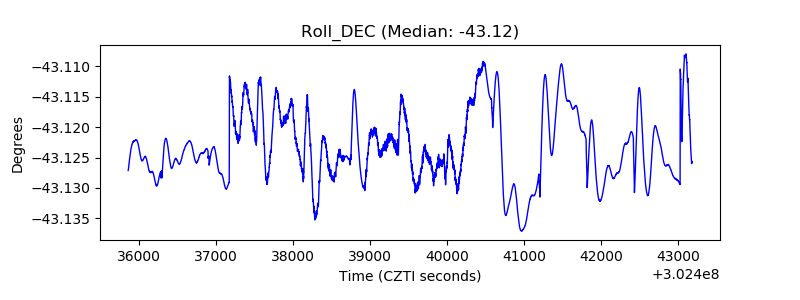 |
| _Roll_RA |  |
| Veto Counter | 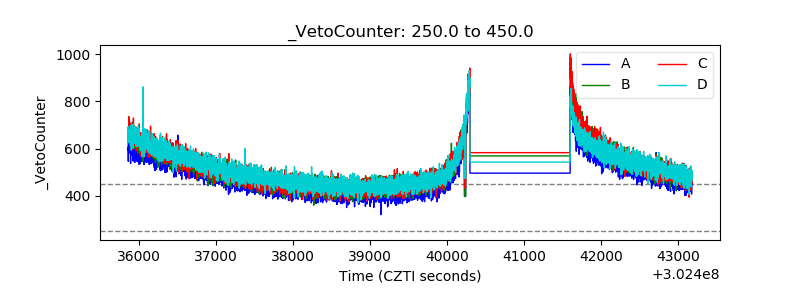 |