| Param | Original file | Final file |
|---|---|---|
| Filename | modeM0/AS1A05_013T01_9000003070_20787cztM0_level2.evt | modeM0/AS1A05_013T01_9000003070_20787cztM0_level2_quad_clean.evt |
| Size (bytes) | 571,003,200 | 97,701,120 |
| Size | 544.6 MB | 93.2 MB |
| Events in quadrant A | 3,025,739 | 671,469 |
| Events in quadrant B | 3,764,461 | 646,110 |
| Events in quadrant C | 2,972,183 | 632,952 |
| Events in quadrant D | 7,119,148 | 584,037 |
| Mode SS | |||
|---|---|---|---|
| Quadrant | BADHDUFLAG | Total packets | Discarded packets |
| A | 0 | 124 | 0 |
| B | 0 | 124 | 0 |
| C | 0 | 124 | 0 |
| D | 0 | 124 | 0 |
| Mode M0 | |||
|---|---|---|---|
| Quadrant | BADHDUFLAG | Total packets | Discarded packets |
| A | 0 | 12694 | 1 |
| B | 0 | 15106 | 1 |
| C | 0 | 12616 | 1 |
| D | 0 | 25421 | 2 |
| Mode M9 | |||
|---|---|---|---|
| Quadrant | BADHDUFLAG | Total packets | Discarded packets |
| A | 0 | 12 | 0 |
| B | 0 | 12 | 0 |
| C | 0 | 12 | 0 |
| D | 0 | 12 | 0 |
| Quadrant | Total seconds | Saturated seconds | Saturation percentage |
|---|---|---|---|
| A | 6071 | 77 | 1.268325% |
| B | 6072 | 180 | 2.964427% |
| C | 6072 | 84 | 1.383399% |
| D | 6071 | 1136 | 18.711909% |
Noise dominated data is calculated using 1-second bins in cleaned event files. If a bin has >2000 counts, and if more than 50% of those come from <1% of pixels, then it is considered to be noise-dominated and hence unusable.
| Quadrant | # 1 sec bins | Bins with >0 counts | Bins with >2000 counts | High rate bins dominated by noise | Noise dominated (total time) | Noise dominated (detector-on time) | Marked lightcurve |
|---|---|---|---|---|---|---|---|
| A | 7261 | 6071 | 0 | 0 | 0.00% | 0.00% | 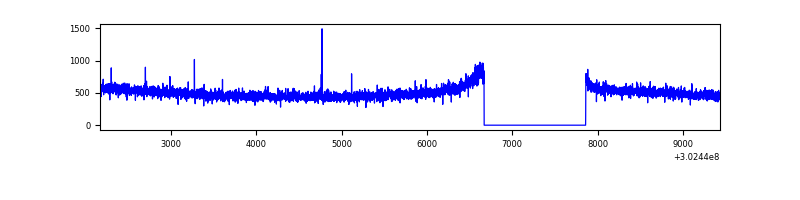 |
| B | 7262 | 6073 | 79 | 79 | 1.09% | 1.30% | 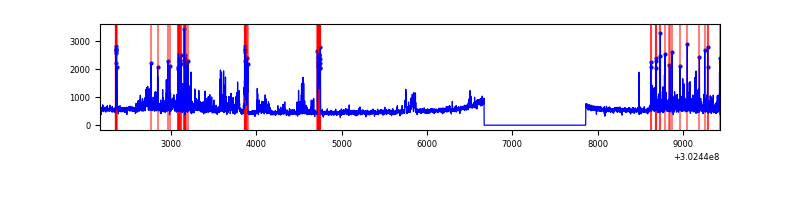 |
| C | 7262 | 6073 | 0 | 0 | 0.00% | 0.00% | 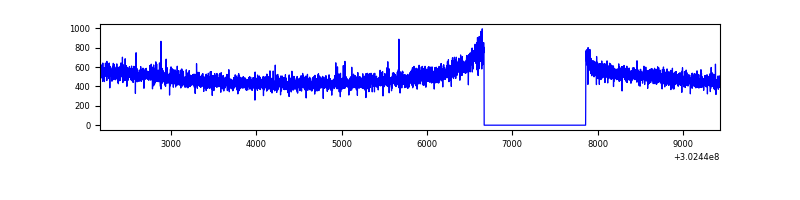 |
| D | 7261 | 6071 | 926 | 926 | 12.75% | 15.25% | 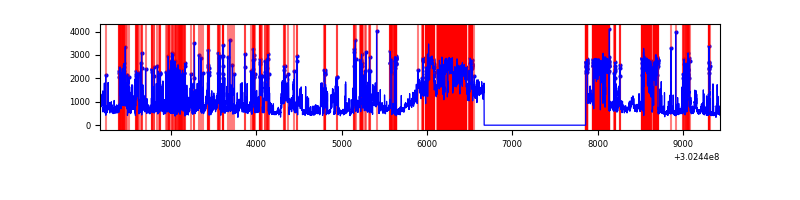 |
Top three noisy pixels from each quadrant. If the there are fewer than three noisy pixels in the level2.evt file, extra rows are filled as -1
| Pixel properties | Quadrant properties | ||||||
|---|---|---|---|---|---|---|---|
| Quadrant | DetID | PixID | Counts | Sigma | Mean | Median | Sigma |
| A | 0 | 226 | 7074 | 39.99 | 786 | 772 | 157.6 |
| A | 3 | 137 | 5924 | 32.7 | 786 | 772 | 157.6 |
| A | 12 | 194 | 5846 | 32.2 | 786 | 772 | 157.6 |
| B | 7 | 220 | 378918 | 2620.72 | 760 | 743 | 144.3 |
| B | 0 | 182 | 259215 | 1791.19 | 760 | 743 | 144.3 |
| B | 3 | 64 | 39003 | 265.14 | 760 | 743 | 144.3 |
| C | 14 | 238 | 116607 | 682.64 | 731 | 738 | 169.7 |
| C | 13 | 61 | 5274 | 26.72 | 731 | 738 | 169.7 |
| C | 7 | 247 | 4143 | 20.06 | 731 | 738 | 169.7 |
| D | 1 | 52 | 2691861 | 16239.54 | 689 | 671 | 165.7 |
| D | 1 | 20 | 1022137 | 6163.87 | 689 | 671 | 165.7 |
| D | 12 | 227 | 586554 | 3535.41 | 689 | 671 | 165.7 |
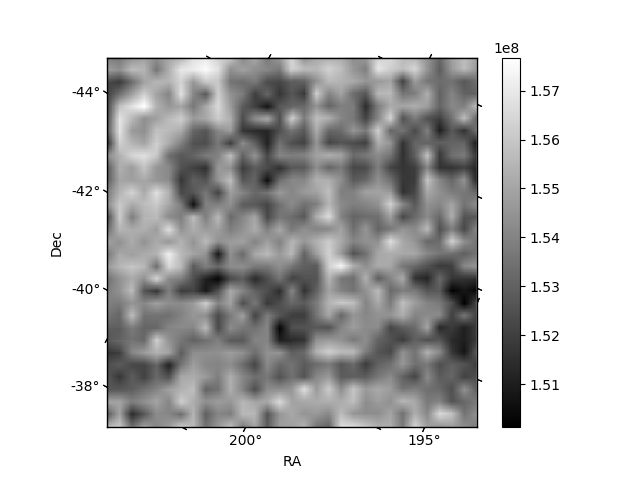
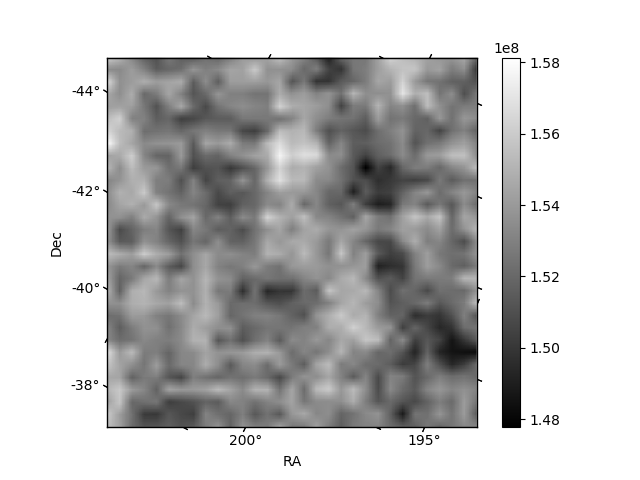
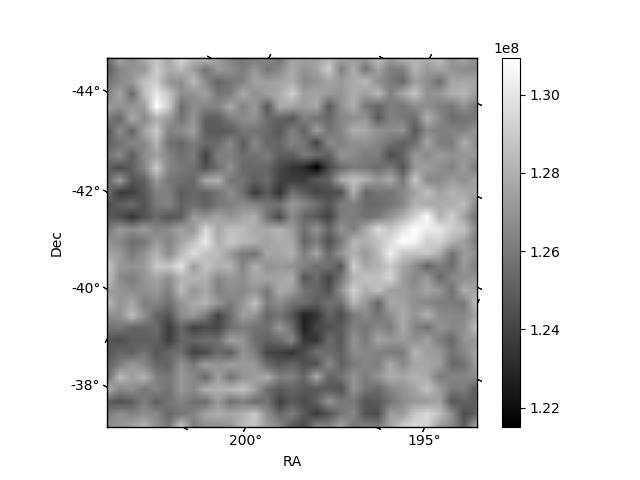
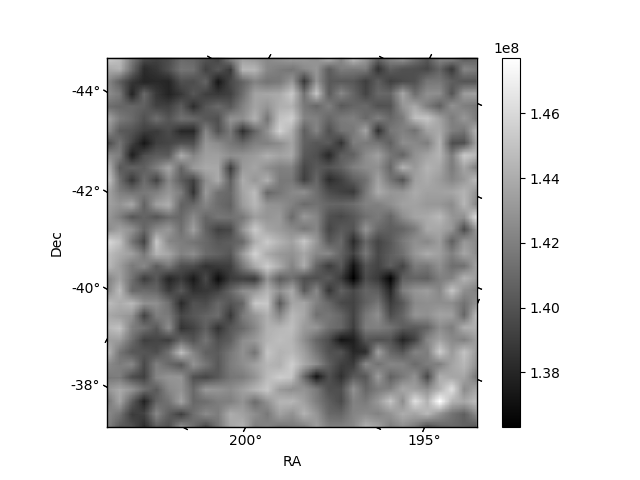
Histogram calculated using DETX and DETY for each event in the final _common_clean file
| Quadrant A | 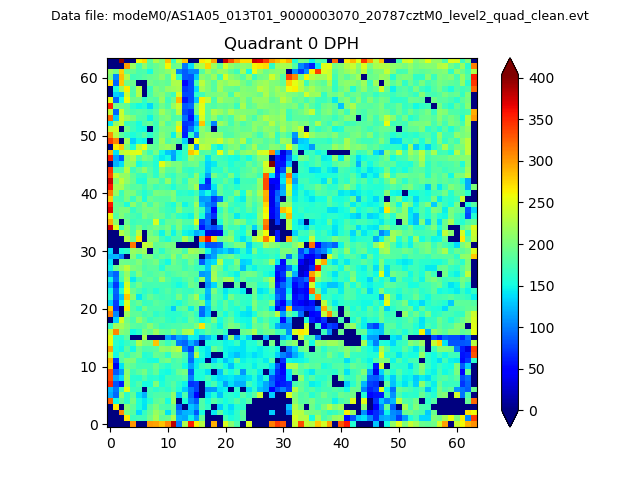 |
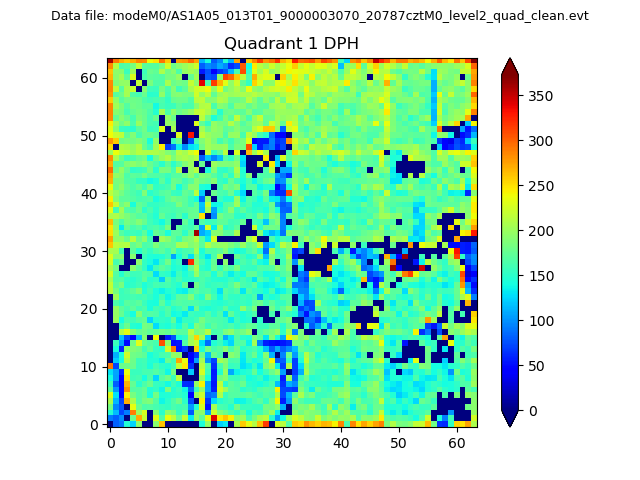 |
Quadrant B |
|---|---|---|---|
| Quadrant D |  |
 |
Quadrant C |
| Plot type | Count rate plots | Images |
|---|---|---|
| Comparison with Poisson distribution Blue bars denote a histogram of data divided into 1 sec bins. Red curve is a Poisson curve with rate = median count rate of data. |
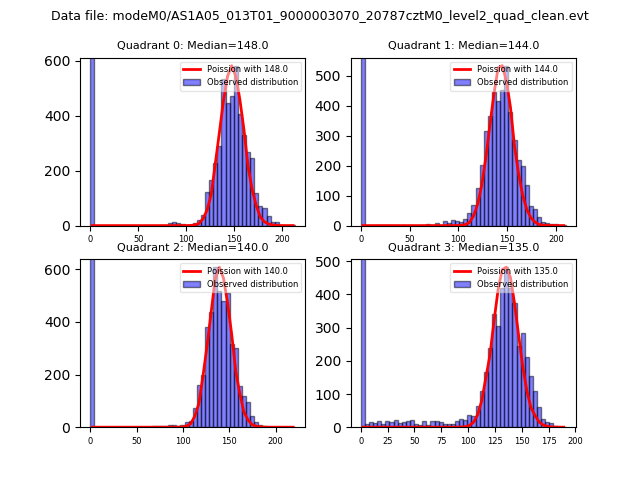 |
 |
| Quadrant-wise count rates Data is divided into 100 sec bins |
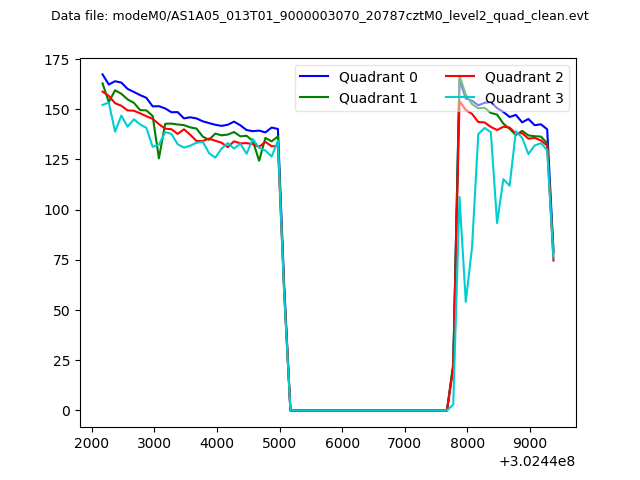 |
|
| Module-wise count rates for Quadrant A Data is divided into 100 sec bins |
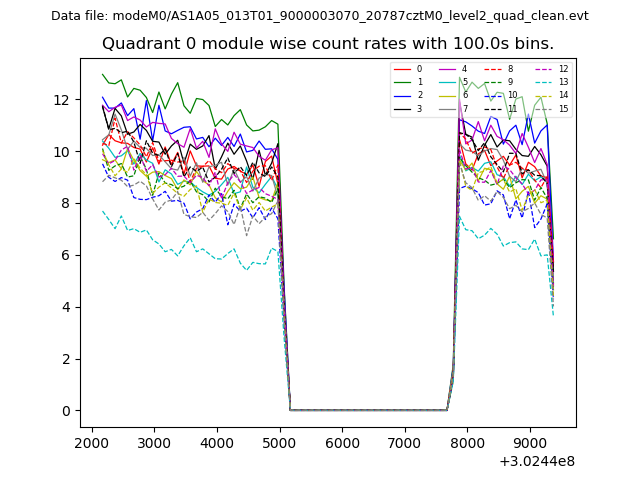 |
 |
| Module-wise count rates for Quadrant B Data is divided into 100 sec bins |
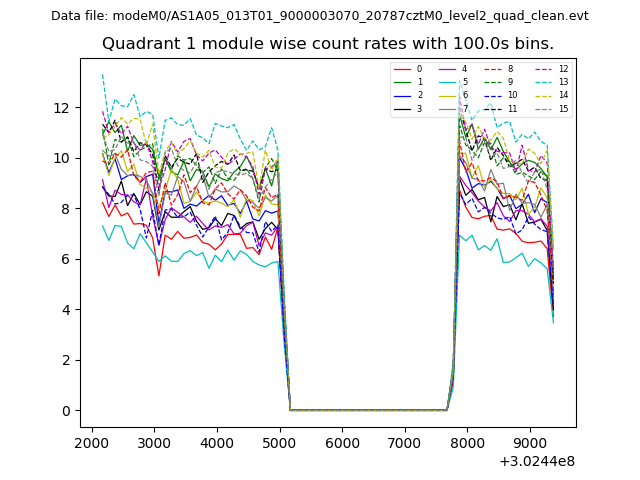 |
 |
| Module-wise count rates for Quadrant C Data is divided into 100 sec bins |
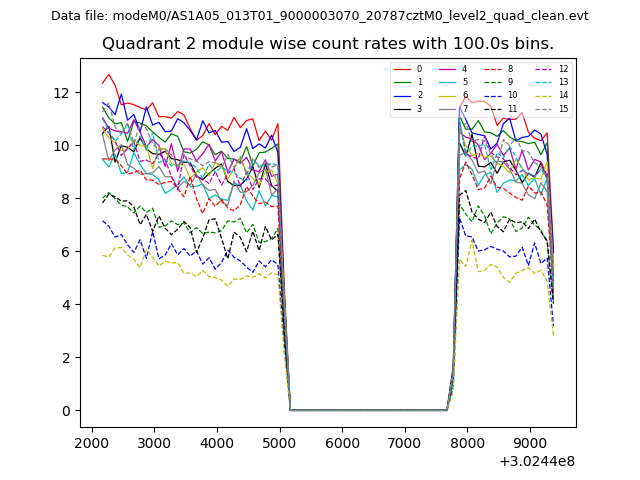 |
 |
| Module-wise count rates for Quadrant D Data is divided into 100 sec bins |
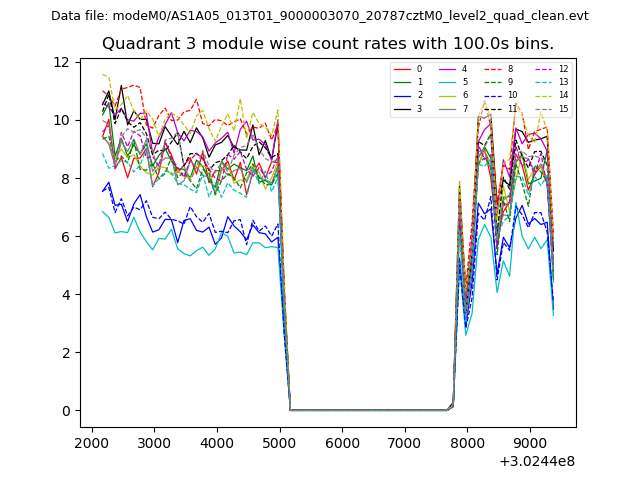 |
 |
| Parameter | Plot |
|---|---|
| CZT HV Monitor | 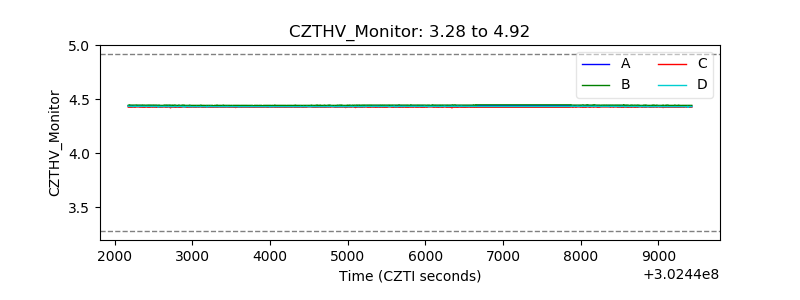 |
| D_VDD | 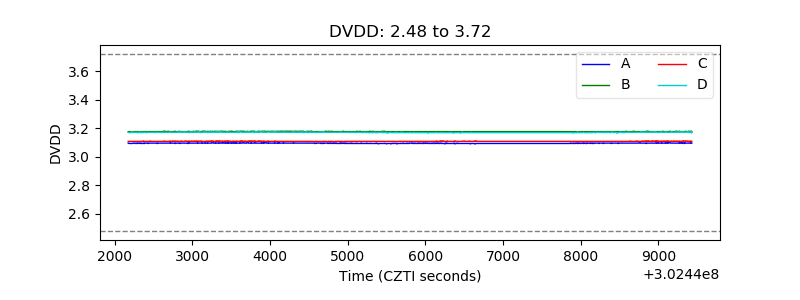 |
| Temperature 1 | 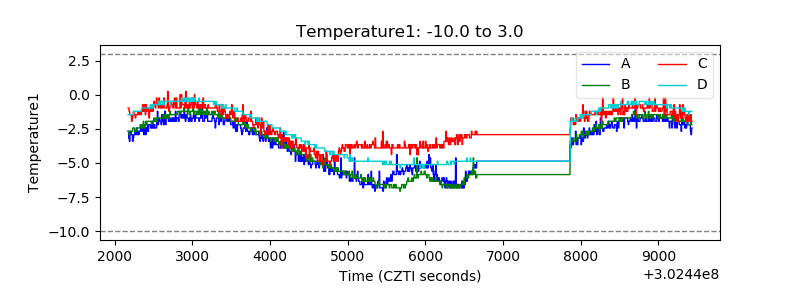 |
| Veto HV Monitor | 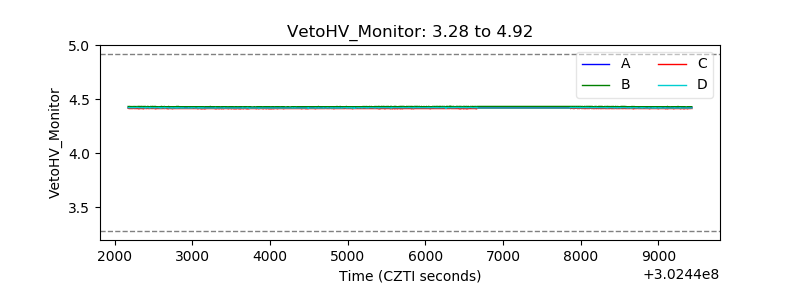 |
| Veto LLD | 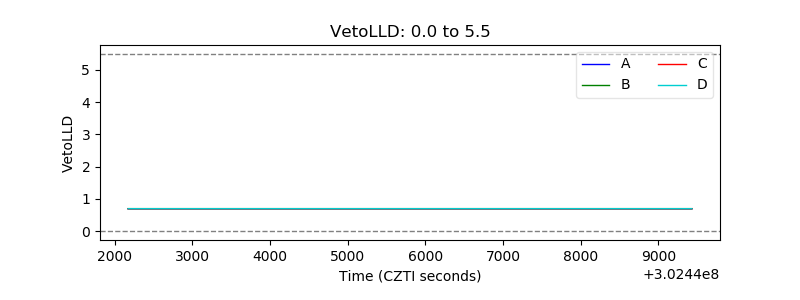 |
| Alpha Counter | 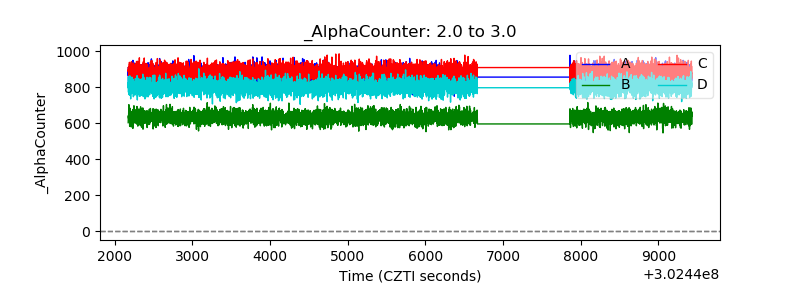 |
| _CPM_Rate | 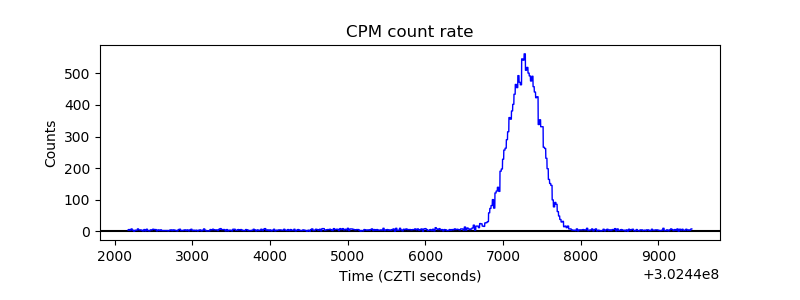 |
| CZT Counter |  |
| +2.5 Volts monitor |  |
| +5 Volts monitor | 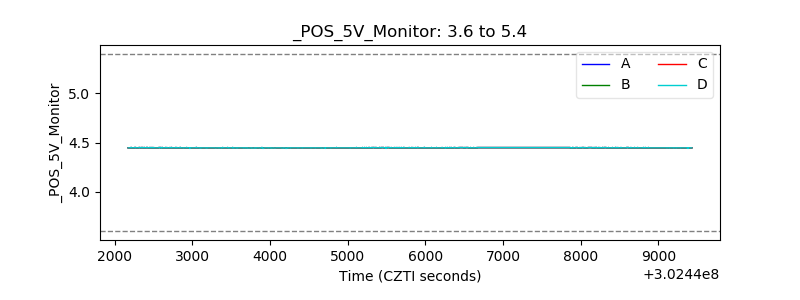 |
| _ROLL_ROT | 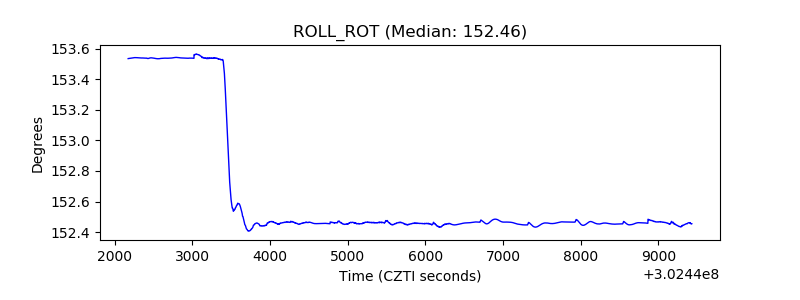 |
| _Roll_DEC | 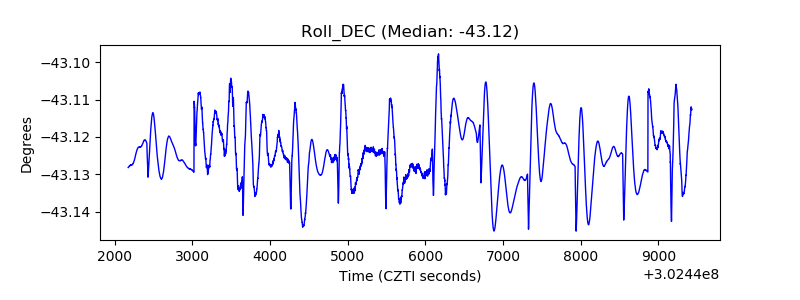 |
| _Roll_RA | 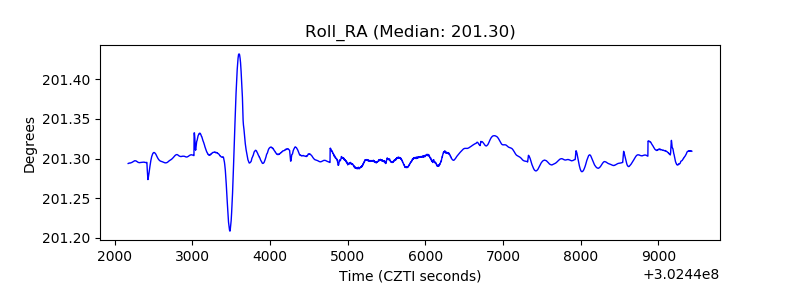 |
| Veto Counter | 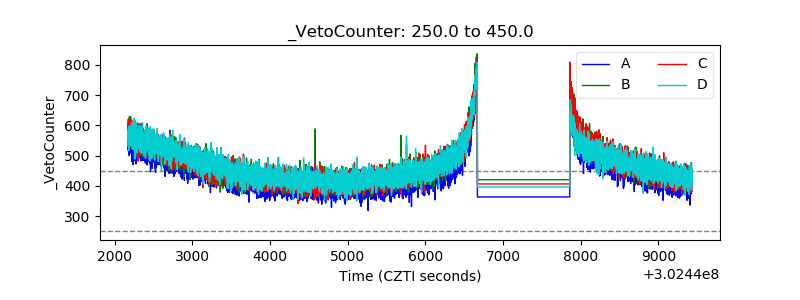 |