| Param | Original file | Final file |
|---|---|---|
| Filename | modeM0/AS1A05_013T01_9000003070_20788cztM0_level2.evt | modeM0/AS1A05_013T01_9000003070_20788cztM0_level2_quad_clean.evt |
| Size (bytes) | 587,687,040 | 92,217,600 |
| Size | 560.5 MB | 87.9 MB |
| Events in quadrant A | 3,050,059 | 620,962 |
| Events in quadrant B | 3,662,495 | 596,112 |
| Events in quadrant C | 3,027,951 | 588,903 |
| Events in quadrant D | 7,625,773 | 542,007 |
| Mode SS | |||
|---|---|---|---|
| Quadrant | BADHDUFLAG | Total packets | Discarded packets |
| A | 0 | 130 | 0 |
| B | 0 | 130 | 0 |
| C | 0 | 130 | 0 |
| D | 0 | 130 | 0 |
| Mode M0 | |||
|---|---|---|---|
| Quadrant | BADHDUFLAG | Total packets | Discarded packets |
| A | 0 | 13125 | 1 |
| B | 0 | 14980 | 2 |
| C | 0 | 13135 | 1 |
| D | 0 | 26959 | 1 |
| Mode M9 | |||
|---|---|---|---|
| Quadrant | BADHDUFLAG | Total packets | Discarded packets |
| A | 0 | 8 | 0 |
| B | 0 | 8 | 0 |
| C | 0 | 8 | 0 |
| D | 0 | 8 | 0 |
| Quadrant | Total seconds | Saturated seconds | Saturation percentage |
|---|---|---|---|
| A | 6366 | 68 | 1.068175% |
| B | 6365 | 212 | 3.330715% |
| C | 6365 | 85 | 1.335428% |
| D | 6365 | 1649 | 25.907306% |
Noise dominated data is calculated using 1-second bins in cleaned event files. If a bin has >2000 counts, and if more than 50% of those come from <1% of pixels, then it is considered to be noise-dominated and hence unusable.
| Quadrant | # 1 sec bins | Bins with >0 counts | Bins with >2000 counts | High rate bins dominated by noise | Noise dominated (total time) | Noise dominated (detector-on time) | Marked lightcurve |
|---|---|---|---|---|---|---|---|
| A | 7181 | 6366 | 0 | 0 | 0.00% | 0.00% | 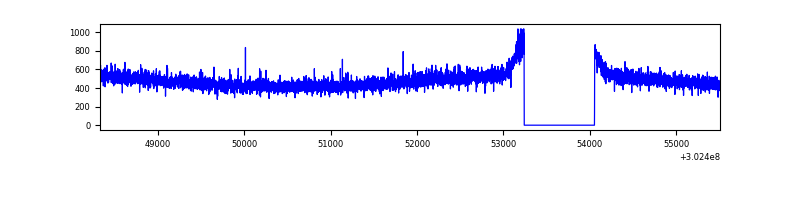 |
| B | 7179 | 6364 | 125 | 125 | 1.74% | 1.96% | 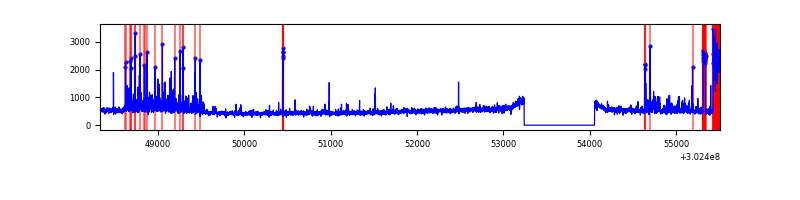 |
| C | 7180 | 6366 | 0 | 0 | 0.00% | 0.00% | 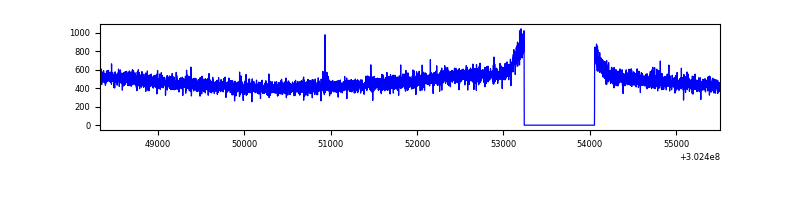 |
| D | 7180 | 6365 | 1402 | 1402 | 19.53% | 22.03% | 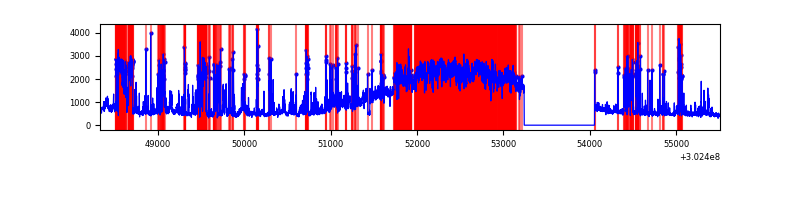 |
Top three noisy pixels from each quadrant. If the there are fewer than three noisy pixels in the level2.evt file, extra rows are filled as -1
| Pixel properties | Quadrant properties | ||||||
|---|---|---|---|---|---|---|---|
| Quadrant | DetID | PixID | Counts | Sigma | Mean | Median | Sigma |
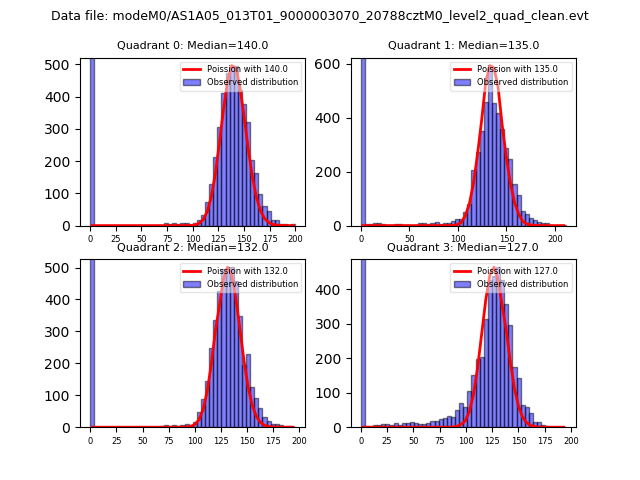
| A | 0 | 226 | 7084 | 39.47 | 793 | 776 | 159.8 |
| A | 3 | 137 | 6203 | 33.96 | 793 | 776 | 159.8 |
| A | 12 | 194 | 5760 | 31.19 | 793 | 776 | 159.8 |
| B | 7 | 220 | 252890 | 1730.79 | 768 | 751 | 145.7 |
| B | 0 | 182 | 228845 | 1565.74 | 768 | 751 | 145.7 |
| B | 3 | 64 | 39629 | 266.87 | 768 | 751 | 145.7 |
| C | 14 | 238 | 116914 | 670.4 | 745 | 748 | 173.3 |
| C | 7 | 247 | 6788 | 34.86 | 745 | 748 | 173.3 |
| C | 13 | 61 | 5234 | 25.89 | 745 | 748 | 173.3 |
| D | 1 | 20 | 2865880 | 17132.07 | 690 | 670 | 167.2 |
| D | 1 | 52 | 1816674 | 10858.51 | 690 | 670 | 167.2 |
| D | 12 | 227 | 149478 | 889.77 | 690 | 670 | 167.2 |
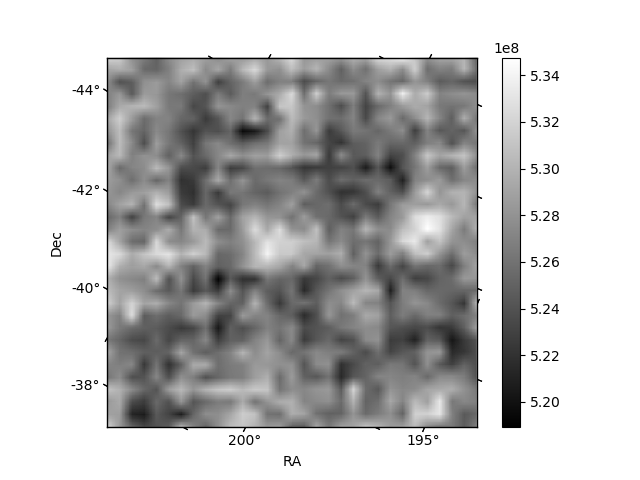
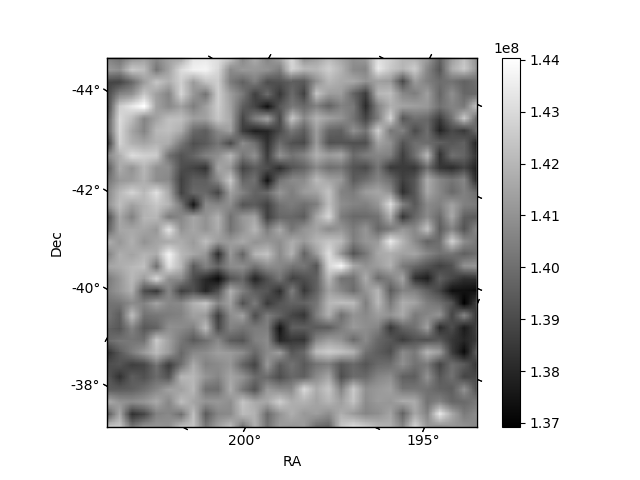
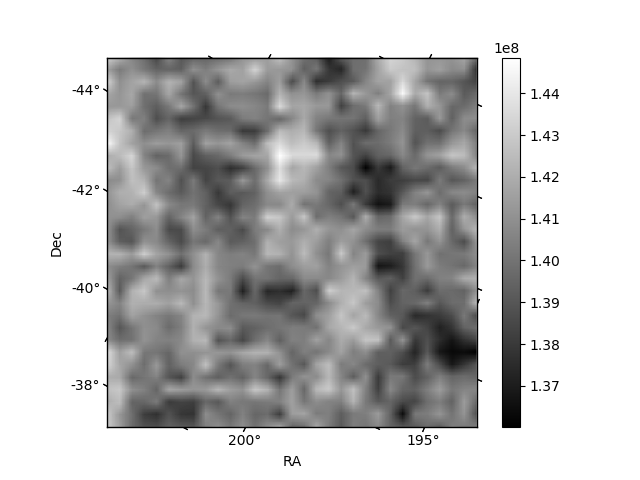
Histogram calculated using DETX and DETY for each event in the final _common_clean file
| Quadrant A | 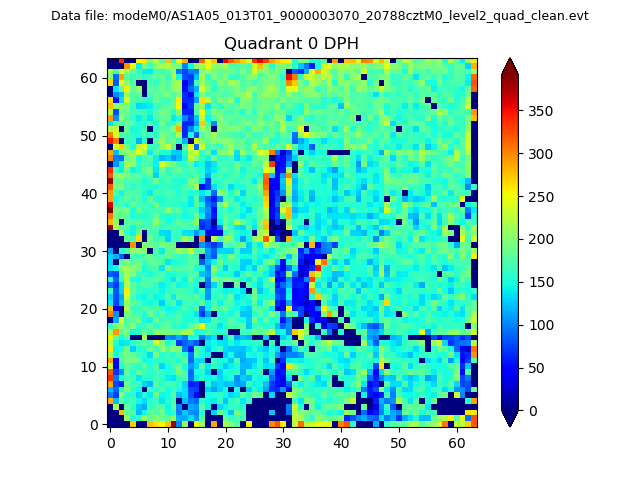 |
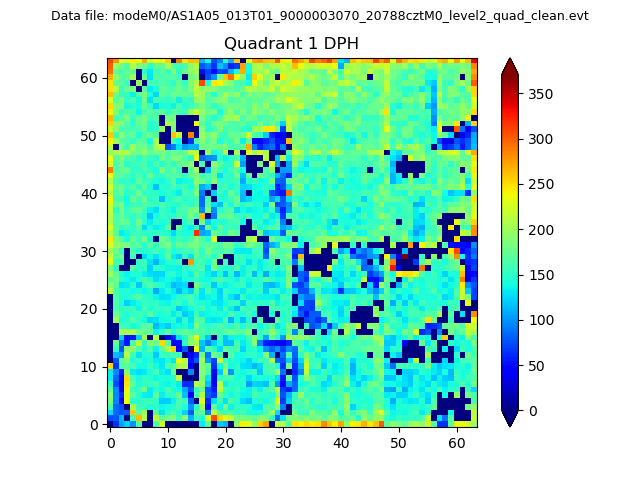 |
Quadrant B |
|---|---|---|---|
| Quadrant D | 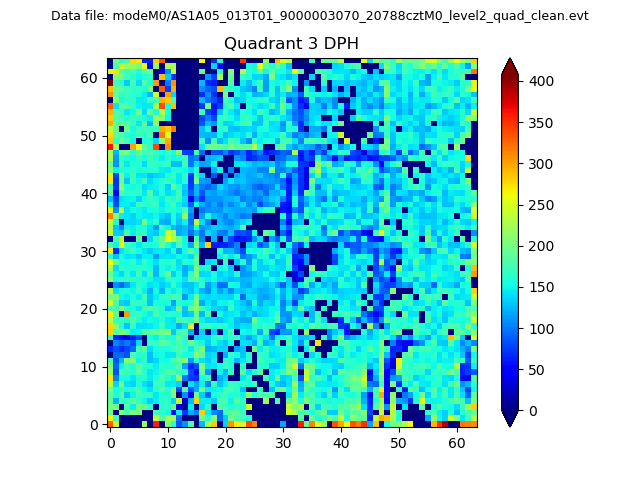 |
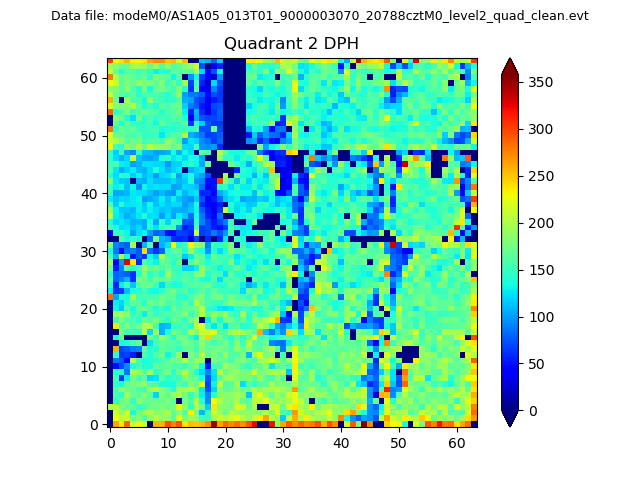 |
Quadrant C |
| Plot type | Count rate plots | Images |
|---|---|---|
| Comparison with Poisson distribution Blue bars denote a histogram of data divided into 1 sec bins. Red curve is a Poisson curve with rate = median count rate of data. |
 |
 |
| Quadrant-wise count rates Data is divided into 100 sec bins |
 |
|
| Module-wise count rates for Quadrant A Data is divided into 100 sec bins |
 |
 |
| Module-wise count rates for Quadrant B Data is divided into 100 sec bins |
 |
 |
| Module-wise count rates for Quadrant C Data is divided into 100 sec bins |
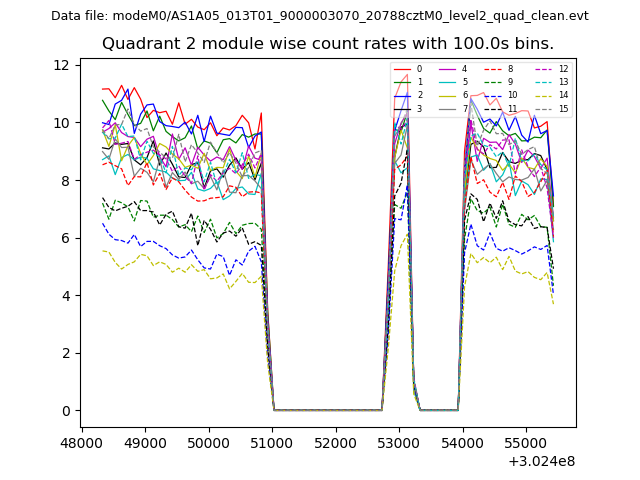 |
 |
| Module-wise count rates for Quadrant D Data is divided into 100 sec bins |
 |
 |
| Parameter | Plot |
|---|---|
| CZT HV Monitor |  |
| D_VDD |  |
| Temperature 1 | 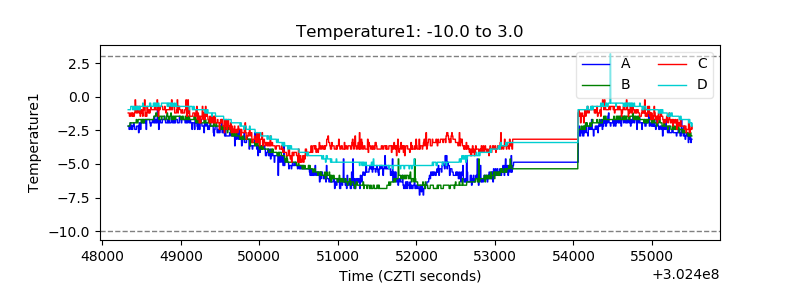 |
| Veto HV Monitor | 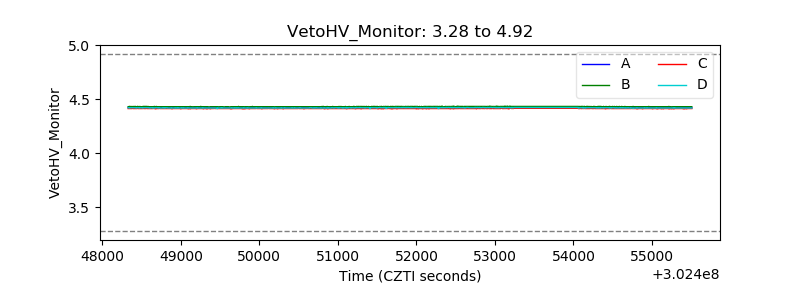 |
| Veto LLD |  |
| Alpha Counter | 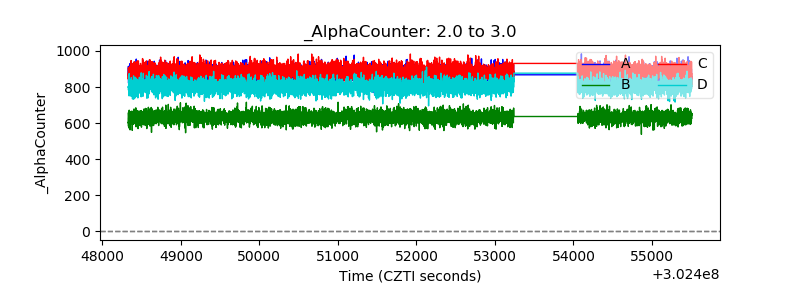 |
| _CPM_Rate | 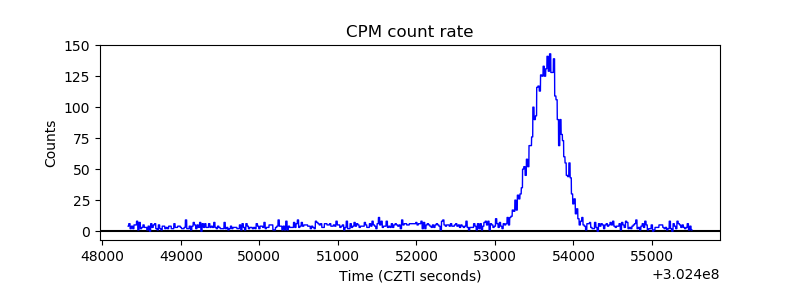 |
| CZT Counter | 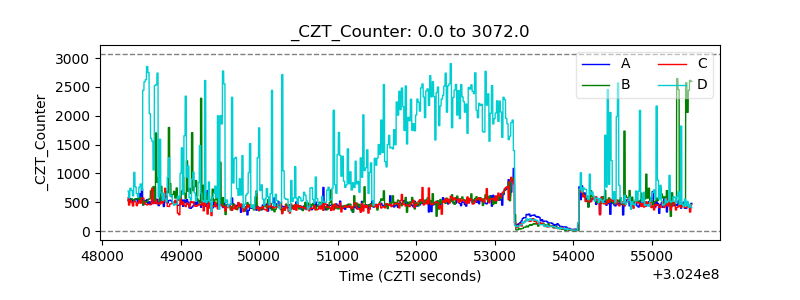 |
| +2.5 Volts monitor |  |
| +5 Volts monitor | 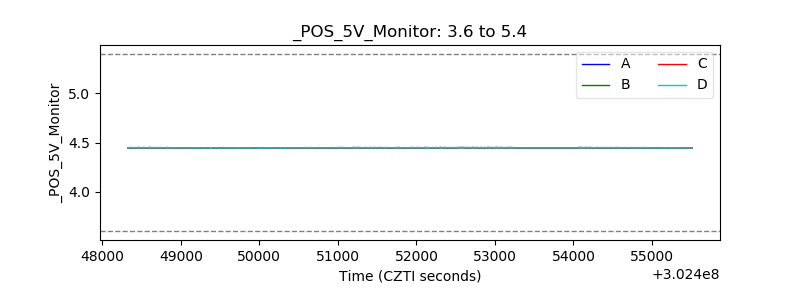 |
| _ROLL_ROT |  |
| _Roll_DEC | 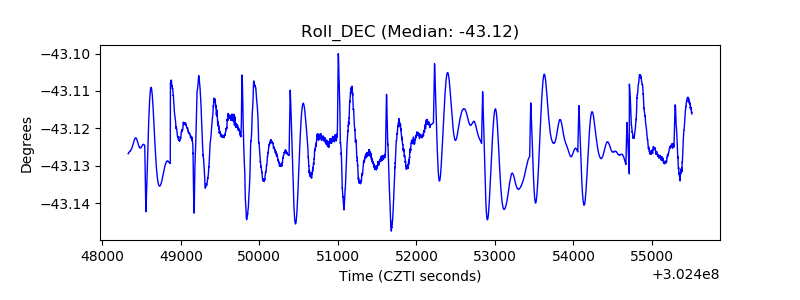 |
| _Roll_RA | 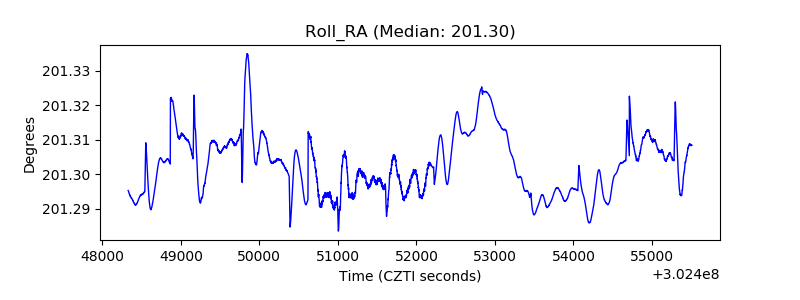 |
| Veto Counter |  |